


Abstract
Laser-driven proton acceleration from ultrathin foils in the relativistic transparency regime is investigated using 2D and 3D particle-in-cell simulations. The optimisation of the maximum proton energy and the overall laser-to-proton energy conversion efficiency with the onset of transparency is investigated for linearly and circularly polarised laser light at intensities up to 2 × 10²³ W cm−2. The effects of the rising edge of the laser intensity profile and radiation reaction at the most extreme laser intensity are considered. It is found that the time at which transparency occurs relative to the peak of the laser pulse interacting with the plasma is a defining parameter in the optimisation of proton acceleration, over the full range of parameters explored.
Export citation and abstract BibTeX RIS

Original content from this work may be used under the terms of the Creative Commons Attribution 4.0 licence. Any further distribution of this work must maintain attribution to the author(s) and the title of the work, journal citation and DOI.
1. Introduction
Over the past two decades, short pulse laser-driven ion acceleration has emerged as a potentially compact approach for the generation of pulses of ions with tens-of-MeV energies [1]. This is possible due to the high magnitude electric fields, of the order of MV μm−1, produced in plasma irradiated by relativistically intense laser light. The resulting ion bunches are ultra-short in duration (of the order of the laser pulse duration at source), high flux, typically broadband in energy, and have a virtual source size of the order of a micron [2]. Numerous potential applications have been proposed including hadron therapy [3–5], radioisotope generation [6], non-destructive testing [7, 8], radiation hardness testing [9], as a driver for the fast ignition approach to inertial confinement fusion [10], as well as fundamental science applications in ultra-fast imaging [11], nuclear physics [12] and warm dense matter physics [13, 14]. Significant challenges remain in the development of these novel accelerators, including finding pathways to increase the achievable ion energies, decrease beam divergence, and improve laser-to-ion energy conversion efficiency and shot-to-shot stability. Much of the work done to address these challenges has focussed on the investigation and development of acceleration mechanisms.
Laser-driven ion acceleration can occur in underdense (gaseous) plasma via the generation and propagation of collisionless shock waves [15, 16] and in near critical density plasma via the generation of magnetic dipole vortex structures [17, 18]. Higher ion energies are typically achieved using thin foil targets and the most widely explored mechanism to date is target normal sheath acceleration (TNSA) [19]. This occurs when fast electrons generated by the laser interaction at the target front side, propagate within the foil and generate MV μm−1 electric fields at the surfaces. Ions originating near the surfaces and within surface contaminant layers are accelerated, with measured proton energies up to ∼85 MeV attributed to this mechanism [20]. While TNSA is a robust scheme, the scaling of the fast electron temperature with the square root of laser intensity (for relativistic laser intensities) [21] means that ultra-high intensities are required to achieve the high ion energies needed for applications such as hadron therapy [3–5].
Radiation pressure acceleration (RPA) [22, 23] also occurs in dense plasma and utilises laser light pressure, resulting in a much faster maximum ion energy scaling with intensity. This approach can in principle produce a peaked energy distribution and result in high laser-to-ion energy conversion efficiencies, which are required for some applications [24]. RPA occurs via hole boring [21, 23, 25] for plasma much thicker than the laser skin depth. The highest energies are achieved for ultrathin foils, via the light sail mode of RPA (LS-RPA) [22, 26, 27]. This mode is, however, susceptible to transverse instabilities and undesirable plasma heating as the target deforms under the radiation pressure [28–30]. RPA is also curtailed if relativistic self-induced transparency (RSIT) [31], driven by the relativistic increase in the mass of plasma electrons oscillating in response to the laser field, occurs. The resulting decrease in the plasma frequency, or effective increase in the relativistic critical density  , where γe is the Lorentz factor of the electrons and
  is the classical critical density for light with angular frequency ωL, enables laser light transmission. At the laser intensities achievable at present, RSIT in initially solid density targets is assisted by an expansion of the target electron population, which decreases the plasma frequency along the axis of laser light propagation [32]. As relativistic transparency occurs at the most intense part of the focussed laser light, a relativistic plasma aperture forms in the foil [33]. The laser light passing through this aperture can diffract, and produce polarisation-dependent structures in the beams of accelerated electrons and ions [33, 34]. Interference of the transmitted light can increase the laser intensity [35] and produce high order spatial modes [36] and high order harmonics [37] of intense light. The transmitted laser light also results in additional heating of the plasma electrons in the region through which it propagates, which can enhance the electric fields and thus ion energies. This forms the basis of the laser break-out afterburner [38–41] mechanism and the transparency-enhanced hybrid RPA–TNSA scheme [42]. Thin foils expanding to near critical densities also open other ion acceleration schemes, such as synchronised acceleration by slow light [43] as the laser propagates into the plasma.
Although RSIT has been demonstrated to enhance the maximum ion energies achievable [40, 42, 44, 45], optimisation and control of this approach is challenging as it depends strongly on rapid nonlinear heating and expansion of the plasma electron population, and is highly susceptible to changes in the laser temporal-intensity profile [46]. At the upper limit of laser intensities achievable at present, the maximum ion energy has been shown to depend on the onset time of transparency [40, 42, 47], and this can be diagnosed experimentally through spectral interferometry of self-generated and laser transmitted light [48]. The exploration of this approach to ion acceleration at the ultrahigh intensities achievable at multi-PW scale laser facilities, for which strong-field effects such as radiation reaction and pair production are expected to become important [49, 50], is just beginning.
In this article, we numerically investigate the optimisation of laser-driven proton acceleration in foils that undergo RSIT, over several orders of magnitude in laser intensity, up to the maximum intensities expected to be achievable at multi-PW laser facilities coming on line in the near future. We demonstrate the dependency of the maximum ion energy and overall laser energy conversion to ions on the onset time of RSIT and explore the underlying physics. We investigate the effects of the laser polarisation and the rising edge component of the laser temporal-intensity contrast. Radiation reaction is also considered for the highest intensity of linearly polarised light simulated. The results inform the design of experiments to optimise laser-driven ion acceleration at next-generation high power laser facilities, and more generally demonstrates RSIT onset time to be a simple parameter that can support the optimisation of ion acceleration in ultrathin foils.
2. Methodology
Laser-driven proton acceleration from CH foil targets with thickness, l, varied over a range for which the target transitions from initially overdense to relativistically underdense during the interaction is investigated as a function of the incident laser pulse intensity, polarisation and temporal-intensity contrast with a series of 2D particle-in-cell (PIC) simulations using the EPOCH code [51]. The laser pulse, incident at target normal, propagates along the x-axis with Gaussian temporal and spatial intensity profiles of pulse duration FWHM τL = 40 fs, focal spot FWHM ϕL = 3 μm and wavelength λL = 0.82 μm, similar to laser parameters on multi-PW laser facilities (see for example [52–54]). Four laser intensities in the range IL = 5 × 10²⁰–2 × 10²³ W cm−2 were simulated for both linear (polarised in the y-direction) and circular polarisation. The laser intensity is hereafter referred to using the value of the normalised vector potential  , where α = 1 and
  for linear and circular polarisation, respectively. The simulated laser intensities correspond to a0 = 16, 50, 160 and 310 for linear polarisation and a0 = 11, 35, 110 and 220 for circular polarisation. The CH (equal mix of carbon and hydrogen) foils were initialised as a fully ionised plasma with electron density ne = 210nc, electron temperature Te = 1 keV, ion temperature Ti = 10 eV and with 50 particles per cell per species. The rising edge of the laser pulse was modelled for linear polarisation and a0 = 16 and 160 using a sech2 profile (in addition to the Gaussian main pulse) with peak intensity 0.01IL and pulse duration such that the intensity rises from an initial value of 5 × 10⁻⁴
IL at 0.4 ps before the laser peak. This profile is similar to typical experimental measurements of the rising edge [55, 56]. The simulation duration before the arrival of the laser peak was extended to accommodate this rising edge profile.
for linear and circular polarisation, respectively. The simulated laser intensities correspond to a0 = 16, 50, 160 and 310 for linear polarisation and a0 = 11, 35, 110 and 220 for circular polarisation. The CH (equal mix of carbon and hydrogen) foils were initialised as a fully ionised plasma with electron density ne = 210nc, electron temperature Te = 1 keV, ion temperature Ti = 10 eV and with 50 particles per cell per species. The rising edge of the laser pulse was modelled for linear polarisation and a0 = 16 and 160 using a sech2 profile (in addition to the Gaussian main pulse) with peak intensity 0.01IL and pulse duration such that the intensity rises from an initial value of 5 × 10⁻⁴
IL at 0.4 ps before the laser peak. This profile is similar to typical experimental measurements of the rising edge [55, 56]. The simulation duration before the arrival of the laser peak was extended to accommodate this rising edge profile.
The simulation grid cell size was defined as 5 nm × 12 nm (x × y) with all the boundaries set to free-space. In order to simulate over the required intensity range while making efficient use of computational resources and avoid loss of the highest energy protons from the box edges, the simulation box size was increased with intensity from a minimum of 40 μm × 36 μm up to a maximum of 84 μm × 96 μm. To ensure foils with l ⩽ 50 nm were well resolved on the simulation grid, these were simulated with l = 50 nm and a reduced density, maintaining the areal density. Ultrathin foils at this scale rapidly expand when irradiated by the leading edge of the laser pulse and therefore modelling them with limited pre-expansion does not significantly change the results. To demonstrate this, a small number of higher resolution (grid cell size of 1.8 nm × 4.32 nm) simulations of non-expanded targets with l < 50 nm were conducted and minimal variation was found, as shown in the supplementary material (https://stacks.iop.org/NJP/24/053016/mmedia).
As 2D simulations are known to overestimate ion acceleration in the RSIT regime [57], a limited set of 3D simulations were also performed for both linear and circular polarisation, for a0 = 16–160 and a0 = 11–110, respectively. For these simulations, the cell size was set to 10 nm × 30 nm × 30 nm (x × y × z). To compensate for the reduction in resolution, all targets simulated were linearly expanded such that the initial electron density was equal to 70nc, but the areal density remained the same as the 210nc targets. Corresponding 2D simulations with the same expanded targets but higher resolution (5 nm × 12 nm) were also performed for comparison. The results from the comparison of 2D and 3D simulation runs are discussed further below.
To calculate the onset time of relativistic transparency, properties of the electron and ion populations were extracted every 0.5 fs within a spatial region of ±0.5 μm about the laser propagation axis and averaged across the y-axis. The Doppler-shifted critical density in the rest frame of the moving plasma is calculated as  , where
  is the average velocity of the ions along the x-axis as a function of their position. The onset of relativistic transparency is determined as the time ne/γe
nc,D
< 1. The temporal reference trsit = 0 corresponds to the arrival of the peak of the laser intensity profile at the position of the relativistic critical density surface immediately before relativistic transparency.
is the average velocity of the ions along the x-axis as a function of their position. The onset of relativistic transparency is determined as the time ne/γe
nc,D
< 1. The temporal reference trsit = 0 corresponds to the arrival of the peak of the laser intensity profile at the position of the relativistic critical density surface immediately before relativistic transparency.
3. Results
3.1. Linear polarisation
In the interaction of the linearly polarised laser pulse with the target, the population of energetic electrons that are produced at the irradiated target front side traverse the target and generate a sheath field at the rear, resulting in ion acceleration via the TNSA mechanism. The laser radiation pressure can also drive forward electrons in a compressed layer at the target front. This charge displacement generates a moving electric field that accelerates ions towards the rear surface as the laser bores into the target. The occurrence of both of these mechanisms can give rise to a dual-peaked electric field, in a hybrid RPA–TNSA acceleration scenario [42, 58], with ions gaining energy from one or both components of the field as they propagate. Across the parameter range explored in this study, the highest proton energies are generally obtained when this hybrid acceleration scenario is enhanced by the onset of RSIT. The propagation of the laser pulse through the classically overdense target during the interaction is well correlated with a rapid increase in the ion energies.
Figure 1 shows a snapshot of the interaction at time t = 17 fs, where t = 0 corresponds to the arrival of the laser peak at x = 0, and after the onset of RSIT for an example l = 125 nm target where a0 = 50. Figures 1(a) and (b) show the electron density, and (c) shows the laser intensity, illustrating the propagation of the laser light through the relativistically underdense (classically overdense) plasma. Here the laser pulse is volumetrically absorbed within the target, generating a larger number of high energy electrons which escape the target, when compared to targets that do not experience RSIT [59]. This is due direct laser acceleration (DLA) [60] of electrons, induced by strong longitudinal electric field structures that form as the laser pulse reflects off and self-focuses through the plasma aperture [61]. At this point, the separation of the DLA electrons from the ions becomes the dominant source of the electric field at the rear of the target.

Figure 1. Snapshots of the simulation grid at t = 17 fs after the arrival of the laser peak intensity at x = 0, and after the onset of RSIT, for l = 125 nm and a0 = 50. (a) Electron density. (b) Electron density normalised by the relativistic critical density, with contour lines where ne = γe nc (green). (c) Intensity of the laser light. (d) Electrostatic field in the x-direction. (e) Average proton energy within each grid cell. (f) Average carbon ion energy within each grid cell. Features (A) and (B) in (d)–(f) indicate the positions for y = 0 of the positive fields co-moving with the accelerating ions.
Download figure:
Standard image High-resolution imageThe x-component of the electrostatic field, calculated by Poisson solving the charge density, is plotted in figure 1(d). The displacement of electrons produces gradients in the charge density and the generation of the positive (in the +x-direction) electrostatic fields labelled (A) and (B), that co-move with the populations of accelerated protons and carbon ions, shown in figures 1(e) and (f), respectively. Dual-peaked field structures, as reported by Qiao et al [58], can originate prior to the onset of transparency due to the radiation pressure induced compression of the electrons at the front surface [23] and the sheath field formed by the fast electron population that reaches the rear of the target [19]. The dual field structure shown here after the onset of transparency forms due to the presence of two ion species with different charge-to-mass ratios; the proton beam is buffered by and propagates ahead of the carbon ion beam due to the higher charge-to-mass ratio of the protons [45, 62].
The proton energy spectra are broad for all laser conditions considered. The maximum proton energy for each individual simulation, normalised to the maximum across the full thickness scan for a given a0 is plotted in figure 2(a) as a function of the onset time of RSIT. The highest proton energies are produced when RSIT occurs close to the arrival of the peak of the laser pulse on target (trsit = 0) for all four laser intensities simulated. The onset of RSIT remains important to the optimisation of ion acceleration up to the ultrahigh intensities expected to be achieved with 10 PW-class lasers. Radiation reaction is not included in the simulations here, we compare the results of simulations with and without radiation reaction for a0 = 310 in section 3.4. The variation of the laser-to-proton energy conversion efficiency with onset time of RSIT is shown in figure 2(b). The conversion efficiency is typically highest when RSIT occurs ∼10 fs after the arrival of the laser peak, and remains high for RSIT at later times. A greater fraction of the laser energy is transferred to the hot electron population, which produces electric fields that accelerate the protons, during the interaction when RSIT occurs on the falling edge of the laser pulse. Measurements using a laser system with τL = 700 fs and a0 = 9 have shown the overall absorption of the laser pulse peaks for the thinnest target that does not become relativistically transparent [59]. Although the overall trend is similar for all four laser intensities, the relative conversion efficiencies achievable are almost a factor of two higher for a0 = 160 than a0 = 16, with little increase from a0 = 160 to a0 = 310.
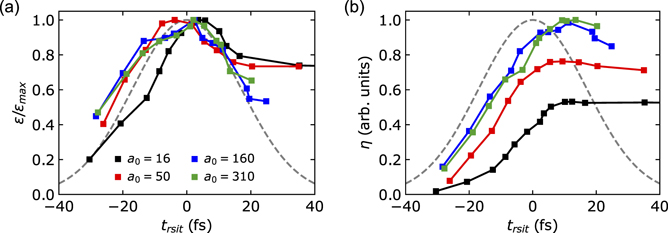
Figure 2. (a) Maximum proton energies achieved in each fixed-intensity scan of target thickness normalised to the maximum value for the whole scan ɛ/ɛmax. The temporal profile of the laser intensity is also plotted (grey dashed). (b) The conversion efficiency of laser energy to protons with energy  MeV.
MeV.
Download figure:
Standard image High-resolution imageTo explore the physics giving rise to these results in more detail, a sample of the highest energy protons is tracked in further simulations for a0 = 50 and three example target thicknesses, l = 50 nm, 125 nm and 225 nm, corresponding to trsit = −19 fs, −4 fs and 14 fs respectively. The highest energy protons generally propagate close to the y = 0 axis, we therefore extract the particle and grid data within |y| < ϕL/4 and track the protons that start within the centre of this region (|y| < ϕL/8) with final energies of at least 85% of the maximum proton energy and divergence half-angle of less than 5°. The particle densities and electric fields extracted are averaged across the y-direction.
Figures 3(a)–(c) show the electron densities and motion of the tracked protons for l = 50 nm, 125 nm and 225 nm, respectively, and figures 3(d)–(f) show the corresponding x-component of the electric fields, Ex , as a function of time. Some of the tracked protons are accelerated by RPA into the target rear side where the whole group experience TNSA and quickly begin to propagate with the ion front of the expanding plasma. For the thinnest targets in figures 3(a) and (b), the onset of RSIT, shown by the termination of the relativistic critical density surface, leads to rapid target expansion as seen by the increase of the electron density beyond the ion front. In figures 3(d) and (e) an increase in the Ex field extending over many microns behind the target is also observed to be concurrent with the onset of RSIT, and is co-located with the electrons rapidly moving away from the target into vacuum. The onset of RSIT in the 225 nm target does not show as significant a change to the electron expansion or Ex field near the tracked protons in figures 3(c) and (f). In all three thickness cases, the density always remains classically overdense but becomes relativistically underdense during the laser pulse interaction, unlike that reported in Yin et al [47] which also became classically underdense. This is potentially due to the shorter pulse duration used in our simulations.
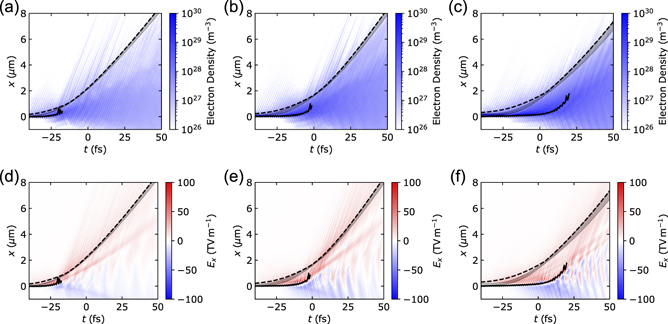
Figure 3. (a)–(c) The electron density along the x-axis for l = 50 nm, 125 nm and 225 nm respectively. The position of the front side relativistic critical density surface (solid, black), the ion front at the target rear side (dashed, black) and the region containing the tracked highest energy protons (shaded, grey) are also plotted. (d)–(f) The longitudinal component of the electric field along the x-axis of the simulation grid for l = 50 nm, 125 nm and 225 nm, respectively.
Download figure:
Standard image High-resolution imageFigures 4(a)–(c) show the mean value of the Ex field near the tracked protons and their mean kinetic energy, as a function of time, for the three target thickness (50 nm, 125 nm and 225 nm, respectively). The dotted vertical line marks the time at which transparency occurs. In all three cases, Ex rises rapidly to a peak of 30–40 TV m−1 at between t = −30 fs and −15 fs (later with increasing thickness) corresponding to the protons moving through the sheath field at the target rear side. As these protons propagate away from the target the magnitude of the sheath field they experience reduces. A secondary peak in Ex of comparable magnitude follows the onset of transparency for l = 50 nm and 125 nm, leading to a rapid increase in the proton energies. For l = 225 nm, transparency occurs late in the interaction and only a minor increase in Ex is observed to follow.
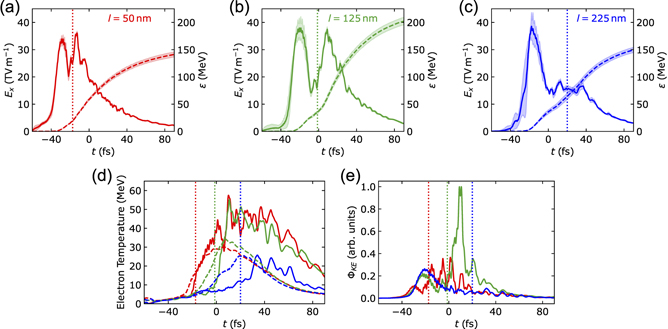
Figure 4. Simulation results for tracking the highest energy protons. (a)–(c) The mean longitudinal electric field, Ex , near the tracked protons (solid) and the mean energy, ɛ, of these protons (dashed) in addition to the standard deviation of these results (shaded) as a function of time for (a) l = 50 nm, (b) l = 125 nm and (c) l = 225 nm, for which trsit = −19 fs, −4 fs and 14 fs, respectively. The vertical dotted line marks the onset time of RSIT. (d) The mean fast electron temperature near the tracked protons (solid) and fast electron temperature within the whole sample region (dashed), for the same three cases. (e) The mean kinetic energy flux, ϕKE, of electrons along the x-axis and near the tracked protons.
Download figure:
Standard image High-resolution imageThe fast electron temperatures within the whole sample region and the mean fast electron temperatures local to the tracked highest energy protons are shown in figure 4(d). The electrons in the thinner targets reach higher temperatures early in the interaction when the target becomes transparent and the fast electron temperature near the tracked protons is much higher for the l = 50 nm and 125 nm targets compared to l = 225 nm. The interaction of the laser light within the target volume when transparency occurs enables electrons to readily overcome the electrostatic potential behind the tracked protons at the rear of the target and reach them with high energies. This increases the energy available to be transferred by the electrons to the electric field ahead of the protons and also causes a rapid blowout of electrons from the target as seen in figures 3(a) and (b). The displacement of electrons is observed to lead to high densities of net positive and negative charge respectively behind and in front of the tracked protons after the onset of RSIT, which produces a strong electrostatic field. Figure 4(e) shows the flux of electron kinetic energy in the +x-direction near the protons is significantly greater for the l = 125 nm target than the others. For this target, where transparency occurs near the peak of the laser pulse, the laser is able to drive the highest amount of fast electron energy up to the tracked protons at the target rear side, where some of it is transferred to the sheath (charge-separation) field and as a result produces the highest energy protons.
Ion energy enhancement is also observed in the relativistic transparency regime when using longer (hundreds-of-femtosecond to picosecond) duration laser pulses [38–42, 46]. In this case, after the onset of relativistic transparency, a jet of fast electrons can be produced, boosting ion energies [41, 42, 46, 63]. The electron jet, which is modulated at the laser frequency, enhances the electric field in a localised region of the sheath, which can appear to steer the highest energy protons away from the target normal axis and towards the axis of laser propagation in the case of thin target irradiated at an oblique angle of incidence [42, 46, 63]. For the shorter pulse duration and normal incidence angle considered here, any jet formation is short lived.
As figure 4(e) shows, the densities fall very quickly for the l = 50 nm target, causing the transparency-enhanced Ex field to be short-lived. For l = 225 nm, when RSIT occurs late in the interaction, less fast electron energy reaches the tracked protons, which have been accelerated away from the target by TNSA earlier in the interaction, limiting the peak Ex field strength they experience after transparency.
We consider the interaction dynamics with pre-expansion by the laser rising edge at different intensities in section 3.3.
3.2. Circular polarisation
We next consider the case of circularly polarised laser light, for which plasma electron heating is reduced due to less j × B absorption for normal laser incidence. As a result, the expansion rate of the target is reduced and the onset of transparency is delayed, such that thinner targets are required for the onset of transparency and RPA can potentially dominate the ion acceleration [64].
The results in figures 5(a) and (b) show that, as observed for linear polarisation, the highest proton energies are achieved when RSIT occurs close to the laser peak and the laser-to-proton energy conversion efficiency is maximised when it occurs slightly after the peak. The thin foils simulated here experience LS-RPA, the deformation of the foil caused by the transverse gradients in radiation pressure across the Gaussian focal spot enables substantial electron heating with the circularly polarised light and the foils can quickly expand as they propagate with the laser pulse, resulting in the onset of transparency. Consequently, for tightly focussed laser pulses as considered here, TNSA and the onset of RSIT can become unavoidable in the interaction when optimising RPA for maximum proton energy with thin foil targets. We find that the velocity of the relativistic critical density surface, which is a measure of the effectiveness of RPA, is generally highest for the targets where the proton energies are also highest, for transparency near the peak of the laser pulse.
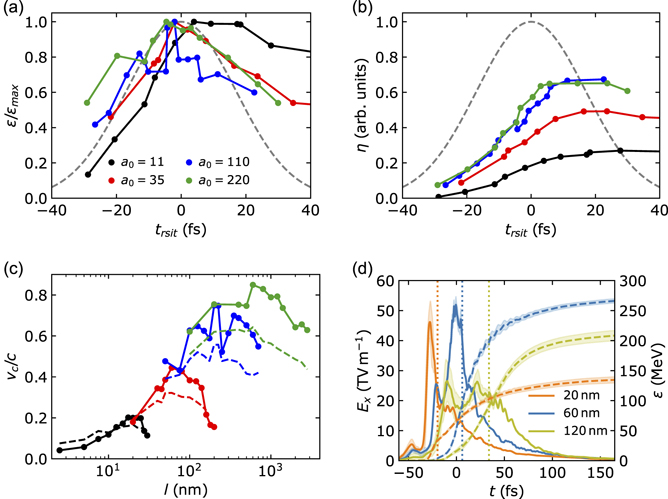
Figure 5. (a) Maximum proton energies obtained from each fixed laser intensity scan of target thickness normalised separately. (b) Conversion efficiency of laser energy to protons with energy  MeV, as a function of the onset time of RSIT, using the same normalisation factor as the results with linear polarisation. (c) Maximum relativistic critical surface velocity in the simulations (solid) and as calculated using the LS-RPA model up to the onset of RSIT (dashed), as a function of target thickness. (d) Mean longitudinal electric field (solid) near the tracked protons and their mean energy (dashed) in simulations for a0 = 35, and where trsit = −22 fs, −1 fs and 22 fs corresponding to l = 20 nm, 60 nm and 120 nm, respectively. The dotted vertical lines indicate the onset time of RSIT for each target, the standard deviation of the results is also shown (shaded).
Download figure:
Standard image High-resolution imageThe target velocity for the light sail mode of RPA is [26]  , where ζ = 2F/ρlc2, ρ is the target density and F is the fluence of the laser pulse. Figure 5(c) compares the critical surface velocities measured in the simulations with those calculated for LS-RPA, where the laser fluence is calculated up to trsit for each target. The LS-RPA model underestimates the maximum critical surface velocities achieved in the simulations, but there is good overall agreement in terms of the optimum target thickness for each a0 sampled. The model assumes perfect reflectivity, and is one-dimensional and therefore neglects the transverse expansion of the target and laser pulse. The velocity is usually highest immediately before RSIT, and the higher velocities observed in the simulations are caused by the rapid expansion of the plasma as the target becomes transparent.
The highest energy protons were tracked for a0 = 35 and l = 20 nm, 60 nm and 120 nm (in the same manner as for the linear polarisation cases) and the Ex
field and proton energies as a function of time are shown in figure 5(d). Unlike in figure 4 for linear polarisation, no increase in the Ex
field strength after the onset of RSIT is observed and it typically continues to decay with time. The protons in the thinner targets experience a very strong Ex
field ( TV m−1) immediately before transparency, which for the 60 nm target that becomes transparent close to the laser peak enables extremely rapid energy gain of the protons around the time of transparency to produce the highest final energies. Similar hybrid behaviour has been observed in simulations using a super-Gaussian spatial profile of the laser focus [65] showing an RPA component enhanced by the onset of relativistic induced transparency.
The electron densities and Ex fields along the x-axis and as a function time are shown in figure 6 for each of the simulations with tracking of the highest energy protons. In contrast to the interactions with linearly polarised light in figure 3, here the bulk target propagates forwards with the laser pulse due to LS-RPA. The most energetic protons initially experience predominantly RPA acceleration. As the critical surface is driven forward (along with the high energy protons), the RPA and TNSA fields become difficult to distinguish for the thinnest targets. The highest energy protons begin to drift away from the critical surface towards the target rear but still continue to experience the strong RPA–TNSA electric field. After the onset of transparency, the RPA component is curtailed, leaving the protons to be accelerated in the sheath field, which reduces as the plasma density rapidly falls. This sequential combination of RPA and TNSA marks this as a hybrid RPA–TNSA mechanism [58]. This is shown most clearly for the 60 nm and 120 nm targets in figures 6(b), (c), (e) and (f). The highest energy protons can be seen to move to the rear of the propagating target while it remains opaque. These protons propagate through stronger fields close to the relativistic critical density surface for the 60 nm target compared to the 120 nm target, and are therefore expected to experience greater LS-RPA within this hybrid process. Even when the protons have moved to the rear side of the target, RPA continues to play an important role in their acceleration by deforming the foil to cause j × B electron heating and by pushing the bulk target forwards to cause the rear surface sheath field to co-propagate with the accelerating ions. This effectively extends the acceleration time in the sheath field. The proton acceleration is optimised here for the 60 nm target, which becomes relativistically transparent near the laser peak, due to the optimisation of the strength and duration of the RPA–TNSA electric field generated.

Figure 6. (a)–(c) The electron density along the x-axis with the region containing the tracked highest energy protons (shaded, grey), the positions of the ion front at the target rear side (dashed, black) and the positions of the front side relativistic critical density surface (solid, black) for l = 20 nm, 60 nm and 120 nm, respectively. (d)–(f) The x-component of the electric field along the x-axis for the same respective target thicknesses.
Download figure:
Standard image High-resolution imagePure RPA (particularly LS-RPA) is predicted to produce monoenergetic features in the proton spectra [26]. In the optimal cases in this study, the proton spectrum does not show evidence of such features and the highest energy protons have a thermal-like profile.
3.3. 3D simulations of linear and circular polarisation
To test for any dimensionality effects, a limited number of 3D simulations were run for both linear and circular polarisation, and a0 = 50 and a0 = 35, respectively. To reduce the grid resolution and enable the 3D simulations to be conducted, the targets were pre-expanded such that the areal density remains fixed but the initial density is reduced to 70nc, and to enable direct comparison, 2D simulations with the same target density were also run. Figure 7 shows the onset time of transparency and the maximum proton energies for both polarisations. There is good agreement in the onset time of transparency between the 2D and 3D simulation results for linear and circular polarisation. In both cases, the absolute maximum proton energies are lower in the 3D simulations compared to 2D, as expected. Importantly, the variation with target thickness is very similar for the pre-expanded targets. The peak proton energies are observed for trsit ∼ 0 in both the 2D and 3D cases. This suggests that the underlying physics remains the same and that the increased degree of freedom in 3D results in a reduction of maximum proton energy.

Figure 7. (a) Onset time of relativistic transparency and (b) maximum proton energy, as a function of target thickness, for 2D (red) and 3D (green) simulations at reduced (70nc) initial densities, with linear polarisation (LP) and a0 = 50. The 2D simulations at 210nc are shown, as black points, for comparison. (c) and (d) Are the corresponding results for circular polarisation (CP) and a0 = 35.
Download figure:
Standard image High-resolution image3.4. Influence of the laser pulse rising edge
In addition to the polarisation and peak intensity of the laser light, and the thickness of the foil, the intensity profile of the rising edge of the laser pulse can influence the time in the interaction that the target becomes relativistically transparent and the properties of the proton beam [46, 55, 56, 66]. For ultrahigh intensity laser pulses, the laser rising edge can become sufficiently intense picoseconds before the arrival of the main pulse to drive significant pre-heating and pre-expansion of the foil. For increasing peak laser intensities and the same temporal-intensity contrast profile, the greater intensity in the rising edge will be capable of driving more rapid heating and target pre-expansion, and thus changes to the main interaction for a given target. The laser rising edge has already been observed to limit the energies of protons accelerated from contaminant layers [55] and lead to more efficient acceleration of other ion species [66].
Figures 8(a)–(f) shows simulation results comparing cases with and without a rising edge to the laser profile (as described in the methodology section). The proton maximum energy as a function of target thickness is shown in figures 8(a) and (d) at laser intensities corresponding to a0 = 16 and 160, respectively. The interaction with the rising edge results in an increase of the target thickness for which the proton energies are optimised, but does not considerably reduce the overall maximum achievable energies. Figures 8(b) and (e) show that the proton energies are optimised for trsit ≈ 0 regardless of whether or not there is a rising edge present. The maximum proton energy is thus inherently linked to the onset time of transparency, and provided a target thickness can be chosen such that this occurs near the peak of the laser pulse interaction, similar proton energies are achievable for the conditions considered here.

Figure 8. Simulation results with and without inclusion of the laser rising edge (RE). a0 = 16 for (a)–(c) and a0 = 160 for (d)–(f). (a) and (d) Maximum proton energy, ɛ, as a function of target thickness, l. (b) and (e) Maximum proton energies as a function of the onset time of relativistic transparency, trsit. A sample of the highest energy protons is tracked in simulations at a0 = 16 for l = 40 nm without the rising edge and l = 75 nm with the rising edge, and similarly at a0 = 160 for l = 600 nm without the rising edge and l = 1 μm with the rising edge. (c) and (f) Mean energy of the tracked protons (dashed) and the mean electric field along the x-axis, Ex , near the tracked protons (solid), the standard deviation of these results is also shown (shaded).
Download figure:
Standard image High-resolution imageThe highest energy protons with low divergence were tracked along the x-axis, in the same manner as in the previous sections, in further simulations for target thicknesses close to the optimum, with and without the laser rising edge, at both a0 = 16 and 160. The proton energy and local Ex field is shown in figure 8(c) for a0 = 16 and l = 40 nm with no rising edge and l = 75 nm with the rising edge, the protons are accelerated in a similar temporal electric field profile with a near identical ∼13 TV m−1 second peak due to the onset of RSIT. Figure 8(f) shows corresponding results for a0 = 160 and l = 600 nm with no rising edge and l = 1 μm with a rising edge, both of these cases show a peak in the Ex field immediately before RSIT and shortly afterwards.
The electron densities for a0 = 16 and the cases without and with the rising edge are plotted in figures 9(a) and (b), respectively. Without the rising edge the most energetic protons all start at the rear target surface where they experience only TNSA before the onset of transparency. Whereas, in the clearly pre-expanded target with the rising edge the very highest energy protons of those tracked are first accelerated by the RPA-driven electric field shown in figure 9(c) at the target front surface, where the reduced density enables the laser light to more easily drive compression, which is consistent with experimental evidence of faster hole boring with reduced laser contrast [67]. The laser rising edge therefore causes RPA to become more important at this intensity, although most of the proton energy is still gained in the RSIT-enhanced sheath field at the target rear. For a0 = 160, the radiation pressure can easily compress the solid density target and it becomes more important in the proton acceleration. The highest energy protons are observed to propagate close behind the relativistic critical density surface as shown in figures 9(d) and (e) of the electron density without and with the rising edge. The protons experience hybrid acceleration by the RPA and TNSA fields until the onset of transparency when the RSIT-enhanced sheath field takes over, as shown by the evolution of the Ex field in figure 9(f) for the l = 1 μm target with the rising edge. The acceleration mechanism of this group of the highest energy protons does not substantially change with the addition of the rising edge at this laser intensity.
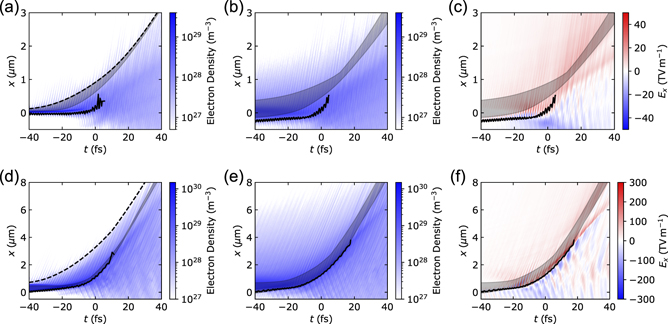
Figure 9. Electron density and electric field with and without inclusion of the laser rising edge (RE). a0 = 16 for (a)–(c) and a0 = 160 for (d)–(f). The electron density along the x-axis, the region containing the tracked highest energy protons (grey, shaded), the position of the ion front (black, dashed) and the position of the relativistic critical density surface (black, solid) for the (a) l = 40 nm without RE, (b) l = 75 nm with RE, (d) l = 600 nm without RE and (e) l = 1 μm without RE cases presented in figure 8. (c) and (f) The longitudinal electric field along the x-axis for l = 75 nm and l = 1 μm, respectively, both with RE.
Download figure:
Standard image High-resolution image3.5. Radiation reaction
At laser intensities of  W cm−2, strong-field radiation reaction can occur for relativistic electrons in the laser field and is capable of converting a substantial portion of the laser energy to high energy photons [68, 69]. Modelling has shown that it can potentially enhance ion acceleration from relativistically transparent targets and degrade both the hole boring and light sail modes of RPA [68, 70, 71]. To test if it has a significant effect on the optimisation of proton acceleration with the onset of relativistic transparency, we perform further simulations with radiation reaction enabled in the EPOCH code as described in Ridgers et al [72], for linear polarisation and a0 = 310. These conditions correspond to the highest laser intensity considered here and strongest electron heating, for which the effects of radiation reaction are expected to be greatest.
Figure 10(a) shows that inclusion of radiation reaction delays the onset time of relativistic transparency for almost every target thickness simulated, with the delay appearing to increase with thickness. The example electron spectra shown in figure 10(b) for the 1.8 μm target, sampled at t = 17 fs in the simulation, demonstrates that radiation reaction reduces the number of the most energetic electrons, cooling the fast electron population and consequently reducing the rate of electron expansion and the relativistic mass increase that is important for the onset of RSIT. The maximum proton energies achieved with and without radiation reaction are shown in figure 10(c) as a function of the onset time of RSIT. There is a 10% reduction in the overall maximum proton energies achieved, 2.2 GeV to 2.0 GeV, with the inclusion of radiation reaction. The proton energies are still, however, highest when transparency occurs near the peak of the laser pulse interaction, where the optimum thickness has reduced from 1.4 μm to 1 μm. The loss of energy through radiation reaction is shown in figure 10(d) to reduce the maximum laser-to-proton energy conversion efficiency achieved by 15%, but the overall trend remains the same. A more detailed examination of the influence of radiation reaction is beyond the scope of this work.

Figure 10. (a) The onset time of relativistic transparency as a function of the target thickness with and without numerically modelling radiation reaction (RR) for a0 = 310. (b) The electron spectrum for an example target where l = 1.8 μm. (c) The maximum proton energies achieved in each simulation as a function of the onset time of relativistic transparency. (d) The laser-to-proton energy conversion efficiency in each simulation as a function of the onset time of relativistic transparency.
Download figure:
Standard image High-resolution image3.6. Scaling with laser intensity
Figure 11(a) shows the scaling of the maximum proton energy (for the optimum target thickness) with a0 for linear and circular polarisation, in 2D and 3D simulations. The results shown in figure 10 with radiation reaction enabled are used for linear polarisation at a0 = 310 in figure 11(a). Radiation reaction is not included for the circular polarisation simulations—the inherent reduction in electron heating for this polarisation is expected to result in a reduced affect on the proton beam compared to linear polarisation. The simulations in 3D were performed (at the optimum thicknesses determined from the corresponding 2D simulations), at a0 = 16 (l = 40 nm) and a0 = 160 (l = 600 nm) for linear polarisation, and at a0 = 11 (l = 15 nm) and a0 = 110 (l = 225 nm) for circular polarisation. For a given set of 2D or 3D simulations, the same laser intensities were considered for the two polarisation cases, resulting in the horizontal offset in a0.
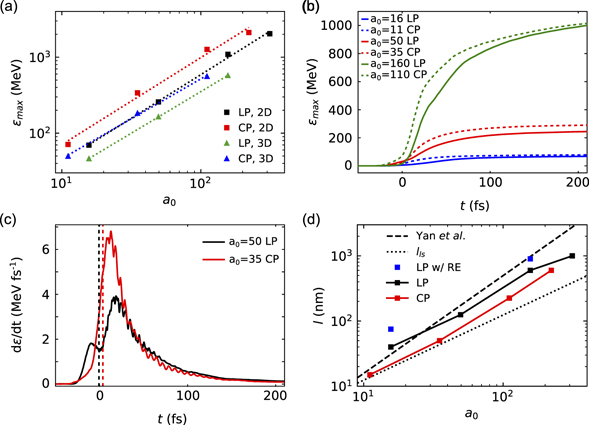
Figure 11. (a) Maximum proton energy (from target thickness scans at a given intensity), ɛmax, as a function of a0, for linear and circular polarisation (LP and CP, respectively) in 2D and 3D simulations. (b) Maximum energy of the most energetic proton for linear (solid) and circular (dashed) polarisation, for three pairs of comparable laser intensities. (c) Change in energy of the most energetic proton as a function of time, for linear polarisation at a0 = 50 and circular polarisation at a0 = 35 (same intensity). Dashed vertical lines indicate the onset time of transparency in each case. (d) Optimum target thickness for maximising proton energy as a function of a0 for the two laser polarisations and the simulations with linear polarisation where the laser rising edge was included (RE), all conducted in 2D. Predictions using the model of Yan et al [73] for transparency occurring at the peak intensity of the laser pulse are included (dashed), and the analytically predicted optimum target thickness for LS-RPA (dotted) [26].
Download figure:
Standard image High-resolution image
The maximum proton energy scaling with intensity is similar for linear and circular polarisation. In all four data scans (both polarisations in 2D and 3D), the power law scaling exponent  is found to be in the range b = 0.53–0.57. The total laser energy absorption is found to be comparable (within 5%) in the optimum cases for both polarisations, potentially a result of the RSIT onset times being similar.
Figure 11(b) shows the energy of the most energetic proton as a function of time for each of three linearly and circularly polarised simulation pairs at comparable intensity (with optimised target thickness). In all cases, most of the energy gain is observed to occur after the onset of transparency (trsit ∼ 0) and follows a similar profile. This indicates that the scaling of the maximum proton energy is primarily due to the energy gained after transparency, which is similar regardless of the laser polarisation and the mechanisms responsible for the initial acceleration of the protons. The rate of energy change for the most energetic proton is shown in figure 11(c) for an example pair of linear and circular polarisation simulations at comparable intensity (for the optimal target thickness at which proton energy is maximised). This was determined by differentiating the maximum energy data shown in figure 11(b), and to avoid high frequency oscillations, the data was first temporally averaged over a 5 fs window at each point in time. These plots show that the differing acceleration prior to transparency induces a different energy gain profile for the two polarisation cases, but that after transparency the energy gain follows a similar trend as the protons are accelerated by the enhanced electric field (which decays over an extended period) at the target rear side. As such, while the initial acceleration mechanisms may differ, the overall energy gain concurrent with the onset of transparency results in similar ion energies for comparable intensities for linear and circular polarisation.
The optimum target thickness is plotted as a function of a0 in figure 11(d). It was shown earlier that the highest proton energy results from RSIT occurring close to the peak of the laser pulse. The optimum thickness is shown to be smaller for the case of circularly polarised light where the electron heating is reduced, decreasing the rate of plasma expansion. The predicted target thickness scaling for transparency occurring at the peak of the laser pulse using the plasma expansion model reported by Yan et al [73] is also shown. This model produces similar values to the simulations with linear polarisation at the lowest intensities considered, however scales much faster  than the simulation results for linear polarisation and diverges with increasing laser intensity. Although we have shown that the protons are not purely accelerated by LS-RPA for circular polarisation, the optimum thickness for this polarisation agrees well with the analytically predicted optimum thickness for LS-RPA of lls = a0
nc
λL/ne
π [26] for a0 = 11 and a0 = 35. With increasing intensity, transverse plasma expansion becomes increasingly important and the simulation results depart further from the predictions of this 1D model.
than the simulation results for linear polarisation and diverges with increasing laser intensity. Although we have shown that the protons are not purely accelerated by LS-RPA for circular polarisation, the optimum thickness for this polarisation agrees well with the analytically predicted optimum thickness for LS-RPA of lls = a0
nc
λL/ne
π [26] for a0 = 11 and a0 = 35. With increasing intensity, transverse plasma expansion becomes increasingly important and the simulation results depart further from the predictions of this 1D model.
We have shown that the laser rising edge can increase the optimum target thickness and hasten the onset of RSIT without considerably reducing the maximum proton energies achievable. The laser temporal-intensity contrast profile is one of the most important factors influencing ion acceleration. Prediction of the optimum target thickness for a given material and set of laser parameters may only be possible with characterisation of the unique temporal-intensity contrast profile of the high intensity pulses produced by a given laser system and numerical modelling of each stage of the interaction. Nevertheless, our modelling shows that even with a degree of reduced contrast, optimum acceleration is achieved when transparency occurs near interaction with the peak of the laser pulse.
4. Summary
In summary, we have demonstrated, via a comprehensive series of PIC simulations, that the maximum energy to which protons are accelerated in thin foils undergoing relativistic transparency is achieved when transparency occurs at the peak of the laser temporal-intensity profile. Importantly, this remains valid over a wide intensity range, from 5 × 10²⁰–2 × 10²³ W cm−2, for both linear and circular polarisation, and when including the rising edge contrast of the laser pulse. The highest proton energies are achieved for circular polarisation when the hybrid RPA–TNSA acceleration is optimised, which typically corresponds to where the relativistic critical density surface velocity is maximised. For linear polarisation, the role of RPA in the hybrid acceleration process is found to increase with increasing laser intensity and target pre-expansion by the laser rising edge for a0 = 16. The mechanism for proton acceleration is, however, generally dominated by the rear surface sheath field, which is shown to be enhanced by the onset of relativistic transparency as the laser pulse drives the rapid expansion of electrons and high flux of electron energy at the target rear side. At the highest laser intensity considered, a0 = 310, radiation reaction is shown to delay the onset of relativistic transparency and reduce the maximum proton energy (by 10%) and laser-to-proton energy conversion efficiency (by 15%) as it radiates energy out of the fast electron population. Even in this scenario, the overall dependency of the proton energy on trsit remains unchanged. This demonstrates that relativistic transparency onset time is a key parameter in laser-driven ion acceleration with thin foils, and the need to consider this in the design and interpretation of experiments to investigate the physics of these interactions using multi-petawatt laser facilities.
Acknowledgments
This work is financially supported by EPSRC (Grant Nos. EP/R006202/1 and EP/V049232/1) and STFC (Grant No. ST/V001612/1). It used the ARCHIE-WeSt and ARCHER2 high performance computers, with access to the latter provided via the Plasma Physics HEC Consortia (EP/R029148/1), and the University of Cambridge Research Computing Service (funded by Grant No. EP/P020259/1). EPOCH was developed under EPSRC Grant EP/G054940/1. The research has also received funding from Laserlab-Europe (Grant Agreement No. 871124, European Union's Horizon 2020 Research and Innovation Programme).
Data availability statement
The data that support the findings of this study will be openly available following an embargo at the following URL/DOI: 10.15129/26391870-5831-4502-9997-8e1a0d932fd3. Data will be available from 08 April 2022.