


Abstract
The interpretation of experimental data from novel mid-infrared few-cycle laser sources requires an understanding of ionization mechanisms and knowledge about related ion yields. Experimental studies have indicated sequential double ionization as the dominant process above 1014 W cm−2. These results contradict a recent prediction that in this spectral region, non-sequential processes dominate the double ionization of xenon up to intensities of about 1015 W cm−2. In either case, the ratio of doubly to singly charged xenon yield reported in previous studies has been limited to a few percent, indicating a regime well below the onset of saturation of the double ionization process. We present an experimental study of double ionization of xenon and krypton atoms exposed to intense near four-cycle pulses at 3.2 μm. Our experiments rely on the ion microscopy technique, which facilitates the detection of ions originating from a restricted region within the interaction volume, thereby reducing the impact of focal averaging. Our measurements suggest that at intensities of close to 1.2 × 10¹⁴ W cm−2, double ionization of xenon and krypton is already significantly saturated. In particular, we find a doubly to singly charged yield ratio of about 75 percent for xenon and 25 percent for krypton. We compare our results with the predictions of different models accounting for the effects of volume averaging and focal geometry. We find that in the deeply saturated regime of our experiment, the Perelomov–Popov–Terentyev theory significantly underestimates the observed double ionization yield.
Export citation and abstract BibTeX RIS

Original content from this work may be used under the terms of the Creative Commons Attribution 4.0 licence. Any further distribution of this work must maintain attribution to the author(s) and the title of the work, journal citation and DOI.
1. Introduction
Strong-field double ionization studies of rare gas atoms have led to important insights into strongly driven multi-electron dynamics. Notably, the measurement of intensity dependent ion yields permits to distinguish between two double ionization mechanisms: sequential double ionization (SDI) and non-sequential double ionization (NSDI). In SDI, a first ionization step generates a singly charged ion in its ground state, which is subsequently ionized by the laser field. In NSDI, the first ionized electron is driven by the linearly polarized laser field and recollides inelastically with the parent ion, releasing a second electron via electron-impact ionization. While SDI is dominant at intensities above the saturation threshold, NSDI is usually observed below the threshold, giving rise to a characteristic knee structure in the intensity dependent yield curves. More detailed information about the exact mechanism was obtained from measurements of the ion momentum distribution that exhibits a double hump in the presence of NSDI, and the correlation within the two-electron momentum distribution [1–4]. An important parameter is the electron's ponderomotive energy Up = e2 E2/4me ω2 in a laser field with field strength E and central angular frequency ω (e and me are the electron charge and mass, respectively). Since Up scales with the square of the wavelength, dramatic differences can be expected for NSDI in mid-infrared (mid-IR) laser fields as compared to visible laser fields.
Several recent studies [5–8] have addressed multiple ionization of xenon in intense mid-IR laser fields with wavelengths between 3 μm and 4 μm and intensities up to about 1014 W cm−2. Under such conditions, electron wave packets, which do not undergo recollision reach energies up to 400 eV, while recolliding electrons have enough energy to induce inner-shell excitations [9].
The NSDI process, however, does not simply become more likely at higher ponderomotive energies. The scaling is more complicated since the rescattering probability decreases due to the combined effect of wave-packet spreading and the longer distance travelled in the continuum.
Li et al used a three-dimensional Monte Carlo classical ensemble method to calculate the intensity-dependent NSDI probability in the mid-IR, and found a nearly constant double ionization probability of 10−2 over a wide range of intensity from 2 × 10¹³ W cm−2 to 1 × 10¹⁵ W cm−2 [5]. From electron momentum correlations and yields they determine NSDI as the dominant process for these parameters.
Experimentally, DiChiara et al found strong evidence for inelastic scattering events or direct non-sequential (e, ne) processes at wavelengths of 3.2 μm and 3.6 μm and intensities up to 1.2 × 10¹⁴ W cm−2 [6]. In particular, the SDI yield calculated using the Ammosov–Delone–Krainov theory was found to underestimate the experimental results by more than one order of magnitude, which was explained by the dominance of non-sequential processes. At a wavelength of 3.1 μm, in contrast, Pullen et al identified the transition from NSDI to SDI at intensities between 5 × 10¹³ W cm−2 and 1 × 10¹⁴ W cm−2 [7]. The authors attributed the discrepancies with the earlier results of DiChiara et al to uncertainties in the intensity calibration.
While intensity resolved yield ratios may provide important information about the ionization process, accessing this quantity experimentally becomes challenging when approaching the saturation intensity. The reason is focal volume averaging, i.e. the averaging of the measured yield over the intensity distribution in the focal volume, which is hardly avoidable in most experiments. The complex problem of quantification of non-linear laser ionization has been discussed in reference [10]. Known remediation measures are 3D time-of-flight (TOF) spatially confined ion detection [11, 12], 2D-TOF spatially confined ion detection, [11] and time-gated ion microscopy [13]. In case of multiple ionization processes and without the above experimental artifices it is only possible to estimate the saturation intensities of the different ionization processes leading to the different charge states. It is not possible, however, to directly read their ratios from the measured yield curves (see e.g. [14]). Recently, Wang et al [15] studied the wavelength scaling of atomic NSDI in a range between 800 nm and 2200 nm. At 800 nm, they measured a Xe2+/Xe1+ yield ratio of 3.8% at an intensity of 1.4 × 10¹⁴ W cm−2 (tp = 35 fs), and observed a monotonic decrease to 1.4% at a wavelength of 2200 nm. In contrast, for the same intensity and at 800 nm (tp = 42 fs), Strohaber et al found that the Xe1+ and Xe2+ yields are nearly equal, when minimizing volume averaging [14], indicating that the process is dominated by SDI.
Here, we present a measurement of single and double ionization yields of xenon and krypton, at an intensity of 1.2 × 10¹⁴ W cm−2 and a wavelength of 3.2 μm, i.e. for laser parameters similar to those used in the theoretical prediction by Li et al [5]. The measurements were performed using an ion microscope (IM), which enabled us to suppress focal averaging to some extent, since this instrument facilitates the detection of ions originating from a restricted region within the interaction volume. For the conditions of our experiment, we find that the double and single ionization yields are of the same order of magnitude for both xenon and krypton. Since our measurements still involve some degree of spatial averaging, this provides us with a lower bound for the intensity-resolved yield ratio of double and single ionization of xenon and krypton in the mid-IR. We compare the experimental results with the predictions of different models and discuss the effects of volume averaging and focal geometry.
2. Experimental setup
The measurements were performed at the Extreme Light Infrastructure—Attosecond Light Pulse Source (ELI-ALPS) [16, 17] with a 100 kHz mid-infrared laser [18] source that delivered close to four-cycle linearly polarized pulses at a central wavelength of 3.2 μm with an on-target duration of tp = 45 fs [full width half maximum (FWHM) of the intensity envelope] and a pulse energy of 100 μJ. The pulse duration was retrieved by frequency-resolved optical gating (FROG) in front of the IM. In order to account for the dispersion induced by the entrance window of the IM, we inserted an identical window into the beam path for the FROG measurement.
The experimental setup is shown in figure 1(b). The laser pulses were sent into the IM chamber, which was filled with 10−6–10−5 mbar of xenon or krypton (the residual gas pressure was on the order of 10−7 mbar). At these pressures, electron scattering with neighbouring atoms can be excluded [19]. The laser beam with a FWHM of rp = 4 mm was focused into the object plane of the IM using a spherical gold mirror with focal length f = 5 cm. Due to geometric constraints, the incidence angle of the beam on the focussing mirror was α = 7.5°.
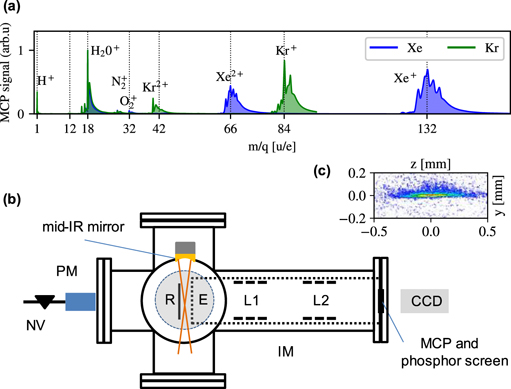
Figure 1. (a) TOF spectra recorded with 3 × 10⁻⁶ mbar of xenon (blue) or 2 × 10⁻⁶ mbar of krypton (green) in the chamber. (b) Schematic top view of the experimental chamber and imaging system. The pressure is controlled with a needle valve (NV) and pressure gauge (PM). The ions generated in the focus of the mid-IR beam between a repeller (R) and an extractor (E) electrode are accelerated towards a position sensitive imaging detector through a pair of electrostatic lenses (L1 and L2). (c) IM image recorded by the Charge-Coupled Device (CCD) camera of the Xe3+ distribution within the plane between and parallel to the repeller and extractor electrodes. The laser propagates in the z-direction.
Download figure:
Standard image High-resolution imageA detailed description of the IM can be found in [13, 20]. Briefly, ions are generated via multiphoton ionization of the target gas between repeller (R) and extractor (E) electrodes. They are then accelerated through two electrostatic lenses (L1, L2) towards a position sensitive detector where a magnified projection of the spatial ion distribution in the focus is formed. The detector consists of an Micro-Channel Plate (MCP), a phosphor screen and a CCD camera assembly. Gating the MCP with a temporal window of 100 ns allows us to selectively image the distribution of different ionic charge states, as illustrated in figure 1(c) for the Xe3+ charge state. Due to limitations of the high-voltage switch, the data acquisition rate in the imaging mode was reduced to 1 kHz.
TOF spectra of the generated ions can be obtained either by delaying the temporal gate with respect to the instant of ionization and recording an IM image for each delay value (referred to as imaging TOF), or by capacitively decoupling the MCP signal, which is read out on an oscilloscope at the full repetition rate. We will refer to the capacitively decoupled TOF as single-shot TOF; corresponding spectra are displayed in figure 1(a) for xenon and krypton in blue and green, respectively. The TOF spectra obtained in both ways are consistent with each other, as presented for all relevant xenon and krypton charge states in figure A of the supplementary material (https://stacks.iop.org/NJP/23/053026/mmedia). We assume that the detection sensitivity of the IM is the same for all ions.
The electrode potentials of the IM were tuned to obtain a sharp image in the image plane. Then, the spatial calibration of the IM was performed by shifting the focus position by a known distance within the object plane and recording Xe3+ images for each position. In addition, this procedure allowed the identification of the region in the IM's field of view with the best imaging quality, namely a window between −140 μm and 460 μm along the propagation axis relative to the peak position of Xe3+ (see figure B in the supplementary material).
3. Experimental results
The spatially resolved yield distributions of the charge states Xeq+, with q = 1, 2, 3, are shown in figures 2(a)–(c). The images were acquired over 1000 shots at a pressure pXe = 3 × 10⁻⁶ mbar, selecting the ions within a 200 ns TOF interval. The images were then rotated by 15 degrees for visual convenience. The deviations of the images from an ideal Gaussian focus are due to the astigmatism of the beam as well as aberrations of the IM. The latter originates from the increased distance between repeller and extractor electrodes and the low magnification. In figure 2(d), we present the total ionization yields of the different charge states along the propagation axis, obtained by integrating the signal in figures 2(a)–(c) along the vertical direction.
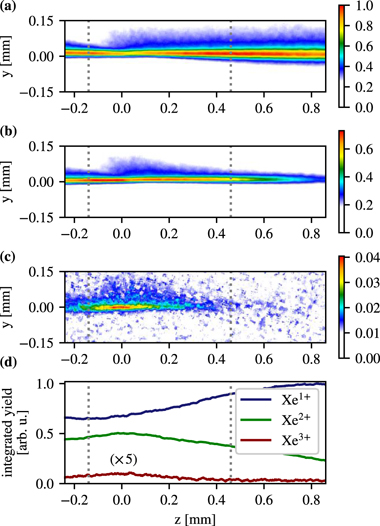
Figure 2. Spatially resolved ionization yields of the xenon charge states Xe1+ (a), Xe2+ (b) and Xe3+ (c) in the focus of the mid-IR laser beam. The two dashed lines enclose the region with best imaging quality. The curves in (d) correspond to the integral of the signal in the images (a)–(c) along the vertical axis. For visual convenience, the Xe3+ yield was multiplied by a factor of 5.
Download figure:
Standard image High-resolution imageIn the region between the two dotted lines, the ratio of doubly to singly charged xenon is significantly larger than 50%, and it reaches a maximum value of (72 ± 3)%, while the ratio of triply to singly charged xenon rises up to about (2.6 ± 0.3)% in the center of the focus. Both of these ratios are significantly larger than the ones reported in [6, 7]. In these studies, the yield was integrated over the entire focal volume. As a consequence, the yield ratios reported there are dominated by geometric expansion of the interaction volume and hardly reflect the true intensity dependence. A further interpretation of the differences requires an accurate understanding of the focal geometry used in our measurements, which is discussed in the following section.
The corresponding results for the krypton charge states Kr1+ and Kr2+ are shown in figures 3(a)–(c). Each image was acquired at a pressure of pKr = 2 × 10⁻⁶ mbar and the signal was accumulated over 500 shots. The ions were selected by their TOF within a gating window of 100 ns. The maximal ion yield ratio for Kr2+ and Kr+ amounts to about (25 ± 2)%. In addition, we find that—after properly accounting for the differences in pressure and exposure time—the yields of Kr+ and Xe+ are indeed comparable. The ratio between Kr+ and Xe+ amounts to (82 ± 8)%. Importantly, the yield ratios extracted from the imaging TOF, and the single-shot TOF are consistent. We infer the error bars for our measurement from the deviations between the two different experimental configurations.
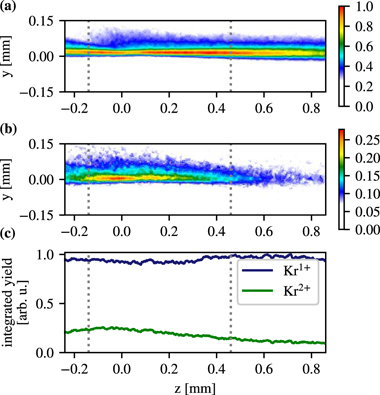
Figure 3. Ionization yields of the charge states Kr1+ (a) and Kr2+ (b), spatially resolved in the focus of the mid-IR laser beam. The two dashed lines indicate the region with best imaging quality. The curves in (c) display the integral of the signal in the images (a) and (b) along the vertical axis.
Download figure:
Standard image High-resolution image4. Simulation results
In order to discuss the measured yield ratios, we model the experimental data using different theoretical approaches. We use the Perolomov–Popov–Terentyev theory (PPT) and the heuristic model (HM) by Uiterwaal et al [21] to predict sequential ionization. The temporal intensity profile of the mid-IR pulse is assumed to be Gaussian.
For the PPT calculation, the intensity-dependent Xe1+ and Xe2+ yields are obtained by solving the following system of rate equation (1):

Here, wPPT,q
is the PPT ionization rate into the qth charge state as provided in [22] and  denotes the fraction of ions in this state.
The HM describes the production of a given charge state resulting from the absorption of at least Nmin photons after the interaction with the laser pulse. The model is based on three main assumptions. (i) The n-photon absorption cross-section is constant in a short time interval  derived from the time-energy uncertainty relation. (ii) For an atom or ion A, the n-photon absorption cross-section equals the single-photon ionization cross-section σA for a photon with energy Nmin
ℏω. (iii) The probability to absorb n photons within a time interval ΔT is described by the Poisson distribution.
derived from the time-energy uncertainty relation. (ii) For an atom or ion A, the n-photon absorption cross-section equals the single-photon ionization cross-section σA for a photon with energy Nmin
ℏω. (iii) The probability to absorb n photons within a time interval ΔT is described by the Poisson distribution.
To parametrize this distribution, we introduce in equation (2) the target specific mean number of absorbed photons, MA, given by

reflecting the mean number of photons impinging onto the absorption cross-section σA within the time ΔT at an instantaneous peak intensity of I0. We use σXe = 65 Mb for xenon and σKr = 45 Mb for krypton [23].
For the laser wavelength of 3.2 μm (i.e. a photon energy of 0.39 eV) used in our experiment, a minimum number of Nmin = 32 photons is needed to ionize xenon and a minimum number of Nmin = 55 photons is needed to generate Xe2+ from the Xe1+ ground state.
When ℏωMA = Ip, the ionization probability is roughly 50%. The case MA ⩾ Nmin corresponds to above threshold ionization, while the case MA < Nmin, which is statistically still possible, can be interpreted as tunneling ionization. For MA ≪ Nmin, the lowest order perturbation theory of Multi-Photon Ionization (MPI) is retrieved, where the ionization probability is proportional to the Nminth power of the intensity  . The above reasoning and the assumptions made follow the discussion given in [21]. The simple HM can reproduce the features of photo-ionization processes involving several different ions, including NSDI as shown explicitly for argon. This motivates the following ansatz for the probability PA,q
of generating a charge state q of an atom A via absorption of more than mA,q
but less than mA,q+1 photons, given in equations (3) and (4):
. The above reasoning and the assumptions made follow the discussion given in [21]. The simple HM can reproduce the features of photo-ionization processes involving several different ions, including NSDI as shown explicitly for argon. This motivates the following ansatz for the probability PA,q
of generating a charge state q of an atom A via absorption of more than mA,q
but less than mA,q+1 photons, given in equations (3) and (4):

and similarly for the highest reached charge state qmax

The exponent  (where T is the laser period) results from integrating the rate over the duration tp of the pulse. The model outlined here is a simplified version of the one in [21] because intermediate ionization levels are disregarded. It can be shown, yet, that these simplifications have only a minor effect on the calculated probabilities. We wish to emphasize that leaving the interpretation of the parameters mA,q
and MA open, and considering them as mere fitting parameters, the above formula for PA,q
can be used to fit any sequential ionization process.
(where T is the laser period) results from integrating the rate over the duration tp of the pulse. The model outlined here is a simplified version of the one in [21] because intermediate ionization levels are disregarded. It can be shown, yet, that these simplifications have only a minor effect on the calculated probabilities. We wish to emphasize that leaving the interpretation of the parameters mA,q
and MA open, and considering them as mere fitting parameters, the above formula for PA,q
can be used to fit any sequential ionization process.
For the comparison of the experimental and theoretical results, it is important to account for the intensity distribution in the considered interaction region. Imaging the focus with an MIR camera gave a FWHM of approximately 30 μm. However, the 7.5° incidence angle on the mirror gave rise to a strongly aberrated and rather complicated intensity distribution. In order to provide a more accurate description, we have performed numerical simulations to model the intensity distribution in the focus. We calculate the field distribution by evaluating the propagation-diffraction integral based on Huygens's principle (see supplementary material).
The calculated local (x, y) maximum intensities along the z-axis are shown in figure 4, revealing that the focal geometry in the experiment is non-Gaussian. The focus splits into a sagittal and a tangential part and, thus, considerably elongates the focal volume. We find an upper bound for the peak intensity of 1.4 × 10¹⁴ W cm−2 that is significantly lower than the 5.7 × 10¹⁴ W cm−2 expected for parallel incidence and ideal focussing. In addition, we realize that the local peak intensity is almost constant over a distance of 700 μm (see the range delimited by the two dotted lines in figure 4). For comparison, a Gaussian focus with the same pulse energy exhibits a much larger variation of the local peak intensity along z. These results are consistent with the small variation in the yield of singly and doubly charged ions measured along z, and also explain why TOF and IM data are comparable for the conditions of our experiment. Thus, the special geometry facilitates the observation of a narrow slice of the focus.
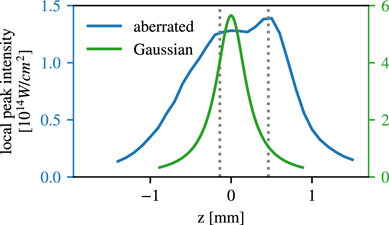
Figure 4. Maximum intensity as a function of the z-coordinate for a Gaussian (green) and an aberrated (blue) focus. The Gaussian beam waist of 18 μm is calculated from the initial beam width and the focal length of the mirror. The pulse energy is set to be equal for the Gaussian and aberrated beam. The two grey dotted lines indicate the field of view. Within this region, the local peak intensity is significantly steeper for a Gaussian beam.
Download figure:
Standard image High-resolution imageIn order to compare the model predictions with our experimental results, the calculated intensity-dependent ionization yields are convoluted with the simulated intensity distributions, allowing us to account for all optical aberrations. In figure 5, we illustrated the effect of the aberrations and the different types of volume averaging on the yields using the predictions of the HM for Xe. Specifically, we compare the local intensity dependent yields to the radially averaged yields at a fixed z coordinate referred to as 2D averaging, and volume averaging over all three dimensions denoted as 3D averaging.

Figure 5. Ionization yields for Xe1+ and Xe2+ calculated with the heuristic formula for different cases of volume averaging: shown are the local ionization probabilities (a) as a function of intensity. Then, simulating both a Gaussian beam with an FWHM of 18 μm and the aberrated beam of our experiment, yields integrated over the focal plane perpendicular to the propagation direction (b) and over the full volume (c) are presented as a function of the peak intensity within the domain of integration. The respective yield ratios—employing the same 2D or 3D averaging are shown in (d). The dashed grey line marks the intensity at which Xe1+ and Xe2+ are produced in equal amounts locally. For comparison, this intensity is also marked in the remaining plots.
Download figure:
Standard image High-resolution imageOwing to the depletion of the singly-charged-ion population, the local double ionization yield (figure 5(a)) exceeds the single ionization already below 1 × 10¹⁴ W cm−2. In contrast, the volume-averaged yields (figures 5(b) and (c)) strongly differ from the true intensity dependent yields in the saturation regime. In particular, for all the intensities considered, less doubly than singly charged xenon is produced when averaging over the focal volume. The effect of volume averaging on the yield ratios is shown in figure 5(d). The pronounced differences between local and volume averaged yield ratios indicates that great care has to be taken, when discussing these quantities. In the context of SDI, the volume averaged yield ratios only represents a lower limit of the corresponding local quantities. In addition, we note that aberrations lead to a variation within a factor of 2 in measured yields for 2D and 3D averaging as compared to the yields of a Gaussian focus.
It is instructive to investigate the implications of saturation and depletion in the special case of Gaussian 2D focal volume averaging. It can be shown analytically that for an ionization rate scaling with a power of the intensity, the radially integrated ionization yield of any charge state approaches an asymptotic value at high intensity, which can be expressed with the respective saturation intensities. In particular, the radially integrated yield ratio between doubly and singly charged ions Y2/Y1 can be computed from the saturation intensities Isat1, Isat2 and Isat3 of the production of the singly, doubly and triply charged ions as in equation (5):

Asymptotically constant yield ratios are also observed for both the HM and the PPT theory when evaluating the yields numerically (see figure 5(d) and the supplementary material). As a result, beyond the saturation intensity of both involved ion species, the ratio of the radially integrated ionization yields remains effectively constant. In this intensity regime, the measurement of the yield ratio is very reliable since it is nearly independent of the exact intensity. As shown in figure 6 for the HM, at increasing peak intensities, the ionization yield for a given value of z originates from rings with increasing radius and decreasing width. This explains the above finding geometrically.
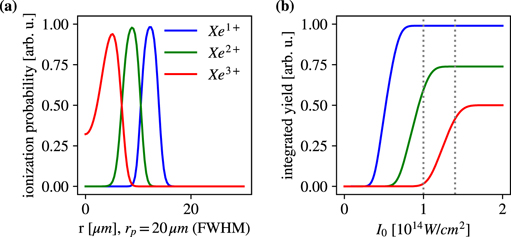
Figure 6. (a) Illustration of the local yield as a function of the radial coordinate for the three lowest charge states of xenon. The calculations were performed using the HM for a peak intensity of 1.5 × 10¹⁴ W cm−2. (b) Radially integrated yields from (a) as a function of the peak intensity. The yields reach an asymptotic value when increasing the peak intensity I0 beyond the saturation intensity. The intensity uncertainty in this experiment is indicated by the two grey dotted lines.
Download figure:
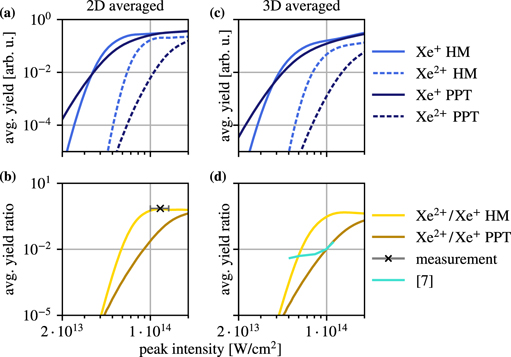
Standard image High-resolution imageA comparison of the theories used to predict the yield ratios is presented in figure 7. While the HM correctly predicts the measured Xe2+/Xe1+ ratio at 68%, the PPT theory predicts a significantly lower value of 7.6%. According to the PPT theory, the local single and double ionization probabilities would become comparable at an intensity of 1.2 × 10¹⁴ W cm−2. In the high intensity limit, the double to single ionization yield ratio predicted by both, the PPT theory and the HM, approach the same asymptotic value of 70% in case of 2D volume averaging (see figure 7). The fact that the Xe1+ and Xe2+ yields measured in our experiment are comparable at z = 0 indicates that sequential ionization clearly dominates at an estimated peak intensity of (1.2 ± 0.2) × 1014 W cm−2. Moreover, we find that despite the difference in their ionization potentials, singly charged xenon and krypton ions are produced in nearly equal amounts. This provides further evidence for saturation of single ionization. In particular, our observations are not compatible with the prediction of the classical ensemble model of reference [5], namely that the local double ionization probability stagnates around 1% up to intensities around 1015 W cm−2. This result would only be compatible with our observation, if the single ionization probability of xenon was also on the order of 1% up to an intensity of 1.2 × 10¹⁴ W cm−2. This, however, is in contradiction with a saturation intensity for single ionization significantly below 1.2 × 10¹⁴ W cm−2.
Figure 7. Ionization yield for Xe1+ and Xe2+ calculated with the PPT theory and the heuristic formula (HM). The 2D averaged yield (a) and yield ratio (b) are shown as a function of the peak intensity within the considered volume, as well as the 3D averaged yield (c) and yield ratio (d). The aberrated beam geometry was used for the calculation. In (b), the measured 2D averaged yield ratio between double and single ionization is displayed with error bars, and in (d) the corresponding 3D averaged results by Pullen et al [7].
Download figure:
Standard image High-resolution image
Our findings further confirm the result of Pullen et al [7] that the transition from NSDI to SDI occurs already at an intensity lower than 1.2 × 10¹⁴ W cm−2. Nevertheless, the yield ratio reported in [7] was 40 times lower than the one observed here. One reason for this deviation stems from the differences between 2D and 3D averaging. A comparison between 2D and 3D focal averaging performed for argon at 750 nm showed that the relative differences in the single to double ionization yield ratios is less than 50% [24]. The above discussion (see figure 5) indicates that for xenon, in contrast, 3D averaging decreases the yield ratio by a factor of 3 as compared to 2D averaging for both the Gaussian and aberrated focus. However, even when accounting for the different focal averaging conditions, the results still differ by one order of magnitude. For the focus geometry, pulse duration, and pulse energy of our experiment, we can safely provide a conservative upper limit of 1.4 × 10¹⁴ W cm−2 for the peak intensity. Pullen et al measured the double to single ionization yield ratio for xenon up to an intensity of 1.15 × 10¹⁴ W cm−2 and observed a rapid increase in the yield ratio for peak intensities around 1014 W cm−2. Extrapolating this trend to higher intensities suggests that the difference may result from the somewhat higher intensity in our experiment.
A detailed comparison of the measured and calculated Kr+ and Kr2+ yields is provided in the supple-mentary material. We find that as in the case of xenon, the Kr2+/Kr+ yield ratio is governed by sequential ionization. We attribute the lower yield ratio for krypton to its higher first and second ionization potentials (IP1 = 14.0 eV, IP2 = 24.4 eV) as compared to xenon (IP1 = 12.1 eV, IP2 = 21.2 eV), and to its lower single photon ionization cross section. The fact that despite these differences in their ionization potentials, singly charged xenon and krypton ions are produced in nearly equal amounts provides further evidence for the saturation of single ionization.
While the Xe3+/Xe1+ yield ratio predicted by the HM at our intensity amounts to 19%, the Kr3+/Kr1+ yield ratio is below 3 × 10⁻⁶ for intensities up to 1.4 × 10¹⁴ W cm−2 (see figure H(b) in the supplementary material). Moreover, in contrast to the essentially background free Xe3+ signal, the Kr3+ signal overlaps with the  background, which explains why a potential non-sequential yield contribution could not be detected within the limited signal to noise ratio of our experiment.
5. Conclusion
We have measured the Xe2+/Xe1+, Xe3+/Xe1+ as well as the Kr2+/Kr1+ yield ratios resulting from strong field ionization of xenon and krypton with a few cycle (45 fs) mid-IR (3.2 μm) laser pulse with a peak intensity around 1014 W cm−2. Our special geometry allowed us to collect the ions over a restricted focal volume, i.e. a thin slice with only a weak intensity variation along the laser propagation direction. Our main result, a doubly to singly charged xenon yield ratio of (72 ± 3)%, contrasts with the results of previous experimental and theoretical studies.
Acknowledgments
We are grateful for support from the German Research Foundation via LMUexcellent, from the Max Planck Society via the Max Planck Fellow program, and from LASERLAB-EUROPE (EU-H2020-LASERLAB-EUROPE-654148). The ELI-ALPS project (GINOP-2.3.6-15-2015-00001) is supported by the European Union and co-financed by the European Regional Development Fund.
Data availability statement
All data that support the findings of this study are included within the article (and any supplementary files).