


Abstract
We report a comprehensive investigation of the frustrated magnetism on the delafossite oxides, α-CrOOH and α-CrOOD, which experimentally realize the S = 3/2 nearly-Heisenberg antiferromagnetic (J1 > 0) model on a triangular lattice with weak single-ion anisotropy (D). The electron spin resonance (ESR), neutron scattering, and specific heat (Cm) measurements on both α-CrOOH and α-CrOOD consistently indicate that the long-range 120° Néel order is significantly suppressed and both systems are in the vicinity of a spin-liquid phase with Cm ∼ T2 at low temperatures. The strength of D is quantitatively determined from fitting the high-temperature ESR linewidth and magnetic susceptibility, and its minus sign (D < 0, easy-axis type) is suggested by the low-energy (E ⩽ 2 meV) spin excitations. This easy-axis anisotropy (D/J1 ∼ −5%) competes with the 120° Néel order and thus enhances the quantum spin fluctuations at low temperatures.
Export citation and abstract BibTeX RIS

Original content from this work may be used under the terms of the Creative Commons Attribution 4.0 licence. Any further distribution of this work must maintain attribution to the author(s) and the title of the work, journal citation and DOI.
1. Introduction
Periodic order of spins (electronic magnetic moments) is usually stabilized by the interactions in the periodic crystalline lattice of a magnet at low temperatures. When geometrical frustration kicks in, not all interactions can be satisfied simultaneously, the periodic spin order may get suppressed even at zero temperature, and exotic disordered phases, e.g. quantum spin liquid (QSL), may emerge [1–3]. The prototype of a QSL, i.e. resonating-valence-bond state, had been proposed by Anderson on the S = 1/2 triangular-lattice Heisenberg antiferromagnetic (THAF) model in 1973 [4]. Since then, QSL has been arousing great interest in the community owing to its novel properties, such as quantum number fractionalization and intrinsic topological order, which may be intimately related to the understanding of high-temperature superconductivity and the realizing of topological quantum computation [5–9].
Although the exact ground state of the nearest-neighbor (NN) THAF model has been revealed to be long-range 120° Néel ordered [10–12], the slight modifications of the ideal model, i.e. the inclusion of next-nearest-neighbor (NNN) interactions [13–16], multiple-spin exchanges [17, 18], coupling anisotropy [19], or (and) randomness [20–24], etc, can give rise to various disordered and even QSL ground phases. On the experimental side, there exist lots of S = 1/2 triangular-lattice antiferromagnets exhibiting QSL behaviors, such as κ-(BEDT-TTF)2Cu2(CN)3 [25–27], EtMe3Sb[Pd(dmit)2]2 [28–31], Ba3CuSb2O9 [32], YbMgGaO4 [9, 33–40], and NaYbCh2 (Ch = O, S, Se) [41–45]. Furthermore, QSLs can be stabilized in the S = 1 triangular-lattice antiferromagnets with additional interaction terms [46–49], which may be well materialized in NiGa2S4 [50, 51] and Ba3NiSb2O9 [52]. As S increases, quantum fluctuations decrease, and the suppression of the long-range spin order becomes challenging. Therefore, it is crucial to explore whether and how the long-range 120° Néel order can be significantly suppressed by perturbation interactions in a real triangular-lattice antiferromagnetic (TAF) material with larger S. Among others, the delafossite oxides ACrO2 (A = D, H, Cu, Ag) [53–64] have been proposed to experimentally realize the S = 3/2 THAF model, and thus constitute an intriguing venue for studying frustrated magnetism of TAF systems. However, the low-temperature magnetism of delafossite α-CrOOH and α-CrOOD, as well as the role of single-ion anisotropy interactions on the frustrated magnetism, were not comprehensively studied to date.
In this paper, we perform a thorough investigation of the frustrated magnetism of the S = 3/2 TAF compounds, α-CrOOH and α-CrOOD, including specific heat, magnetization, x-band & high-frequency electron spin resonance (ESR), elastic & inelastic neutron scattering measurements, as well as the finite-temperature Lanczos diagonalization (FLD) simulation. Both α-CrOOH and α-CrOOD have well separated and regular triangular lattices of Cr3+ (S = 3/2) ions with symmetrically forbidden Dzyaloshinsky–Moriya (DM) interactions and with negligible magnetic impurities. The nearly THAF Hamiltonian with a weak single-ion anisotropy (|D|/J1 ∼ 5%) is quantitatively determined, by simultaneously fitting the high-temperature ESR linewidth and susceptibility. Despite the weak magnetic freezing, the main paramagnetic ESR signal is clearly visible and the neutron diffraction shows no additional magnetic peak within the resolution well below Tf ∼ 25 and 22 K in α-CrOOH and α-CrOOD, respectively. In contrast to CuCrO2, the magnetic specific heat (Cm) of α-CrOOH(D) exhibits a very broad hump at around the transition temperature. Additionally, the power exponent is clearly reduced, γ(H) = 2.28(1) and γ(D) = 2.151(2) compared with γ(Cu) = 3, in Cm (T → 0) ∝ Tγ . Our observations consistently verify that the three-dimensional (3D) long-range Néel order is significantly suppressed in both α-CrOOH and α-CrOOD. The relatively large spectral weight of the low-energy (E ⩽ 2 meV) excitations probed by inelastic neutron scattering (INS) suggests the easy-axis type of the single-ion anisotropy with D < 0. This easy-axis anisotropy further frustrates the long-range 120° Néel order, and drives the system in the vicinity of a spin-liquid phase, possibly with the help of other symmetrically-allowed perturbation interactions in the real material.
2. Technical details
2.1. Sample synthesis and characterization
Powder samples of α-CrOOH and α-CrOOD were synthesized using the high-temperature hydrothermal technique at an autogenic pressure of ⩽ 20 MPa [61, 62]. A 50 mL stainless steel liner was charged with 15 mmol Na2CrO4·4H2O (> 99%, Adamas Reagent Co., Ltd), 22.5 mmol CHNaO2 (> 98.5%, Shanghai Titan Scientific Co., Ltd), and 10 ml of high-purity H2O (for α-CrOOH) or D2O (⩾ 99.9%, Shanghai Titan Scientific Co., Ltd, for α-CrOOD). The liner was capped and mounted into a stainless steel pressure vessel. The vessel was heated to 350 °C at a rate of 1 °C min−1, and the temperature was maintained for 20 hours and then cooled down to room temperature at a rate of −0.5 °C min−1. A green-grey powder (∼ 1.1 g, the yield of ∼ 85%) of α-CrOOH(D) was obtained after rinsing, filtration, and drying. The phase purity was confirmed by both x-ray and neutron diffraction measurements (appendix
Magnetization (susceptibility) of α-CrOOH(D) was measured down to 1.8 K using powder samples of ∼ 40 mg, by a magnetic property measurement system (MPMS, Quantum Design, up to 7 T) and by a physical property measurement system (PPMS, Quantum Design, up to 14 T). The specific heat (2 ⩽ T ⩽ 200 K) was measured at 0, 2, and 4 T using a dry-pressed disk of powder (∼ 4 mg) in a PPMS. N grease was used to facilitate thermal contact between the sample and the puck, and the sample coupling was better than 99%. The specific-heat contributions of the grease and puck in different applied fields were measured at first and subtracted from the data.
2.2. ESR, neutron diffraction, and INS measurements
Both steady-high-field (high-frequency) and x-band ESR measurements (∼ 30 mg of samples) were performed on the Steady High Magnetic Field Facilities, Chinese Academy of Sciences. The high-field ESR data down to 2 K were collected by sweeping the steady magnetic field from 0 up to 20 T at selected frequencies of f = 214, 230, and 331.44 GHz, respectively. The x-band (f ∼ 9.4 GHz) ESR measurements were carried out using a Bruker EMX plus 10/12 continuous wave spectrometer. The measured ESR signals/modes were fitted using the derivative Lorentzian function on a powder average,

where A0 and Bck are the integrated intensity and background, ω is the full width at half maximum (FWHM),  and
and  are the resonance fields along the ab plane and c axis, respectively.
The neutron diffraction experiments were conducted with the high-intensity multi-section neutron powder diffractometer, Fenghuang [65], using powder samples of ∼ 2.2 g, at China Mianyang Research Reactor. The incident neutron wavelength of 1.5925 Å was determined by the monochromator, Ge (5 1 1). The INS experiment was performed using α-CrOOD of ∼ 6 g on the BOYA multiplexing cold neutron spectrometer stationed at the China Advanced Research Reactor. Utilizing the CAMEA concept [66], BOYA simultaneously probes five fixed final energies (Ef) of 3.0 (energy resolution of σ = 0.11 meV), 3.5 (σ = 0.15 meV), 4.0 (σ = 0.18 meV), 4.5 (σ = 0.21 meV) and 5.0 meV (σ = 0.26 meV), and 17–34 scattering angles spanning 120° in the horizontal plane. Highly oriented pyrolytic graphite crystals were used as the monochromator and analyzers. Cryogenic Be filters were applied after the sample to cut off energies higher than 5 meV.
2.3. Calculation and simulation
We carried out FLD calculations [67, 68] for the susceptibility, specific heat, and ESR linewidth on the 12-site S = 3/2 TAF clusters with periodic boundary conditions (PBC) (appendix

where N,  and
and  are the number of the data points, the measured value and its standard deviation, respectively, whereas
  is the calculated value.
The powder INS spectra were calculated for the S = 3/2 TAF model using the Spinw-Matlab code based on the linear spin-wave theory [70]. An average of the results calculated along 10 000 random orientations was performed at each  for the dynamic structure factor
  . The INS spectra were calculated by the convolution of the instrumental resolution (Gaussian) function (σ = 0.25 meV) and
  as
as ![${I}^{\perp }\left(\left\vert \mathbf{Q}\right\vert ,E\right)={\left\vert f\left(\left\vert \mathbf{Q}\right\vert \right)\right\vert }^{2}\int {S}^{\perp }\left(\left\vert \mathbf{Q}\right\vert ,{E}^{\prime}\right)\frac{\mathrm{exp}\left[-4\enspace \mathrm{ln}\enspace 2{\left(E-{E}^{\prime}\right)}^{2}/{\sigma }^{2}\right]}{\sigma \sqrt{\pi /\left(4\enspace \mathrm{ln}\enspace 2\right)}}\enspace \mathrm{d}{E}^{\prime}$](https://content.cld.iop.org/journals/1367-2630/23/3/033040/revision3/njpabe813ieqn9.gif) , where
, where  is the magnetic form factor of Cr3+ in the dipole approximation. The classical magnetic ground states used in the above spin-wave simulation were calculated by Monte Carlo simulation at D/J1 = 5% and −5%, respectively. At D/J1 = 5%, the spin vectors of three ions forming an equilateral triangle are arranged in the ab plane with
  = 0, and the angles between them are the same, θ1,2 = θ2,3 = θ3,1 = 120°. At D/J1 = −5%, while
  = 1.137, θ1,2 = 120.14°, θ2,3 = 118.98°, and θ3,1 = 360° − θ1,2 − θ2,3 are obtained. The international system of units is used throughout this paper.
3. Results
3.1. Exchange Hamiltonian
Both α-CrOOH and α-CrOOD are good insulators with room-temperature resistance larger than 20 MΩ. Through Rietveld refinements, both x-ray and neutron diffraction measurements indicate that the delafossite structure (space group: R
 m) maintains at least down to 8 K (appendix
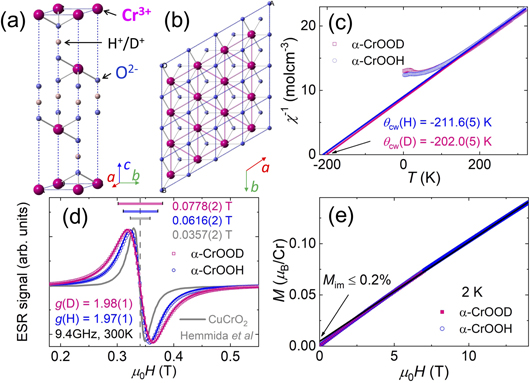
Figure 1. (a) Crystal structure of α-CrOOH(D). (b) Triangular lattice of Cr3+ ions in the ab plane, with showing NN O2− ions. The dashed blue lines in (a) and (b) mark the unit cells. (c) Inverse susceptibilities measured on α-CrOOH and α-CrOOD. The colored lines represent the linear fits to the data above 200 K. (d) X-band (f = 9.4 GHz) ESR spectra of α-CrOOD (red) and α-CrOOH (blue) measured at 300 K. The colored lines show the fits to the experimental data using the derivative Lorentzian function, and the gray line presents the x-band spectra of CuCrO2 reported in reference [60] for comparison. The dashed lines and horizontal bars show the fitted resonance fields (Lorentzian centers, μ0 Hres) and linewidths (FWHMs, ω), respectively. (e) Magnetization of α-CrOOH and α-CrOOD measured at 2 K, with the black line showing the linear fit to the data of α-CrOOH above 3 T.
Download figure:
Standard image High-resolution imageAbove ∼200 K, the inverse susceptibility of α-CrOOH shows a linear temperature dependence (Curie–Weiss law, see figure 1(c)). We obtain the effective magnetic moment of  , from the fitted Curie constant C = 23.42(2) Kcm3 mol−1. The g factor is nearly constant and isotropic at high temperatures, g = 1.97(1) ∼ 2, from fitting the ESR spectra (see figure 1(d)), and we further get the experimental value of S = 1.52(1), which is well consistent with the expected one S = 3/2. The 3d electrons of Cr3+ are localized spatially as the conductivity is poor, and the spin–orbit couplings are weak as evidenced by g ∼ 2. Therefore, one can expect a nearly Heisenberg Hamiltonian for α-CrOOH(D) as proposed in other Cr3+-based TAF compounds [53, 55],

where the strengths of the single-ion anisotropy (D) and NNN exchange (J2) terms are much weaker than that of the NN exchange interactions (J1). The fitted Weiss temperature (see figure 1(c)), θcw(H) = −211.6(5) K, estimates the antiferromagnetic exchange energy as J1+J2 ∼ −3θcw(H)/[6S(S+1)] ∼ 28 K.
Owing to the absence of strong DM interactions [72] and coupling anisotropy [34], the high-temperature paramagnetic ESR linewidths are relatively narrow, ω ∼ 0.0616(2) T in α-CrOOH and ω ∼ 0.0778(2) T in α-CrOOD (figure 1(d)), that are an order of magnitude smaller than those reported in the QSL candidates, such as ZnCu3(OH)6Cl2 [72] and YbMgGaO4 [34]. As the frequency increases to 214 GHz, the ESR linewidth is only slightly increased, ω(214 GHz) ∼ 1.7ω(9.4 GHz) (see figure 2(b)), suggesting both g-factor randomness and anisotropy have marginal effect, ∆g ∼ μB g2[ω(f2) − ω(f1)]/(hf2 − hf1) ∼ 0.006g. The contribution of ∆g to the ESR linewidth (Zeeman contribution) is negligible at f ∼ 9.4 GHz, ω∆ = ∆ghf/(μB g2) ∼ 2 mT ≪ ω, and thus we can safely use the high-temperature X-band ESR linewidth to determine the strength of the anisotropy interactions (see below).

Figure 2. Combined fits to (a) bulk susceptibility and (b) X-band (f = 9.4 GHz) ESR linewidth above 60 K. In (a), the dashed olive line represents the Curie–Weiss fit above 200 K, and the violet scatters show the integrated x-band (f = 9.4 GHz) and high-field (f = 214 GHz) ESR intensities of the paramagnetic signal. In (b), the high-field ESR linewidth measured at f = 214 GHz is shown for comparison. The freezing temperature of Tf = 25 K is marked by the dashed gray line. (c) High-field ESR spectra (divided by temperature) of α-CrOOH measured at f = 214 GHz. Three resonance modes observed below Tf = 25 K are marked as A, B, and PM, respectively. (d) ESR signals measured at selected frequencies and 2 K. The field shifts of the additional modes (A and B) are marked by arrows. The ESR spectra are vertically shifted in both (c) and (d).
Download figure:
Standard image High-resolution imageThe spin system of α-CrOOH is almost linearly polarized in an applied magnetic field up to 14 T at 2 K, with M < 5%Msa, confirming the strong AF interactions (figure 1(e)). Here, Msa = gS μB/Cr is the saturation magnetization. A high magnetic field of μ0 H1/3 ∼ 3J1 S/(gμB) ∼ 90 T is required to stabilize the 1/3 magnetization plateau, and the linear field dependence of magnetization is expected well below μ0 H1/3, according to the reported numerical result [73]. Through a linear fit to the magnetization above 3 T (figure 1(e)), the concentration of impurity spins, Mim ⩽ 0.2%Msa, is obtained from the fitted intercept, and is much smaller than that of many other frustrated magnets, e.g. 7.7% in ZnCu3(OH)6Cl2 [74]. Therefore, similar to other delafossite oxides (e.g. CuCrO2 and AgCrO2) the impurity effect is also negligible in α-CrOOH(D).
3.2. Fits to ESR linewidth and susceptibility
The high-temperature ESR linewidth is highly sensitive to the magnetic anisotropy of a spin system, and thus has been widely used in determining microscopic Hamiltonian parameters [34, 72, 75]. At T ≫ gμB μ0 H/kB, the ESR linewidth is given as [75]

where ![${M}_{2}=\langle \left[{\mathcal{H}}^{\prime },{M}^{+}\right]\left[{M}^{-},{\mathcal{H}}^{\prime }\right]\rangle /\langle {M}^{+}{M}^{-}\rangle $](https://content.cld.iop.org/journals/1367-2630/23/3/033040/revision3/njpabe813ieqn15.gif) and
and ![${M}_{4}=\langle \left[\mathcal{H},\left[{\mathcal{H}}^{\prime },{M}^{+}\right]\right]\left[\mathcal{H},\left[{\mathcal{H}}^{\prime },{M}^{-}\right]\right]\rangle /\langle {M}^{+}{M}^{-}\rangle $](https://content.cld.iop.org/journals/1367-2630/23/3/033040/revision3/njpabe813ieqn16.gif) are the second and fourth moments, respectively, ⟨⟩ represents a thermal average, and
are the second and fourth moments, respectively, ⟨⟩ represents a thermal average, and  . Therefore, the perturbation terms in the Hamiltonian that do not commute with M± will contribute to the ESR linewidth.
Here, we discuss various sources that broaden the ESR signal. First of all, the hyperfine interactions broaden the ESR linewidth with  < 0.3 μT, where |Ah| < 60 MHz is the hyperfine coupling of 53Cr3+ (abundance of 9.55%) [76]. The dipole–dipole interactions also contribute to the linewidth with
  0.2 mT, where
  1.9 GHz is the strength of dipole–dipole interactions and a = 2.98 Å is the lattice constant. There is only one Wyckoff position for Cr3+ ions, and thus the almost uniform Zeeman interactions cannot significantly broaden the x-band ESR linewidth (ωΔ ∼ 2 mT, see above). All of the above contributions together account for a linewidth that is more than one order of magnitude smaller than the observed value of ω ⩾ 0.06 T.
The single-ion anisotropy (D) terms in equation (3) do not commute with M±, and thus can give rise to the ESR broadening. At T ≫ J1 S2 kB −1, ⟨⟩ → tr() is expected in equation (4), and we obtain the ESR linewidth as

with |D|, |J2| ≪ J1. Taking J1 ∼ 28 K and ω(300 K) ∼ 0.06 T (see above), we reach a rough estimation of |D| ∼ 1.6 K.
Below ∼150 K, the susceptibility deviates from the Curie–Weiss law (figure 2(a)) and the ESR linewidth shows obvious temperature dependence (figure 2(b)), indicating the formation of low-T AF correlations. To reproduce better the experimental data and to determine more precisely the Hamiltonian parameters, we carry out the FLD calculations [67, 68] above 60 K, where the numerical finite size effects are negligible (appendix
3.3. Suppression of the long-range Néel order
Toward the experimental realizing of a QSL in the geometrically-frustrated delafossite family, the ground-state magnetic order must be significantly suppressed at first. In α-CrOOH, the paramagnetic ESR signal with a relatively broad linewidth of ∼0.4 T (PM) is clearly observed down to 2 K (≪Tf(H), see figure 2(c)), implying the presence of persistent spin fluctuations. In sharp contrast, the x-band ESR spectra of CuCrO2 and AgCrO2 get undetectable on approaching their transition temperatures of 24 and 21 K, respectively [60]. Besides the paramagnetic signal, two additional ESR models (A and B) with sharp linewidths of ∼ 0.04 T are also detected below Tf(H) (figure 2(c)), and the additional signals (μ0 Hres/f) show obvious frequency dependence at 2 K (figure 2(d)), thereby indicating that a magnetic freezing occurs for α-CrOOH. Despite the transition, the integrated intensities of A and B modes are nearly one order of magnitude smaller than that of the predominant PM mode, suggesting that only a small fraction of Cr3+ spins (⩽ 20%) get frozen. Below Tf ∼ 25 K, the ESR intensity of the paramagnetic signal that is proportional to the imaginary part of the dynamic susceptibility [72] obviously deviates from the bulk susceptibility, and quickly decreases to a small constant of 0.006(1) cm3 mol−1 (figure 2(a)). Meanwhile, the line width decreases to ∼ 0.4 T as well (figure 2(b)). These observations might be attributed to the spin freezing, while the decrease of the paramagnetic ESR intensity from ∼ 0.09(2) cm3 mol−1 at ∼ 30 K to ∼0.006(1) cm3 mol−1 at ∼ 2 K (figure 2(a)) seems also consistent with the theoretical prediction of the ideal Dirac spin liquid for susceptibility (χ) among the dynamic spins, χ ∝ T [46]. The bulk susceptibility contributed from both dynamic and frozen spins is nearly constant below ∼ 30 K, χbulk ∼ 0.08 cm3 mol−1 (figure 2(a)), in comparison with the local ESR one.
For delafossite CuCrO2, a long-range 3D 120° Néel order with a moment of (3.1 ± 0.2)μB in the ac plane has been revealed by neutron powder diffraction measured at low temperatures [53]. Similarly, we carry out the neutron powder diffraction measurements for both α-CrOOH (figure 3(a)) and α-CrOOD (figure 3(b)). In contrast to other delafossite oxides [53, 58, 59], no obvious difference of the neutron patterns at between 8 K (well below Tf) and 50 K (well above Tf) can be detected, except the very ambiguous signal around |Q| = 4π/(3a) ∼ 1.41 Å−1 that may relate to the small amount of frozen spins in both α-CrOOH and α-CrOOD. For α-CrOOH, the upper bound of the static structure factor at |Q| = 4π/(3a) is roughly estimated as ![${M}_{\text{sub}}^{2}/2=\langle \left\vert I\left(8\;\mathrm{K}\right)-I\left(50\;\mathrm{K}\right)\right\vert \rangle /\left[6{\times}{\left(5.4\enspace \mathrm{f}\mathrm{m}\right)}^{2}{S}_{\text{ph}}{\left\vert f\left(\left\vert \mathbf{Q}\right\vert \right)\right\vert }^{2}\right]{\leqslant}0.2$](https://content.cld.iop.org/journals/1367-2630/23/3/033040/revision3/njpabe813ieqn21.gif) per Cr [69], that is much smaller than the recently reported value of ∼0.75 per site calculated using the ideal S = 3/2 NN THAF model [73]. Here, Sph = In
/(2|Fn
|2) ∼ 11.9 fm−2 Cr is the scale factor with In
= 2160(140) and |Fn
|2 = 91 fm2/Cr presenting the observed intensity and calculated structure factor of the (0 0 3) nuclear reflection (see figure 3(a)), respectively, and
per Cr [69], that is much smaller than the recently reported value of ∼0.75 per site calculated using the ideal S = 3/2 NN THAF model [73]. Here, Sph = In
/(2|Fn
|2) ∼ 11.9 fm−2 Cr is the scale factor with In
= 2160(140) and |Fn
|2 = 91 fm2/Cr presenting the observed intensity and calculated structure factor of the (0 0 3) nuclear reflection (see figure 3(a)), respectively, and  ⩽ 300. This static structure factor corresponds to an average moment of gμB
Msub ⩽ 1.2μB in α-CrOOH, much smaller than that reported in CuCrO2 [53]. For α-CrOOD, the similar conclusion can be drawn.
⩽ 300. This static structure factor corresponds to an average moment of gμB
Msub ⩽ 1.2μB in α-CrOOH, much smaller than that reported in CuCrO2 [53]. For α-CrOOD, the similar conclusion can be drawn.
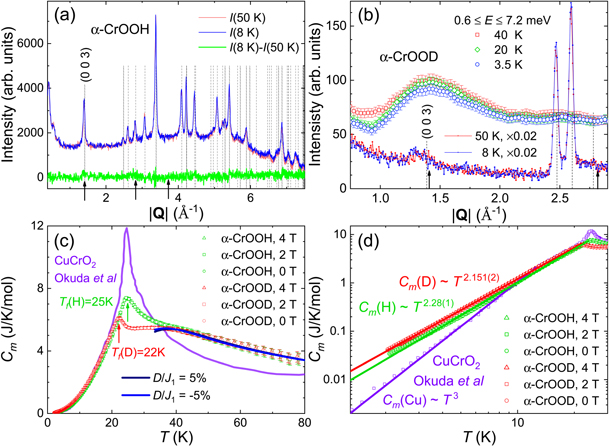
Figure 3. (a) Neutron powder diffraction patterns of α-CrOOH measured at 8 K [I(8 K)] and 50 K [I(50 K)] with the green line showing the difference I(8 K)−I(50 K). (b) INS spectra of α-CrOOD integrated over 0.6 ⩽ E ⩽ 7.2 meV (scatters), with showing the elastic data (solid lines) for comparison. The dashed lines mark the location of the nuclear reflections for α-CrOOH (a) and α-CrOOD (b), whereas the arrows show the location of magnetic reflections of the three-sublattice order. (c) Magnetic heat capacities of α-CrOOD (red) and α-CrOOH (green) measured at selected magnetic fields. The black and blue lines show the calculated results using two different sets of parameters, and the violet line shows the magnetic specific heat of CuCrO2 reported in references [57, 58] for comparison. (d) Power-law behaviors of the specific heat observed in α-CrOOD (red), α-CrOOH (green), and CuCrO2 (violet, abstracted from references [57, 58]) below the transition temperatures.
Download figure:
Standard image High-resolution imageOur specific heat of α-CrOOH (α-CrOOD) measured at zero field shows the magnetic transition at Tf = 25 K (22 K), which is well consistent with the previously reported results [63, 64] (figure 3(c)). At the transition temperature, the magnetic specific heat (see appendix
Below the transition temperature, the magnetic specific heat behaves a power-law temperature dependence, Cm ∝ Tγ , with γ(H) = 2.28(1) in α-CrOOH and with γ(D) = 2.151(2) in α-CrOOD, suggesting the formation of either long-range quasi two-dimensional AF order (spin-wave magnons) or unconventional magnetic state (e.g. Dirac spin-liquid states [16, 77]). The absence of sharp strong magnetic Bragg peaks in the neutron diffraction patterns measured at low temperatures (figures 3(a) and (b)) favors the later scenario, and thereby suggests that the system of α-CrOOH(D) is in the vicinity of a spin-liquid phase (similar to the case of Cu0.85Ag0.15CrO2 [58, 59]). In contrast, CuCrO2 exhibits Cm ∝ T3, thus confirming the long-range 3D order there [57, 58].
3.4. INS spectra
The ESR, neutron diffraction, and specific heat measurements consistently indicate that the long-range 120° Néel order is significantly (at least partially) suppressed at low temperatures in both α-CrOOH and α-CrOOD (figures 2 and 3). This can be further confirmed by the INS spectra, as no sharp spin-wave dispersion is clearly observed down to 3.5 K in α-CrOOD (figure 4(a)). In contrast, the calculated spectra of the spin-wave excitations from the classical three-sublattice ordered ground states show sharp dispersions even on the powder average at the same temperature (figures 4(b) and (c)). The structural diffraction is very sharp with FWHMs of ∼ 0.1 Å−1 in the wave-vector space (figure 3(b)), and the energies of phonon excitations, E ⩾ θE2 ∼ 60 meV (appendix

Figure 4. (a) INS spectrum of α-CrOOD measured at 3.5 K, with the arrow showing |Q| = 4π/(3a). Powder spectra of the spin-wave excitations calculated at 3.5 K for the S = 3/2 TAF models with D/J1 = −5% (b) and 5% (c), respectively, based on the linear spin-wave theory. The classical ground-state magnetic structures calculated by Monte Carlo simulation and J1 = 22.4 K are used in the spin-wave calculations. The widths (i.e. FWHMs) at 1.5 meV are marked in (a) and (b).
Download figure:
Standard image High-resolution image4. Discussion
In the classical level (i.e. spins have real vectors), the easy-plane single-ion anisotropy (D > 0, see equation (3)) stabilizes the 120° Néel order in the ab plane [55]. In contrast, the easy-axis anisotropy (D < 0) competes with the 120° Néel order, and leads to spin components along the c axis. Although the sign of D cannot be settled from fitting the ESR and thermodynamic data measured above Tf (see figures 2(a) and (b) and 3(c)), the observation of the significant suppression of the long-range 120° Néel order nevertheless suggests that the single-ion anisotropy should be an easy-axis type, D < 0, in α-CrOOH(D). This is consistent with that suggested in the other delafossite CuCrO2 by neutron diffraction [53]. Conversely, the easy-plane anisotropy of D/J1 ∼ 5% stabilizes the order and tends to lower the spectral weight of the low-energy (E ⩽ 2 meV) spin excitations (see figure 4(c)), in sharp contrast to the INS observations (figure 4(a)).
The magnetic properties of the delafossite family are summarized in table 1. Compared to CuCrO2, the easy-axis anisotropy of D/J1 is significantly enhanced as evidenced by the increase of the high-temperature ESR linewidth (see figure 1(d)), and thus improves the frustration factor of −θcw/Tf in α-CrOOH(D). Therefore, the easy-axis anisotropy is an important ingredient in causing additional frustration for delafossite oxides. It is plausible that the further enhanced easy-axis anisotropy would completely melt the frozen spins and make the system into a real spin liquid at low temperatures, through other element substitutions onto the A sites. Very recently, Calvera and Wang have developed a theory of critical Dirac spin liquids on the TAF model with arbitrary spins, which may apply to the majority dynamic spins (⩾ 80%) of α-CrOOH(D) owing to the observations of Cm ∼ T2.2 and the accumulation of the INS spectral weight around the K points (|Q| = 4π/(3a), see figure 4(a)) [77].
Table 1. Frustrated magnetism of delafossite oxides ACrO2 (A = D, H, Cu, Ag).
| A | θcw (K) | Tf (K) | −θcw/Tf | X-band ω(300 K) (T) | D/J1 |
|---|---|---|---|---|---|
| D | −202.0(5) | 22 | 9.2 | 0.0778(2) | −5.3% |
| H | −211.6(5) | 25 | 8.5 | 0.0616(2) | −4.6% |
| Cu | ∼ −163 [59] | 24 [59] | ∼6.8 | 0.0357(2) [60] | ∼ −4% |
| Ag | −132 [54] | 21 [60] | 6.3 | 0.0413(2) [60] | ∼ ±4% |
In the exchange Hamiltonian (see equation (3)), there exist other symmetrically-allowed interaction terms (i.e. perturbations) which can significantly affect the ground-state properties of the system as well. For instance, the upper bounds of the interlayer and NNN exchange interactions, |J⊥| ⩽ 0.24J1 ∼ 5 K and |J2| ⩽ 0.19J1 ∼ 4 K, respectively, can be roughly estimated according to the crystal structure (table A1) in the long-range limit of spin−spin interactions, ∝ 1/r3. Unfortunately, it is difficult to determine the precise strengths from simultaneously fitting the high-temperature (above 60 K) ESR linewidth and susceptibility, as both J⊥ and J2 terms commute with M±. The interlayer J⊥ interaction is usually thought of as a negative factor preventing spin-liquid states to occur in triangular-lattice antiferromagnets [78], and may cause the spin freezing observed at Tf in the delafossite oxides. On the other hand, a small NNN interaction of J2 ∼ 0.125J1 is large enough to stabilize spin-liquid phases in the triangular-lattice antiferromagnets [13–16, 77].
Table A1. Rietveld refined structures of α-CrOOH using the delafossite structure (space group: R
 m). Here, Oc represents the occupancy fraction, Cr–Crintra and Cr−Crinter are the intralayer and interlayer distances of Cr–Cr, respectively.
| 300 K (x-ray) | 50 K (neutron) | 8 K (neutron) | |
|---|---|---|---|
| a (Å) | 2.9814(2) | 2.9758(3) | 2.9739(3) |
| c (Å) | 13.4122(8) | 13.409(3) | 13.413(3) |
| z(O) | 0.40803(7) | 0.4060(2) | 0.4060(2) |
| z(H) (Oc: 0.5) | 0.506 (fixed) | 0.5001(3) | 0.5001(3) |
| Rp (%) | 4.22 | 2.65 | 2.73 |
| Cr–O (Å) | 1.991 | 1.975 | 1.974 |
| ∠CrOCr (°) | 96.92 | 97.75 | 97.74 |
| Cr–Crintra (Å) | 2.9814 | 2.9758 | 2.9739 |
| Cr–Crinter (Å) | 4.791 | 4.789 | 4.789 |
5. Conclusions
We have studied the frustrated magnetism of the S = 3/2 TAF compounds α-CrOOH and α-CrOOD, by neutron scattering, ESR, and thermodynamic measurements. The nearly Heisenberg Hamiltonian with a weak easy-axis single-ion anisotropy (D/J1 ∼ −5%) is quantitatively determined from fitting the experimental data. Owing to the easy-axis anisotropy and (or) other perturbations, the magnetic order of α-CrOOH(D) is significantly suppressed at low temperatures. Our work should shed new light on the search for QSLs in the frustrated systems with S = 3/2.
Data availability statement
The data generated and/or analysed during the current study are not publicly available for legal/ethical reasons but are available from the corresponding author on reasonable request.
Acknowledgments
We thank Zhongwen Ouyang and Lei Yin for ESR measurements, as well as Qingming Zhang, Shun Wang, Jianshu Li, Feng Jin, and Quanwen Zhao for specific heat measurements. YL thanks Bin Xi for helpful discussion on the many-body simulation. WT was supported by the National Key Research and Development Program of China (Grant No. 2017YFA0403502) and the National Natural Science Foundation of China (No. U1732275). This work was supported by the National Natural Science Foundation of China (No. 11875238 and No. 12004426) and the Fundamental Research Funds for the Central Universities, HUST: 2020kfyXJJS054.
Appendix A.: Crystal structure characterization
The powders of α-CrOOH and α-CrOOD are shown in figure A1. Both x-ray and neutron powder diffraction measurements preclude significant impurity phases (< 5%) and structure transitions, as no additional peak is observed at least down to 8 K in α-CrOOH(D) (see figure A1). The structural information of the Rietveld refinement is summarized in table A1.
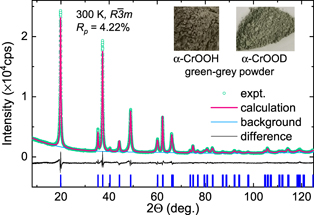
Figure A1. X-ray powder diffraction measured at 300 K and Rietveld refinement for α-CrOOH. The insets show the green-grey powders of α-CrOOH and α-CrOOD.
Download figure:
Standard image High-resolution imageAppendix B.: Quantum many-body simulation
To check the precision of our FLD calculations for the S = 3/2 TAF model, we first performed the full ED calculation on the N0 = 3×3 = 9 -site cluster with PBC [69] in the ideal Heisenberg case (i.e. J1 = J, D = 0, and J2 = 0). The dimension of the Hilbert space is given as Nst = 4N0
= 262 144, and the Hamiltonian matrix is too large for us to diagonalize directly. As Mz
≡ Σj
SJ
z
(eigenvalue: mz
) and the six-fold rotational symmetry operation (C6
z
) commute with the THAF Hamiltonian, we can divide the large Hamiltonian matrix into smaller ones with the maximum size of 5086×5086, through similarity transformations. After one-by-one diagonalizing these smaller Hamiltonian matrices, we obtain the eigenenergies,  , with mz
= −N0
S, −N0
S+1, ... , N0
S, at 0 T. Therefore, the partition function in a magnetic field of μ0
Hz
applied along the c axis is calculated as
, with mz
= −N0
S, −N0
S+1, ... , N0
S, at 0 T. Therefore, the partition function in a magnetic field of μ0
Hz
applied along the c axis is calculated as

we further calculate the spin susceptibility (black line in figure B1(a)) and specific heat (black line in figure B1(b)) as


Figure B1. Temperature dependence of (a) susceptibility and (b) specific heat calculated using Lanczos diagonalization and full exact diagonalization (ED) techniques, based on the same S = 3/2 nine-site cluster with PBC and with the NN AF Heisenberg coupling of J. (c) Temperature dependence of susceptibility calculated by applying the 12-(solid) and nine-site (dashed) Lanczos diagonalization with the same set of easy-axis parameters, J1 = 23 K, D = −1.1 K, and J2 = −2.3 K. The inset shows the 12-site cluster (solid) with PBC used in the FLD calculations. χ∥ and χ⊥ are spin susceptibilities calculated parallel and perpendicular to the c axis, and we used the powder-averaged value (χ∥+2χ⊥)/3 in the fits (see figure 2(a) in main text).
Download figure:
Standard image High-resolution imageThe full ED method requires extremely large CPU time,  , and memory,
  , when the cluster size increases to N0 = 12. Following reference [68], we apply the FLD method to calculate the physical quantities, using the Lanczos steps up to ML = 40 with the error of O(1/TML
+1). First of all, we calculate the spin susceptibilities and specific heat of the ideal S = 3/2 THAF model using the FLD method on the same nine-site cluster as that used in ED. The FLD results are almost overlapped by the above full ED calculations (see figures B1(a) and (b)). Thereupon we carry out the FLD calculations on the 12-site cluster with PBC (see inset of figure B1(c)) using ML = 40, and no significant size effect is observed above ∼60 K (see figure B1(c)).
, when the cluster size increases to N0 = 12. Following reference [68], we apply the FLD method to calculate the physical quantities, using the Lanczos steps up to ML = 40 with the error of O(1/TML
+1). First of all, we calculate the spin susceptibilities and specific heat of the ideal S = 3/2 THAF model using the FLD method on the same nine-site cluster as that used in ED. The FLD results are almost overlapped by the above full ED calculations (see figures B1(a) and (b)). Thereupon we carry out the FLD calculations on the 12-site cluster with PBC (see inset of figure B1(c)) using ML = 40, and no significant size effect is observed above ∼60 K (see figure B1(c)).
Appendix C.: Magnetic specific heat
The lattice specific heat (unit: JK−1 mol−1) above ∼ 60 K is obtained by subtracting the calculated magnetic contribution ( ) from the total measured specific heat for α-CrOOH(D) (see figures C1(a) and (c)). Each CrO2H(D) has 3 acoustic and 9 optical modes, and thus we use the similar Debye–Einstein function as reported in reference [63],

where θD, θE1, and θE2 are three fitting parameters. By fitting the lattice specific heat, we obtain θD = 397(1) K, θE1 = 1507(50) K, θE2 = 690(4) K, with the least-Rp = 0.18 (please see equation (2) for the definition of Rp) for α-CrOOH, and θD = 387(1) K, θE1 = 1235(60) K, θE2 = 691(5) K, with the least-Rp = 0.19 for α-CrOOD. With all three precisely fitted parameters at hand, we can calculate (extrapolate) the Debye–Einstein lattice specific heat using equation (C.1) in the entire temperature range (figures C1(a) and (c)).

Figure C1. Lattice specific heat of (a) α-CrOOH and (c) α-CrOOD obtained by subtracting the calculated magnetic contribution ( ) from the measured (total) specific heat (Cp). The green lines show the least-Rp fits above 60 K using the combination of the Debye and Einstein functions (equation (C.1)), and three fitted parameters are given. Magnetic entropy of (b) α-CrOOH and (d) α-CrOOD obtained by integrating Cm/T from T = 2 K, with the dashed blue lines showing the extrapolations above 200 K (calculations using J1 = 23.6 K, D = −1.08 K for α-CrOOH and using J1 = 22.4 K, D = −1.19 K for α-CrOOD).
Download figure:
Standard image High-resolution image
After subtracting the above Debye-Einstein contribution, we get the magnetic specific heat, Cm (see main text), and then the magnetic entropy (Sm) by an integral of Cm(T)/T (figures C1(b) and (d)). From 2 to 200 K, the increase of the magnetic entropy, ∆Sm ∼ Rln4 ∼ Rln(2S+1), obeys the third law of thermodynamics very well, and thus justifies the validity of the above method. Below ∼ 10 K, the temperature dependence of magnetic entropy flattens out at Sm ⩽ 3.5%Rln4, suggesting the approaching of the ground state.