


Abstract
The normal incidence x-ray standing wave (NIXSW) technique is the primary source of quantitative experimental information on the adsorption height of many near-planar molecules on metal surfaces, of relevance to organic electronics. The technique yields two structural parameters, the coherent position and the coherent fraction. For high values of the coherent fraction the coherent position can be related directly to the adsorption height, but because the coherent fraction is effectively an order parameter, low values of this parameter are often attributed to partial disorder. It is certainly true that in depositing these large molecules on a surface it is very challenging to produce a perfectly ordered surface. However, is the type of disorder that is likely to occur able to account for no other effect on measured NIXSW data than a lowering of the coherent fraction? Here we show, by considering a wide range of possible types of 'disorder', that in almost all such situations it is improbable that the coherent positions associated with very low coherent fractions actually provide a reliable measure of the adsorption height of the ordered component, as is often assumed to be the case. As such, presentations of NIXSW data that only consider coherent position values are likely to be extremely misleading, and provide an unreliable benchmark for detailed understanding of these interfaces.
Export citation and abstract BibTeX RIS

Original content from this work may be used under the terms of the Creative Commons Attribution 4.0 licence. Any further distribution of this work must maintain attribution to the author(s) and the title of the work, journal citation and DOI.
1. Introduction
In the last two decades or so, the technique of x-ray standing waves (XSW) [1, 2] has become the primary source of high-precision quantitative structural data for the adsorption heights of molecules, and particularly of essentially planar π-conjugated molecules, mainly on metal surfaces. This information is critical to understanding the nature of the molecule–metal interfaces of relevance to molecular electronics. Unfortunately, not all reports of such studies are sufficiently clear regarding potential ambiguities in the interpretation of the experimental data. This can lead to misleading information being promulgated, thereby generating wasted effort in interpreting subsequent studies and in performing theoretical calculations to model the implied (incorrect) structural solutions. The objective of this paper is to analyse the origin of these problems and their specific implications, but also to highlight how low coherent fractions, when fully considered, can provide valuable additional structural insight.
The XSW technique (figure 1) exploits the x-ray standing wave created by the interference of the incident and diffracted beam that occurs at a Bragg condition. As one scans through the Bragg condition by varying the incidence angle (a 'rocking curve') or the incident x-ray wavelength, there is a narrow range in which, for a non-absorbing crystal, the reflectivity is unity. Within the range of this flat-topped reflectivity curve, known as the Darwin curve, the standing wave, with a periodicity in intensity equal to that of the Bragg scattering planes, shifts in phase relative to the crystal by one half of this periodicity. The standing wave thus sweeps through the diffracting crystal, and x-ray absorption at atoms within the crystal varies in a fashion that depends on the location of the absorber relative to the Bragg planes. When the nodal planes of the standing wave lie on the absorber atom, no absorption occurs; when the antinodal planes lie on these atoms, the absorption is maximal. This atom-specific absorption can be monitored by the resulting x-ray fluorescence, Auger electron emission, or core level photoemission (at energies characteristic of the elemental and chemical identity of the absorbing atom). While the original demonstration of the effect investigated absorption at impurity atoms within the crystal [3], atoms on the surface are also immersed in the standing wavefield, so their location relative to the (extended) Bragg planes can also be determined in a similar fashion, an idea first highlighted a few years later [4].

Figure 1. Schematic summary of the XSW technique. On the left are shown the incident, I (full lines), and Bragg-reflected, R (dashed lines), wavefronts superimposed on a set of atomic scattering Bragg planes (blue lines), including interstitial (red) and adsorbed (green) atoms. In the centre is shown the standing wave field while on the right are sketches of the variation in reflectivity and atomic absorption at different sites as one scans through the Bragg condition in angle or wavelength (and photon energy).
Download figure:
Standard image High-resolution imageEarly applications of the XSW technique generally used grazing angles of incidence of hard x-rays, for which the rocking curve width (the width of the Darwin curve in incidence angle) is only a few seconds of arc, requiring the crystals investigated to have a very high degree of perfection. For this reason almost all early experiments were performed on Si or Ge crystals, which can be grown to meet this requirement. Subsequently, however, it was shown [5–7] that if the experiments were performed at, or very close to, normal incidence (θ = 90°) to the Bragg planes, this problem is overcome. At this condition the standard Bragg equation (2d sin θ = nλ) is at a turning point in θ and is thus far less sensitive to the exact angle of incidence. Normal incidence XSW (NIXSW) experiments are thus performed at a fixed incidence angle of 90° to the Bragg planes, scanning through the Bragg condition by varying the incident x-ray energy (and thus wavelength). Standard metal single crystals (with a mosaicity of several tenths of a degree) can be used without difficulty. The other key technique development relevant to structure determination of molecular adsorbates was to monitor the x-ray absorption at specific atoms by measuring the core level photoemission yield at good spectral resolution, enabling not only element-specific, but also chemical-state-specific, structural parameters to be determined through exploitation of core level shifts in photoemission [8, 9]. This is important as many of the molecular adsorbates of interest contain atoms of the same element (especially C, N and O) in two or more chemically-inequivalent (and thereby structurally-inequivalent) environments. Separate structural parameter values for these differently located atoms can provide direct information of the conformation of the adsorbed molecules.
The measured variations in photoabsorption or photoemission obtained in scanning through the standing wave condition can be fitted uniquely (with no recourse to any structural model) by two structural parameters, the coherent fraction, fco, and the coherent position, p. Formally, these are respectively the amplitude and phase of the first Fourier component of the real space structure [1]. p defines a position, relative to the Bragg planes, in units of the spacing of the Bragg planes, d; fco is an order parameter, perfect order of a single absorber atomic site corresponding a value of fco of unity. For a perfectly ordered system (statically and dynamically), with all the absorber atoms in identical local sites relative to the periodic crystal surface, fco = 1 and p can be related to the height of the absorbing atoms above the Bragg planes, D = (n + p)d, where n is an integer (most commonly 0 or 1) chosen to be consistent with physically reasonable absorber-substrate atom separations. Most NIXSW experiments are performed using Bragg planes parallel to the surface (i.e. with normal incidence to both the Bragg planes and the surface), so the D values obtained correspond to molecule-surface height differences. In practice, experimental values of fco are always less than unity, but 'high' (see below) values are taken indicate that one may still determine the structure by this simple interpretation. However, as will be demonstrated here, this interpretation breaks down even for values of the coherent fraction that show relatively modest reduction, yet very low fco values are reported (sometimes even less than 0.2) without proper consideration of the implications, implicitly attributing them to 'partial disorder' or thermal vibrations. The objective of this paper is to analyse how and why lower values of fco may arise. Ignoring the significance of low fco values can not only fail to exploit valuable structural information, but can lead to entirely spurious structural conclusions.
2. The structural implications of reduced values of the coherent fraction
The origin of reduced values of fco can, very simply, be related to the way this parameter is defined in the general theoretical description of the XSW technique [1, 2]. Specifically, if the absorbing atoms have a spatial distribution f(z), where z is the height of individual atoms relative to the Bragg planes in the structure, then fco and p are defined by

Evidently, if all absorbing atoms were to be at the same height, one obtains the trivial result fco = 1, as discussed above. More generally, there will be some distribution of heights. The most obvious (and inevitable) origin of this distribution is thermal vibrations. In this case the reduction in fco is given by the usual Debye–Waller factor of crystalline diffraction. In XSW, however, fco is reduced both by the effect of the vibrations of the atoms within the bulk crystal, which attenuates the intensity of the standing wave itself, and by the vibrations of the absorber atoms that are immersed in this standing wave field. The reduction in the intensity of the standing wavefield is given by the usual Debye–Waller factor e−2M, where, for the NIXSW experiment with the incidence angle θ = 90°,

where  is the mean-square displacement amplitude [10], assumed to show a Gaussian distribution consistent with harmonic vibrations. Notice that equation (2) can also be recast as

where , the atomic displacements being expressed in terms of local variations in the coherent position, p.
Most of the NIXSW studies of π-conjugated molecular adsorption have been on the surfaces of the three coinage metals, Cu, Ag and Au, and mainly on the (111) surfaces; for these surfaces, using standard tabulations of Debye temperatures (e.g. [11]), the values of e−2M at room temperature (the condition of most measurements), to two significant figures, are all approximately 0.95, so the contribution of this effect is to reduce the coherent fraction by approximately 5%. A second Debye–Waller factor arises from the vibrations of the absorbing atoms in the standing wavefield, but this reduction affects the amplitude, not the intensity, of the standing wavefield experienced by the absorbing atom, so this factor is e−M [1]. Unfortunately, there is very little quantitative information on the vibrational amplitudes perpendicular to the surface of absorbed molecules, and particularly of individual atoms within these molecules, although it seems likely that these displacements are larger than those of the underlying bulk metal atoms [for which the root-mean-square (rms) values at room temperature are ∼0.08 Å]. As the Debye–Waller factor can account for the effects of static, as well as dynamic atomic displacements, it is instructive to see how this factor varies with different assumed values of the rms displacement amplitudes.
Figure 2 shows how the factor e−M varies with the value of the rms displacement of the absorber atoms perpendicular to the surface, expressed both in terms of the rms value of δp but also in ångström units for the specific cases of (111) Bragg reflections from Cu, Ag and Au. Clearly, the approximations underlying the Debye–Waller factor (notably of harmonic vibrations) break down at the largest values of the displacements shown in the graph, but this simple calculation serves to demonstrate that only unreasonably large vibrational amplitudes would allow one to attribute fco values below ∼0.6–0.7 to thermal vibrations.
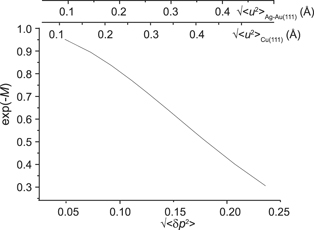
Figure 2. Variation of the coherent fraction attenuation factor, e−M due to displacements of the absorber atoms in the standing wave, as a function of the rms displacement in terms of the coherent position parameter but also in Å for (111) Bragg reflections from Cu, Ag and Au.
Download figure:
Standard image High-resolution imageOf course, low values of fco could arise not from some symmetric distribution of atomic heights, as addressed by a Debye–Waller factor, but from the contributions of several coexisting discrete heights. To understand this possibility a little more clearly it is helpful to use a graphical representation of equation (1) based on an Argand diagram, in which individual vectors have a length f(z) and a direction determined by the phase angle 2πz/d leading to a resultant vector of length fco and phase angle 2πp [12]. Figure 3(a) shows this basic representation of the coherent fraction and position, while figures 3(b)–(d) show the consequences of the simple situation in which two different heights are occupied with equal probability. Figure 3(b) shows the case in which the two heights differ by a small amount, relative to the inter-plane spacing, d. The resultant vector has a direction corresponding to the average of the two contributing heights,

while the coherent fraction decreases as the difference in the two contributing heights increases

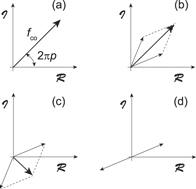
Figure 3. (a) Vector representation in an Argand diagram of the coherent fraction fco and coherent position p. (b)–(d) show, in the same representation, the resultant vector (bold) arising from two equally occupied components with different separations of the component p values.
Download figure:
Standard image High-resolution imageNotice, though, that if the difference in the two contributing heights, Δz, falls in the range d/2 < Δz < d this simple average of equation (4) must be modified, as shown in figure 3(c). Moreover, if Δz = d/2, the coherent fraction becomes zero (figure 3(d)); such a structure could be perfectly ordered but have a value fco = 0, highlighting the fact that it is misleading to regard the coherent fraction simply as 'an order parameter'. Figure 4 shows how the coherent fraction varies for this simple case of two equally occupied absorber heights as a function of Δz/d. This dependence is, of course, periodic; from the point of view of the XSW technique, a value of Δz/d of unity is equivalent to a value of zero, or indeed to any other integral value. The value of p corresponds to a height relative to the nearest extended Bragg plane
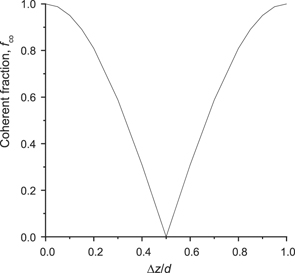
Figure 4. Variation of the coherent fraction resulting from two equally-occupied absorbed heights as a function of the difference in these heights, normalised to the spacing of the Bragg planes.
Download figure:
Standard image High-resolution imageEvidently, a low value of fco does not necessarily reflect poor order, nor does the value of this parameter decrease continuously as the height difference between contributing absorbers increases. Of particular importance is that if the origin of the low value is co-occupation of two or more distinct different heights, the associated value of p does not correspond to the (unique) height of the absorbing atoms. On the other hand, in the case of adsorbed molecules that are essentially planar and lying flat on a surface, a low value of fco for a subset of the atoms within the molecule can provide valuable information on an asymmetric modification of the molecular conformation, which would be missed if the low coherent fraction were to be ignored.
However, low values of fco in investigations of this type of molecular adsorption are often taken to imply that part of the surface is 'disordered', the implication being that this disordered part contributes a coherent fraction of zero, so that the associated value of the coherent position can be taken to reflect the true (single) height of the absorber atoms. It is instructive to consider what type of disorder could give rise to this effect. These molecules generally form well-ordered two-dimensionally periodic structures, although there are likely to be some regions of the surface with poorer lateral ordering. If the molecules in these areas also retain a flat-lying orientation, the difference in height of these molecules from those in the ordered regions is likely to be small (no more than ∼0.1–0.2 Å), arising from a different local registry to the underlying substrate. Indeed, if the ordered overlayer is incommensurate, small height variations within the ordered regions will arise for the same reason, though such variations are often very small, e.g. [13]. Figure 2 provides an estimate of the consequences of these static height variations providing that they follow, at least approximately, the Gaussian distribution assumed to derive the Debye–Waller factor; rms variations in the range up to ∼0.2 Å could reduce the coherent fraction by, at most ∼15%–20%. More significant would be the effect of a large tilt of the molecular orientation or a twist of the molecular conformation. Indeed, these effects have been proposed in some NIXSW studies to account for reduced coherent fractions (e.g. [14–16]); these correspond to specific examples of two or more distinctly different atomic heights being present in a structure with well-defined relative occupancy, and are potentially a proper and potentially valuable interpretation of the data. One may expect the measured value of p to be some weighted average of the several contributing heights, albeit with the caveat described above (e.g. figure 3(c)) for situations in which the contributing heights vary by between d/2 and d. Another example of 'partial disorder' could correspond to small regions of tilted molecules, perhaps at surface steps or on nano-facets. These regions would have a reduced value of fco but also a different value of p from that of the well-ordered lying-down areas, so the combined value of p will not correspond to the true value of the well-ordered areas alone.
Evidently, to add a truly incoherent (disordered) component, that does not cause p from the total surface to differ from the true height of the ordered region above the surface, one requires disorder perpendicular to the surface. This can arise from molecular multilayers if, as is likely, the molecular interlayer spacing in these regions differs from the substrate interlayer spacing, d, that determines the Bragg plane spacing (and thus the period of the standing wave). A sufficiently large number of such layers would ultimately lead to zero coherent fraction, but in a situation in which the intention was to grow only a single layer (the most common type of study that has been performed) one is only likely to have small areas of two- or three-layer islands; these areas would probably have a reduced (but non-zero) coherent fraction, but would also have a coherent position that differs from that of the monolayer. Adding this component to the total signal will thus lower the overall coherent fraction, but also yield a coherent position that is not a true reflection of the adsorption height of the monolayer.
In order to illustrate this point further we consider two specific examples. One example, from the field of single adatoms on oxide surfaces, is of Ag on Fe3O4(001). In our first investigation of this system [17] a comparatively low coherent fraction (fco = 0.66 ± 0.03), for the Ag adatoms, was assumed to indicate the presence of a minority Ag cluster species on the surface. These clusters were assumed to have a uniform atomic distribution within the standing wavefield such that, if it were possible to measure the XSW of the clusters alone, they would present a coherent fraction of 0. If this were to be true, the measured coherent position of the combined signal from the clusters and individual adatoms, would correspond to the coherent position of the adatoms alone; density functional theory (DFT) calculations were pursued based upon this assumption. However, a subsequent study [18], investigating the effect of exposure of CO to these Ag adatoms / clusters, revealed that this original assumption was not correct. The CO molecules, at room temperature, appeared to bind only to Ag adatoms, resulting in a significant chemical shift in the Ag 3d photoelectron binding energy of those adatoms. This allowed the XSW of the CO-coordinated Ag adatoms to be chemically resolved from the Ag clusters and the remaining Ag adatoms that were not bonded to CO molecules. Crucially, the measured combined coherent position of the species without coordinated CO differed significantly (by 0.04 ± 0.02/0.08 ± 0.04 Å) from that same species before the sample was exposed to CO. This clearly indicates that the 'disordered Ag' contribution does not have a zero coherent fraction, so including these atoms does influence the measured value of the measured coherent position, the value of which does not correspond the mean adsorption height of the Ag adatoms. While this difference may seem minor, it is of the same scale as the disagreement in adsorption height between the DFT calculations and the experiment.
The second example concerns a possible re-interpretation of the results of a published NIXSW study in which all the component coherent fractions were very low. Specifically, two oxygenated forms of pentacene, namely6,13-pentacenequinone with two oxygen atoms per molecule ('P2O') and 5,7,12,14-pentacenetetrone with four oxygen molecules ('P4O'), were adsorbed on Cu(111) and Ag(111) [19]. These are both nominally planar molecules although DFT calculations indicate that P2O may bend in the middle (the location of the two O atoms) when adsorbed on the Cu(111) surface in a single layer. The recorded coherent fractions for the O and C atoms for adsorbed P2O on Cu (Ag) were found to be 0.17 (0.22) and 0.16 (0.23) respectively, while for P4O the equivalent values to be 0.22 (0.37) and 0.23 (0.28). It is difficult to reconcile such low values (particularly for the two O atoms in P2O) with the evidence from scanning tunnelling microscopy (STM) that the two molecules lie flat on both of these surfaces. The fact that all the coherent fractions are so low would, on the basis of the foregoing discussing, lead one to consider the possibility that not all the adsorbed molecules were in a single monolayer. The authors present XPS data indicating that true multilayers were not present in these measurements, but this does not necessarily exclude the possibility of partial or complete bilayers. For example, tetraphenyl porphyrin adsorbed on Cu(111) has a well-established bi-layer 'checkerboard' structure that shows only minor differences in the observed XP spectra from that of a sub-monolayer coverage [20].
In order to assess the impact of such bilayers on the NIXSW one needs a reasonable estimate of the spacing to be expected for the stacked planar molecules, and DFT calculations for P4O report a value of 3.14 Å [21]. This corresponds to 1.51dCu(111), i.e. almost exactly a half-integral value of the Cu(111) Bragg plane spacing, so a complete bilayer would lead to a coherent fraction of essentially zero, as in the example of figure 3(d); on Ag(111) this intermolecular layer spacing corresponds to 1.33dAg(111), so a perfect bilayer would lead to a coherent fraction of ∼0.5 on Ag(111). Thus the presence of such a second layer could explain not only the low coherent fractions on both surfaces, but also the slightly higher coherent fractions found on Ag(111). Moreover, while, on Cu(111), the fact that the molecular interlayer spacing is almost exactly a half-integral number of the underlying Bragg plane spacing, would lead to a coherent position that would actually correspond to the true height of the first molecular layer above the surface (see figure 5(a)), this would not be true on the Ag(111) surface. Figures 5(b) and (c), and the animated figure S1 (https://stacks.iop.org/NJP/22/113012/mmedia), show the outcome of a similar partial bilayer in which the intermolecular layer spacing is slightly less than (figure 5(b)) and slightly more than (figure 5(c)) this half-integral number of Bragg plane spacings. In these situations the resulting coherent position is very different from that of the first layer alone, so the resulting measured coherent position is very sensitive to the exact value of the intermolecular layer spacing.

Figure 5. Argand diagram representation of the coherent position and fraction resulting from a partial bilayer in which the bilayer spacing is (a) exactly a half-integral number of Bragg plane spacings, (b) slightly less and (c) slightly more than a half-integral number of Bragg plane spacings.
Download figure:
Standard image High-resolution imageTable 1 summarises the effect of these different sources of coherent fraction lowering. This leads to two general conclusions:
- (a)That it is difficult to identify a mechanism that is likely to lead to 'disordered regions' influencing only the measured coherent fraction, and not leading to a different coherent position from that which would be obtained from the ordered regions alone.
- (b)As a result of this, the coherent position obtained from NIXSW measurements yielding low coherent fractions (i.e. less than ∼0.75) would practically never correspond to a true value of a single atomic height in the well-ordered parts of the surface.
Table 1. Summary of different processes that can reduce the coherent fraction and their implications.
| Origin | Magnitude of fco reduction | Effect on p |
|---|---|---|
| Thermal vibrations in substrate | ∼5% | None |
| Thermal vibrations of absorbers | <20% | None if the vibrations |
| are harmonic | ||
| Static variations in height | <∼15% | p true indication of weighted |
| due to incommensuration | average height | |
| Disordered regions with | <∼15% for disordered | p will differ slightly from true |
| height variations | fraction only | value of ordered regions |
| Two or more discrete | Could lead to values | p may give weighted average of true heights but |
| different atomic heights | as low as zero | specific structural models of the different heights |
| could be related to the reduced value of fco | ||
| Partial molecular bilayers | Could lead to values | p likely to differ significantly |
| or multilayers | as low as zero | from true value for monolayer |
The clear moral here is that measured coherent positions corresponding to molecular heights above a surface should never be reported without also providing coherent fractions, and low coherent fractions should not be simply brushed aside as due to 'disorder'. In fact original reports of NIXSW measurements do seem to invariably include values of coherent fractions, but very low values are frequently reported but not commented on in any detail. What greatly exacerbates the problem, however, is when later publications extract only the atomic heights inferred by the coherent positions with no regard for low associated coherent fractions. In this regard, the recent review of very many of these measurements [22] provides an example of precisely this problem. The review contains a potentially useful bibliography of all the published experimental NIXSW studies, but table II of this paper lists only the coherent positions, converted to molecular heights in ångström units, for this large number of published NIXSW papers by many authors; no associated coherent fraction values are reported and no caveats are expressed to highlight those results with low, and in some cases very low, coherent fraction values, as highlighted in our example above [18]. The seriously misleading implication is that these values are true molecule-substrate heights for these adsorption systems. From personal experience the authors are aware of computational scientists who have spent considerable time and energy trying (and inevitably failing) to reproduce the structures implied by such reported molecular heights, from measurements that, on closer inspection of supplementary information, had associated fco values of 0.2 or less.
3. Coherent fractions in XSW triangulation
While low coherent fractions certainly cause us to question the validity of concluding that the coherent position corresponds to the mean adsorption height, careful consideration of the origin of both the coherent fraction and coherent position can lead to significantly greater scientific insight. This is seen most clearly in the application of NIXSW to triangulation studies, in which quantitative interpretation of a coherent fraction is a key component in determining the lateral adsorption site of adsorbates. The use of only Bragg planes parallel to the surface provides information on the height of the molecular atoms above the surface, but information on the lateral registry can be obtained using Bragg planes canted out of the surface plane. Figure 6(a) provides a schematic diagram of the geometry of one example of this approach that has been used in a significant number of cases in the past. In this case the sample is a fcc (111) surface and in addition to taking (111) NIXSW measurements at normal incidence to the surface, additional measurements are made at normal incidence to one of the sets of  planes at an angle of 70.5° to the surface. The perpendicular distance from an absorbing atom to these canted planes can yield a coherent position that determines the local lateral site of the absorber atom. In particular, this parameter clearly distinguishes between the three alterative adsorption sites that share the full 3m symmetry of the substrate, namely atop, hcp hollow (atop a second layer atom) and fcc hollow (atop a third layer atom), as is clearly shown in figure 6(a). However, if the absorbing atom is not in one of these high symmetry sites, the measurement necessarily averages over all other structural domains that are related to one another by all the symmetry elements of the substrate 3m point group. The consequence of this summation over multiple sites is that the coherent fraction is reduced, but by an amount that is related to the magnitude of the displacement of the adsorption site from one of the three high-symmetry sites (illustrated in the coherent fraction contour map of figure 6(b)).
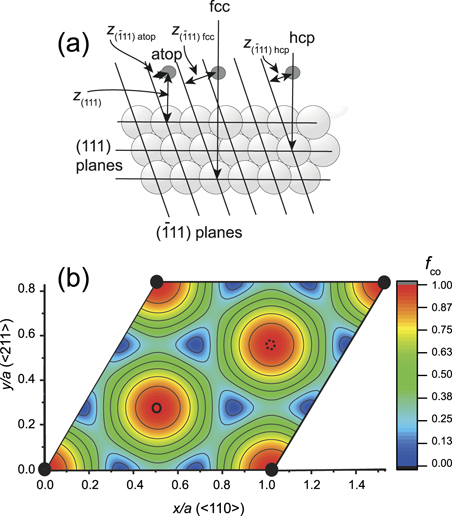
Figure 6. (a) Shows how NIXSW measurements at the (111) and  Bragg reflections can identify which of the three high-symmetry adsorption are occupied. (b) Shows a false-colour contour map of the coherent fraction obtained from
  NIXSW as a function of the absorber location over the substrate unit mesh. Distances are shown in units of a, the interatomic distance of the substrate atoms. Superimposed are top layer (filled circles), second layer (open circle) and third layer (dashed open circle) atom positions.
Download figure:
Standard image High-resolution imageIn this case for occupation of a single distinct low-symmetry site (and its symmetrically equivalent sites), the coherent fraction thus becomes an important structural parameter aiding the identification of this site. In particular, the coherent position identifies the nearest high-symmetry site, while the coherent fraction provides a measure of the magnitude of the lateral displacement from this site. This approach has been used successfully in several such studies (e.g. [23, 24]) Triangulation, therefore, provides a further example of the significant gain in scientific understanding that can be achieved by proper interpretation of the coherent fraction, showing how it can be applied to understanding atomic adsorption sites.
4. Precision of coherent positions at low coherent fractions
The final issue, to be considered when dealing with low coherent fractions, is the extent to which a low coherent fraction impacts on the resulting precision in the coherent position. The fit to an experimentally determined absorption profile is based on a sum of the ideal absorption profile to be expected from a coherent fraction of unity, and the reflectivity profile that describes the incoherent part. The coherent fraction defines the relative amplitudes of these two components. As the coherent fraction falls, the absorption profile becomes increasingly dominated by the reflectivity profile, so the fit becomes less and less sensitive to the shape of the small fraction of the coherent absorption profile. For low coherent fractions the resulting precision of the coherent position is degraded significantly, an effect not always reflected in reported values. Figure 7(a) shows a series of simulations of the NIXSW profiles to be expected for a small range of values of p, at values of fco between 0 and 0.3, together with the reflectivity curve and the profile for a coherent fraction of 1.0, for contrast. Plotted alongside these calculated absorption profile (solid lines) are simulated data with to which have been added statistical noise (+ symbols) at the 10% level, with respect to the intensity at off-Bragg energies (relative intensity of 1). Of course, real shot noise scales with the amplitude of the signal (a signal of N counts has Poisson noise level of √N), but, in practice, the intensity of the element-specific photoemission peak that constitutes the signal is typically much weaker than the underlying inelastically-scattered background. Thus, an approximately constant noise level across the NIXSW scan is often obtained. The chosen level of 10% is, from our experience, fairly typical of experimental data sets for these experiments, although both lower and higher noise levels are encountered. An animated figure (figure S2) showing all combinations of p for this range of fco is included in the supplementary information. These figures clearly show that, when the coherent fraction is high, even comparatively small differences in coherent position (∼0.05) can be easily discriminated. However, when the coherent fraction is low, even with only a modest noise level, the ability to differentiate coherent positions is increasingly degraded as the coherent fraction falls. Even significantly large differences in coherent position (see figure 7(b) and animated figure S3) can be quite difficult to distinguish with coherent fractions <0.3, while for coherent fractions <0.2, this becomes practically impossible.

Figure 7. XSW absorption profiles as a function of coherent fraction (fco) for (a) small and (b) large differences in coherent position (p). The simulated experimental data (+ symbols) are calculated using the specified fco and p, but with simulated noise added to both the intensity and energy scale. The noise in both the energy and intensity scale is normally distributed with a standard deviation of 0.1 (relative intensity) and 0.01 eV, respectively.
Download figure:
Standard image High-resolution image
5. Conclusions
The primary objective of this paper is to highlight the very real danger of disregarding low coherent fractions and assuming all coherent positions measured in NIXSW experiments at normal incidence to the surface to be a meaningful determination of the molecular height above that surface, independent of the value of the coherent fraction. By considering the type of disorder and structural modifications that can contribute to lowering the coherent fraction on a surface (table 1), we have shown that most origins of low coherent fractions result in coherent position values that are not true indications of the molecular adsorption height in any specific area of the surface. How low is low, in this context? Evidently thermal vibrations and molecular layer corrugation, either because of incommensuration, or of the presence of regions of lateral disorder, could perhaps lower the coherent fraction by ∼20%, possibly even slightly more. However, coherent fractions of ∼0.5–0.6 are difficult to reconcile with any type of 'disorder' within an overlayer, and for values <0.5 it seems certain that multiple atoms heights, differing by several tenths of an ångström unit, must be involved. Bearing in mind that the results of these NIXSW experiments provide the largest body of high-precision quantitative experimental data on molecular adsorption heights, which may be used by computational physicists and chemists aiming to improve our understanding of the adsorption, it is important that publications highlight this issue in reporting measured coherent position values that are accompanied by such low coherent fractions. Low coherent fractions can prove to be extremely valuable in helping to identify important aspects of a correct structural model, but if ignored they can lead to the proliferation of highly misleading structural data.