


Abstract
We first report the synthesis of supraparticles with a mean diameter of 130 nm consisting in a compact self-assembly of colloidal CdSe/CdS/ZnS nanocrystals encapsulated in a silica shell. This provides a system with robust optical properties such as a high quantum efficiency, a stable and Poissonian emission at room temperature. Additionally, enhancement of the photoluminescence decay rate through Förster resonance energy transfer is observed.
Export citation and abstract BibTeX RIS

Original content from this work may be used under the terms of the Creative Commons Attribution 4.0 licence. Any further distribution of this work must maintain attribution to the author(s) and the title of the work, journal citation and DOI.
1. Introduction
Semiconductor nanocrystals (NCs) with core-shell structures are chemically synthesized quantum dots, which exhibit a high photostability and a high radiative quantum yield at room temperature. In addition, their surface can be functionalized with various chemical moieties [1]. These features make them very attractive for a wide range of applications such as opto-electronic devices [2–4] (light emitting diodes [5], solar cells [6, 7], and lasers), biological labeling and bio-analysis [1, 8, 9], or single photon generation [10, 11].
As many organic and inorganic fluorophores, the emission intensity of single NCs switches between bright and dark periods [12] which are still subject of detailed analysis [13, 14]. Solving this drawback has represented a crucial aim for the use of single NCs. Several synthesis strategies were implemented such as the realization of a thick shell [15, 16], core/multi-shell structures [17]. They enabled the suppression of the heavy-tailed power-law distribution characterizing the duration of non-emitting periods and the resulting long off states. Yet, a residual flickering is still observed as well as gray periods [18].
Besides the improvement of the emitter, its electromagnetic environment can be tuned in order to enhance the radiative decay rate like in the pioneer work of Purcell [19]. This approach has been applied to NCs by many groups with external cavities [20] or metallic films [21, 22] and more recently by the encapsulation of the emitter in a plasmonic resonator [23].
Modification of a single emitter fluorescence can be also achieved when an ensemble of emitters is confined in a small volume (V ≪ λ3, where λ is the fluorescence wavelength). Interaction between indistinguishable dipoles can result in coherent collective effects such as supraradiance and superfluorescence [24]. When concentrated in a small cluster, whispering gallery modes showing lasing can also be observed [25, 26]. Resonant energy transfer between emitters is another possible process for NCs [27–30]. The realization of biosensors based on Förster resonance energy transfer (FRET) has been reported [31, 32]. FRET can play also a crucial role in light-emitting devices [33, 34].
In this paper, we first report the synthesis of colloidal supraparticles (SPs), which consists in encapsulating NCs into a silica shell. We analyze in detail their fluorescence properties at the single and ensemble emitter level. Spectroscopic measurements combined with time-resolved experiments show that the fluorescence of these nanoemitters is characterized by a suppressed blinking and also a very efficient FRET.
2. SPs synthesis and structural characterizations
2.1. SPs synthesis
Core/multi-shell CdSe/CdS/ZnS were synthesized by reaction of cadmium and zinc oleate with selenium or sulfur in octadecene [35] (see appendix
QDs were assembled into supraparticles following previously reported protocols with slight modifications [36–38] (see figure 1(a)). The supraparticles were coated with silica shell to ensure colloidal and structural stability [39] [thickness of 26 nm +/− 3 nm for the SP in figure 1(b)]. 12 nmol of QDs were precipitated with ethanol (EtOH), centrifuged, and re-dispersed in 1 mL of chloroform. This solution was added to 3 mL of dodecyl(trimethyl)ammonium bromide 20 mg mL−1 and mixed by vortex for 30 s. Stable oil/water micro-emulsion droplets were obtained. The chloroform was removed by heating the solution at 70 °C for 10 min. The QD micelle solution was centrifuged at 6000 g for 5 min. Then the supernatant was removed and the solid was re-dispersed in 3 mL of EtOH containing 7 mg mL−1 polyvinylpyrrolidone. The supraparticles were isolated by centrifugation at 6000 g for 10 min, and redispersed in 40 mL EtOH, 6 mL of H2O and 2 mL of NH4OH 27%. Fifty microliters of tetraethoxysilane were added. The solution was stirred for 20 min, centrifuged at 6000 g for 10 min and re-dispersed in 1 mL of EtOH.

Figure 1. Transmission Electron Microscopy images of supraparticles of quantum dots before (left) and after (right) coating with silica.
Download figure:
Standard image High-resolution image3. Fluorescence properties
3.1. Experimental setups
Solution-phase optical measurements were performed in hexane for isolated QDs and in ethanol for SPs. The absorption spectra of QDs and SPs were collected from 500 nm to 700 nm, using a UV-vis Shimadzu UV-1800 spectrophotometer. The photoluminescence (PL) decays and emission spectra were obtained using an FSP 920 Edinburgh Instruments spectrometer. PL quantum yields were measured using an integrating sphere.
The fluorescence of single SPs and NCs spin coated on a glass coverslip can be collected with a standard confocal microscope (Olympus IX 71, oil objective with a numerical aperture of 1.4). Pulsed optical excitation is provided by a pulsed supercontinuum laser (NKT Photonics SuperK EXTREME, λ = 485 nm, pulse duration ∼150 ps). The overall emission spectrum is first characterized by a spectrophotometer coupled to a CCD camera cooled at −90 °C. The confocal setup also enables to analyze the PL decay after wavelength selection. We use high transmission (>90%, bandpass ∼4 nm) filters instead of using the spectrometer which exhibits high losses (>70%).
At the ensemble or single emitter level, time-resolved experiments are carried out with an avalanche photodiode (τ-SPAD, MPD, 50 ps time resolution) connected to a data acquisition module (PicoHarp 300 module, Picoquant, 64 ps time resolution). The instrumental function response is about 200 ps.
4. Results-discussions
4.1. Quantum efficiency-blinking suppression
In thick-shell CdSe/CdS structures, the monoexcitonic state is well-known to recombine radiatively. Due to possible ionization of the NCs and the lower quantum yield (∼20%) of the trion [18], we measured a lower quantum efficiency of 60% for the NCs mother solution.
For SPs, we find a quantum efficiency of 40%. Precise quantum efficiency measurements are quite challenging and may be impacted by several artefacts. In particular, for the SPs, 40% is a floor value since scattering is observed for these ∼150 nm diameter nanobjects. Even though some non-radiative channels may be opened by the SPs synthesis, this value ensures that the NCs are not degraded during the SPs synthesis. Fluorescence intensity trace recorded on single SPs confirms the high photostability of the emitter (figure 2(a)). The intensity autocorrelation function is equal to 1 for delays ranging from 5 μs to 100 ms, which demonstrates that no intensity fluctuations occur at short time scales (figure 2(b)). This unitary value originates from the averaging of the emission of a large number of NCs in each SP.
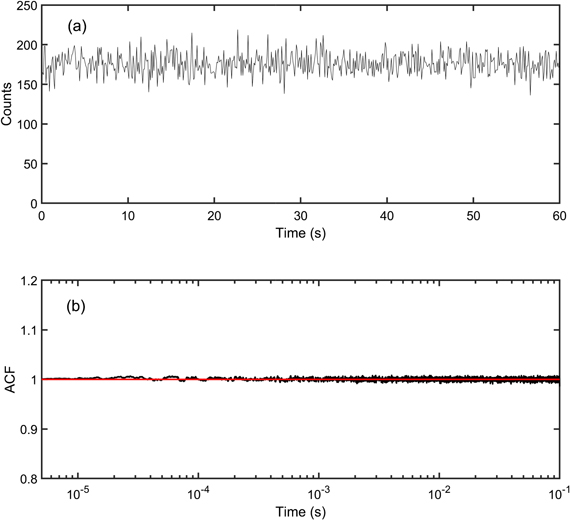
Figure 2. (a) Fluorescence intensity trace of a single SP (number of counts per time bin = 100 ms). (b) Normalized area of the peaks of the autocorrelation function of the intensity for a single SP.
Download figure:
Standard image High-resolution image4.2. Spectroscopic properties
The emission spectra of the NCs and SPs solutions as well as the NCs solution absorption spectrum were recorded (figure 3). The redshift of the SPs spectrum with respect to the NCs is a first signature of FRET between close NCs [27]. Indeed, when enclosed into SPs, the NCs with the smallest dimensions and the shortest emission wavelength ('blue' NCs) play the role of donor and tend to transfer their excitonic energy non radiatively to the biggest NCs ('red' NCs) that behave as acceptors. While the donor emission intensity is highly reduced, the acceptor fluorescence increases due to the higher excitation rate induced by FRET. The above mentioned redshift then results from the quenching of the blue NCs with respect to the red ones.
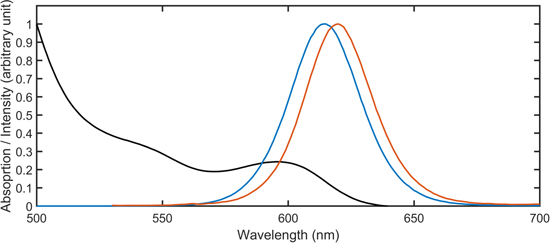
Figure 3. Absorption (black curve) and emission (blue curve) spectra for the NCs solution. Emission spectrum for the SPs solution (red curve).
Download figure:
Standard image High-resolution image4.3. Photoluminescence decay rate
Time-resolved fluorescence experiments provide a more systematic proof of FRET. As a first step, we measured the fluorescence decay rate of the NCs solution. The PL decay is well fitted by a three-exponential function (figure 4(a), black line). The shortest lifetime (τ1 ∼ 5 ns) corresponds to the trion lifetime, the intermediate (τ2 ∼ 22 ns) to the monoexciton lifetime and the longest lifetime (τ3 ∼ 60 ns) to radiative traps [40].
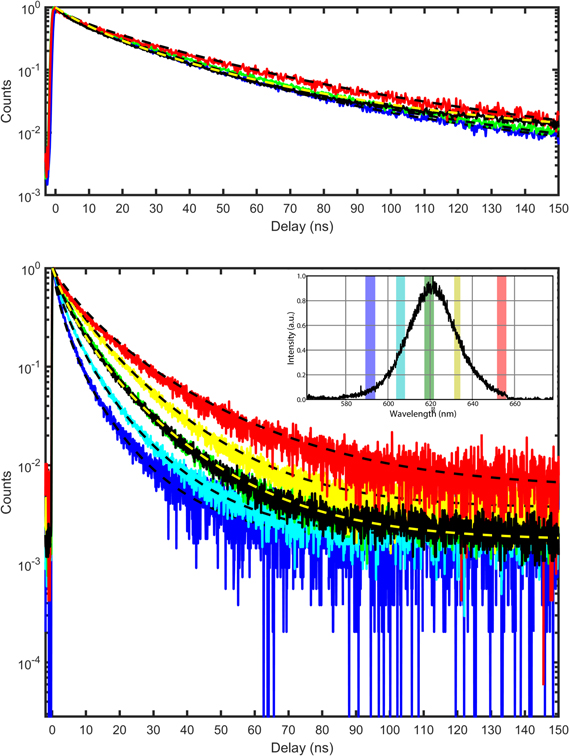
Figure 4. (a) Zoom (1–150 ns) of the PL decays for the NCs solution: overall solution (black line), filtering at 605 nm (blue line), filtering at 620 nm (green line), and filtering at 637 nm (red line). The dashed lines are triexponential fits except for the overall solution (log-normal fit with a mean lifetime τLN, yellow dashed line). (b) Zoom (1–150 ns) of the PL decays for the SPs solution. The values of the wavelength (590 nm, 605 nm, 619 nm, 633 nm and 647 nm) used for filtering are represented in the inset.
Download figure:
Standard image High-resolution imageWhen wavelength filtering is applied [figure 4(a), red, blue, and green lines], the PL decays appear very similar to the curve corresponding to the overall fluorescence (black line). In more detail, the lifetime components are very close, only their amplitudes slightly change (table 1). The weight of the shortest component increases a little at short wavelength, suggesting that the blue NCs spend more time in the ionized state.
Table 1. Fitting values corresponding to the curves of figure 4.
| NCs | 605 nm | 620 nm | 637 nm | Overall |
|---|---|---|---|---|
| A1 | 0.33 | 0.32 | 0.25 | |
| A2 | 0.60 | 0.61 | 0.58 | |
| A3 | 0.07 | 0.08 | 0.17 | |
| τ1 (ns) | 5.0 | 5.2 | 4.6 | |
| τ2 (ns) | 21.1 | 21.7 | 22.2 | |
| τ3 (ns) | 64.0 | 62.2 | 57.4 | |
| τLN (ns) | 24 |
| SPs | 590 nm | 605 nm | 619 nm | 633 nm | 647 nm | Overall |
|---|---|---|---|---|---|---|
| τLN (ns) | 4, 7 | 6, 1 | 8, 3 | 10, 5 | 14, 3 | 8, 2 |
Since the size dispersion of the core NCs is lower than 5% and the dispersion of the core-shell NCs is lower than 20%, all the single NCs exhibit the same fluorescence lifetimes for the trion and monoexcitonic states. When diluted in the stock solution, they behave as independent emitters inserted in an homogeneous medium (hexane), without any coupling between them.
Experiments concerning SPs PL decay were performed on single particles in order to get rid of a possible inhomogeneous broadening coming from the size dispersion of the SPs (diameter = 130 nm ± 38 nm) and to highlight the effect of NCs aggregation itself (figure 4(b)). In contrast with the results obtained with the NCs solution, the wavelength selection substantially changes the shape of the decay. The PL decay is all the more faster as the wavelength is short. Emission from the 'blue' NCs is quenched.
More quantitatively, the effect of FRET can be evidenced through the fits of the PL decay. At a given wavelength, due to room temperature operation and inhomogeneous broadening, the PL decay corresponds to the contributions of a continuum of NC sizes. In order to account for this distribution and extract a mean value of the excited lifetime, we fitted the PL decays by a log-normal distribution:

with:

where A is a normalisation constant, ΓLN = 1/τLN is the mean decay rate and ω is a dimensionless value describing the width of the distribution [it is defined further, see equation (6)]. The fits of the overall NCs solution and single SP emission show that the overall PL decay rate is 3 times higher for the SP (1/24 ns−1 with respect to 1/8.2 ns−1) (figures 4(a) and (b)). This increase first results from the modification of the refractive index of the medium surrounding the individual NCs (typically 1.8 [41] instead of 1.4 for hexane). Individual SPs are also deposited on a glass coverslip (with a refractive index close to 1.5) and are not in solution. The opening of non radiative channels corresponding to the small decrease of the QE may also reduce the lifetime.
More importantly, FRET also highly contributes to the PL decay rate modification. Wavelength filtering shows that the mean lifetime is three times shorter at 590 nm when compared to 647 nm. Let us consider the standard theory used to calculate the energy transfer rate between a donor and an acceptor in order to estimate the additional channels due to FRET. In the dipole approximation [29], we have:

where krad is the radiative decay rate of the donor, d is the donor-acceptor distance. R0 writes:

where η is the PL QE, κ = 2/3 corresponds to an average over the orientations of the donor and the acceptor, n is the refractive index of the medium (n = 1.8). FD(λ) and σA(λ) are respectively the normalized donor emission spectrum and the acceptor absorption spectrum. Finally, the energy transfer efficiency E is

From this model and taking into account the measured NCs absorption spectrum and an emission linewidth of 25 nm, we obtain a FRET efficiency about 60% for the 'blue' NCs emitting at 605 nm, and lower for NCs emitting at longer wavelengths (figure 5(a)). By performing small-angle x-ray scattering (SAXS) experiments (home made setup, 17 keV, 2D detectors), we found that the mean distance d between the NCs is equal to 7.6 nm which is consistent with interdigitation of their ligands (figure 6). For this compact assembly, considering that each NC is surrounded by 12 NCs, the theoretical enhancement of the decay rate of 'blue' NCs is around 2.6, a value consistent with the ratio of 3 between the experimental decay rates measured at 590 (1/4.7 ns−1) and 647 nm (1/14.3 ns−1).
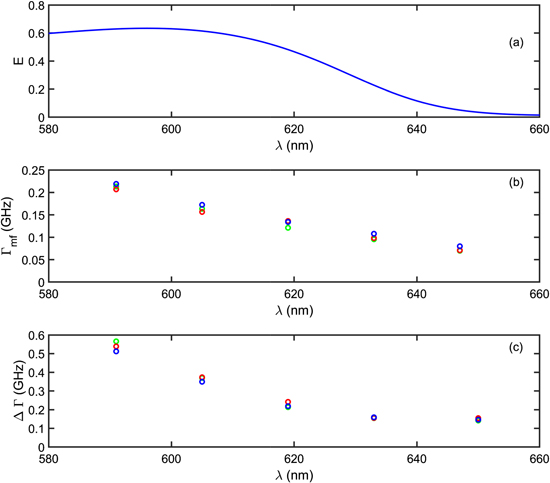
Figure 5. (a) Calculated energy transfer E versus the NC emission wavelength. (b) Mean decay rates obtained from log-normal fits for 3 single SPs as a function of the wavelength filtering. (c) The corresponding width of the log-normal distribution ΔΓ.
Download figure:
Standard image High-resolution image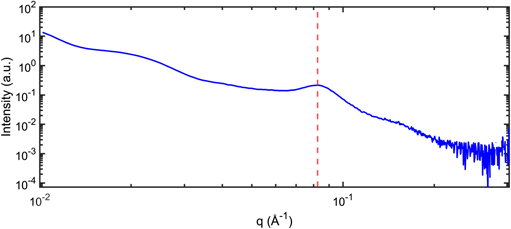
Figure 6. SAXS spectrum for the SPs. The red dashed line position provides the mean distance d = 7.6 nm between NCs ( ).
).
Download figure:
Standard image High-resolution image
In addition to the mean decay rate ΓLN, the log-normal fit also provides the width ΔΓ of the decay rates distribution using the ω value and defined by:

For three single SPs, figures 5(b) and (c) plot the values of decay rate and the width corresponding to the log-normal fits versus the filtered wavelength. As the wavelength decreases, ΔΓ as well as Γ increase. Qualititatively, for the 'red' NCs, the absence of FRET results in a sharp distribution while for the 'blue' NCs, the PL decay rate depends on the surrounding NCs and the magnitude of the FRET.
5. Conclusion
In conclusion, we have demonstrated the synthesis of very high quality SPs consisting of compact ensembles of colloidal CdSe/CdS/ZnS NCs. They present a high photostability, a high radiative quantum yield and a non-blinking fluorescence. The analysis of the PL spectra and time-resolved experiments evidence FRET between the packaged NCs. The efficiency of the FRET is due to the high compactness of the aggregates as demonstrated by SAXS measurements. Finally, all these characteristics and their dimensions make these structures very attractive for applications such as biosensing or realization of optoelectronics devices.
Acknowledgments
We thank Olivier Taché for performing the SAXS experiments. This work is supported by the Agence Nationale de la Recherche in the framework of the GYN project (Grant No. ANR-17-CE24-0046).
Data availability
The data appearing in Figs 2, 3, 4, 5 and 6 are available in Zenodo with the identifierdoi:10.5281/zenodo. 816755.
Appendix A:
A.1. Chemicals
Selenium powder (Se) was purchased from Strem, 1-octadecene (ODE) and oleic acid (OA) were purchased from Aldrich, cadmium myristate powder (Cd(myr)2) [42], precursor solutions of cadmium oleate (Cd(OA)2 0.5 M in ODE), zinc oleate (Zn(OA)2 0.5 M in ODE) and sulfur in 1-octadecene (S-ODE 0.1 M in ODE) were prepared as described previously [43].
A.2. Synthesis of CdSe core nanocrystals
CdSe nanocrystals were synthesized by a procedure slightly modified from Cao et al [35]. For a typical reaction, the mixture of 0.522 g of Cd(myr)2, 0.036 g of Se and 48 mL of ODE in a three-neck flask was degassed under vacuum during 30 min then heated to 240 °C during 6 min under argon flow. At the end of the reaction, 15 mL of OA was added to this system to ensure the colloidal stability. This reaction mixture was cooled down to room temperature, precipitated with ethanol and dispersed in 10 mL of hexane. Typically, this reaction generates CdSe nanocrystals of about 3 nm in size.
A.3. Synthesis of CdS shell growth
The mixture of 10 mL of previously synthesized CdSe, 10 mL of Cd(OA)2 and 50 mL of ODE was loaded in a three-neck flask and degassed under vacuum during 30 min. It was heated to 230 °C under argon flow and 23 mL of S-ODE was added by dropwise addition (0.15 mL min−1) into the mixture. At the end of the reaction, ethanol was added into the three-neck flask at 80 °C to facilitate QD extraction during centrifugation and the solid was redispersed in 20 mL of hexane.
A.4. Synthesis of ZnS shell growth
The mixture of 20 mL of previously synthetized CdSe/CdS, 10 mL of Zn(OA)2 and 50 mL of ODE was loaded in a three-neck flask and degassed under vacuum during 30 min. It was heated to 250 °C under argon flow. At 160 °C we started the dropwise injection (0.15 mL min−1) of S-ODE into the mixture. At the end of the reaction, ethanol was added and the reaction mixture was precipitated and dispersed in 30 mL of hexane. Typically, this reaction generates CdSe/CdS/ZnS nanocrystals of about 7 nm in size.