


Abstract
The effect of multiple small-angle Coulomb scattering, or intrabeam scattering (IBS) is routinely observed in electron storage rings over the typical damping time scale of milliseconds. So far, IBS has not been observed in single pass electron accelerators because charge density orders of magnitude higher than in storage rings would be needed. We show that such density is now available at high brightness electron linacs for free-electron lasers (FELs). We report measurements of the beam energy spread in the FERMI linac in the presence of the microbunching instability, which are consistent with a revisited IBS model for single pass systems. We also show that neglecting the hereby demonstrated effect of IBS in the parameter range typical of seeded VUV and soft x-ray FELs, results in too conservative a facility design, or failure to realise the accessible potential performance. As an example, an optimization of the FERMI parameters driven by an experimentally benchmarked model, opens the door to the extension of stable single spectral line emission to the water window (2.3–4.4 nm), with far-reaching implications for experiments in a variety of disciplines, ranging from physics and chemistry to biology and material sciences, and including nonlinear x-ray optics based on the four-wave-mixing approach.
Export citation and abstract BibTeX RIS

Original content from this work may be used under the terms of the Creative Commons Attribution 4.0 licence. Any further distribution of this work must maintain attribution to the author(s) and the title of the work, journal citation and DOI.
1. Introduction
Intrabeam scattering (IBS) is the multiple small-angle Coulomb scattering of charged particles in accelerators. It can drive a growth in time of transverse emittance and uncorrelated energy spread, proportional to the beam charge density. Its relevance to the development of storage rings has recently been recognized with the Wilson Prize to A Piwinski, J D Bjorken and S K Mtingwa [1]. The theory of IBS is described in a number of publications [2–9]. Because of the computational expense required to implement the full theory in particle tracking codes, high energy approximations have been derived [10–14]. In particular, Bane [15] modified the Piwinski theory [3] at high energies and showed its equivalence to the theory described by Bjorken and Mtingwa [5]. However, evidence of IBS in single pass electron accelerators has, to the authors' knowledge, never been reported. The reason for this is that, if the beam is not stored in the accelerator for an extremely long time, a very high charge density would be required to make IBS apparent.
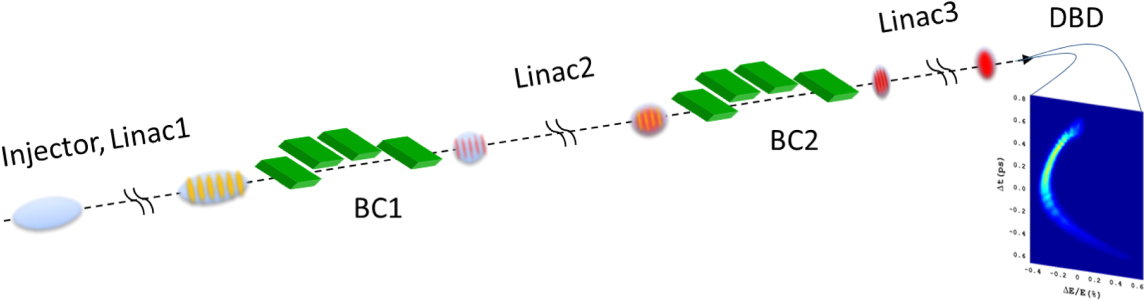
An analytical and numerical evaluation of the IBS effect in the linac coherent light source (LCLS) was presented in [16, 17], respectively. Here we show experimentally that the charge density of high brightness linac beams driving, e.g., short wavelength free-electron lasers (FELs) [18], is large enough for IBS to become a significant effect. Specifically, we demonstrate this in the FERMI linac. A sketch of the beam line and a description of the experiment is shown in figure 1.
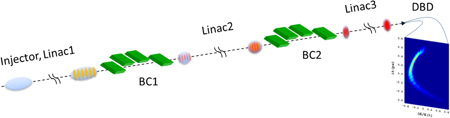
Figure 1. Cartoon of the FERMI linac with two bunch compressors (BC1, BC2) and a representative measurement of the beam longitudinal phase space at the DBD. The BCs are independently tuneable in bending angle from 0 to 0.1 rad. The colour of the energy modulation, from yellow to red, is indicative of the modulation depth (e.g., before and after BC1). As the beam propagates and the charge density increases by virtue of bunch length compression, IBS makes the uncorrelated energy spread to grow, so smearing the modulations (e.g., in linac 2). At the end, IBS contributes to the suppression of short wavelength modulations by energy Landau damping (e.g., in linac 3).
Download figure:
Standard image High-resolution imageFELs have become invaluable tools for the exploration of matter, especially by virtue of their high brilliance [19–21]. The intrinsic spectral bandwidth is in the range 0.05%–0.1% for self-amplified spontaneous emission FELs (SASE) [22, 23], and narrower in self-seeding schemes [24–26]. However, stable longitudinal coherence, i.e., a reproducible single spectral line, is produced only at externally seeded VUV FELs [27–29] operating in so-called high gain harmonic generation (HGHG) [30] or echo-enabled harmonic generation (EEHG) [31, 32] schemes. The capability of extending stable longitudinal coherence to x-ray photon energies is highly sought after in the light source community, because it would enable new classes of experiments in a variety of disciplines, ranging from physics and chemistry to biology and material sciences, and including nonlinear x-ray optics based on the four-wave-mixing approach [20, 33, 34]. Nevertheless, this important potential is to date prevented by bandwidth broadening at wavelengths approaching the so-called water window (between 300 eV and 500 eV). Recent experiments [35, 36] confirm that the reduced photon brilliance is primarily due to the electron beam microbunching instability (MBI) [37, 38]. This is a broadband, space charge-induced amplification of small initial non-uniformities of the charge distribution. The amplification, or gain, depends on the specific configuration of the accelerator and of magnetic compressors [39]. MBI reveals itself as large amplitude μm-scale modulations in the final electron beam longitudinal phase space, which translate into large slice energy spread (SES) [40]. Since the instability gain has a large bandwidth, it is able to capture and amplify modulations (e.g., from several μm's to few 100's of μm wavelength) in the initial beam distribution [41]. Bunch length compression, typically by a factor 10–100, blue-shifts the initial modulation to the scale of the FEL cooperation length [42] (e.g., in the sub-μm to few μm range for VUV and soft x-rays). The mix of frequencies induced by MBI on the one side, and by the FEL coherent emission on the other, generates shot-to-shot fluctuations of the multi-line FEL spectrum, as well as the appearance of sidebands [43].
The instability is in some cases mitigated through energy Landau damping: in the low energy region of the linac, a laser heater [44] increases the beam uncorrelated energy spread to ∼5–50 keV level. In some cases, the laser heater was shown to improve the FEL spectral brilliance by up to a factor 3 [45–47]. Nonetheless, the laser heater power is deliberately limited because an excessive beam heating would also suppress the FEL emission, so that typically MBI is not fully suppressed. It turns out that laser heater is not a universal and definitive solution to the generation of stable longitudinal coherence in x-rays.
It is also clear that a deep understanding of MBI in high brightness linacs is essential for the design and operation of future longitudinally coherent x-ray facilities. Massive beam dynamics simulations [17] and a semi-analytical formalism were found to agree with data from the LCLS [40]. However, the former approach is computationally intensive (see also [48, 49]) and not suitable for the optimization of an FEL architecture. The latter suffers from a major uncertainty on the initial beam uncorrelated energy spread, typically in the ∼1–4 keV range [50, 51]. As shown below, such uncertainty can lead to unrealistic predictions when the instability gain is high.
We demonstrate that inclusion of a revisited IBS theory for single pass systems in the MBI model, substantially modifies the instability gain through energy Landau damping, and that the IBS-induced uncorrelated energy spread is essential to show agreement between predicted and measured SES in the typical parameter range of seeded soft x-ray FELs. By taking advantage of its semi-analytical nature, the proposed MBI-plus-IBS model was used to investigate upgrade scenarios of the FERMI FEL for stable single line emission down to 2 nm, as a function of initial beam parameters, compression scheme and beam heating level. Since existing and planned VUV and soft x-ray seeded FEL facilities [26, 29, 34, 52–56] lie in the same range of parameters of the FERMI upgrade (100's pC bunch charge, 1 to few GeV's beam energy, ∼kA peak current, ∼0.01% SES), our findings are expected to have a general validity and a widespread impact.
2. Theoretical model
2.1. Intrabeam scattering
In the following, the increase of relative uncorrelated energy spread (σδ) by IBS is calculated along the beam line according to Bane's approximation [15] and applied to a round beam, i.e., equal emittances ɛx = ɛy, beam sizes σx = σy, and angular divergences  . Beam size and divergence is calculated as function of average betatron functions βx = βy along consecutive linac sections. Bane's model for the energy spread growth rate in the absence of synchrotron oscillations is reported here for the reader's convenience:

for non-dispersive sections, and

for dispersive sections.
Equations (1) and (2) apply to beams whose longitudinal momentum spread in the beam rest frame is much smaller than the transverse one, which is typical at high brightness electron linacs. In the previous expressions, re is the electron classical radius, Ne is the number of electrons in a bunch, γ is the Lorentz factor for the beam mean energy, εn the transverse normalized emittance, σz the rms longitudinal beam size. The quantities [log] and σH are:

with bmax and bmin the maximum and minimum impact parameter of IBS scattering events, respectively, Hx and Hy the so-called dispersion-H functions.
According to Piwinski [3], bmax and bmin are inversely proportional to the minimum and maximum scattering angle, respectively:

where ϑmax < π. The choice of bmax is still ambiguous in the literature. For example, in [8] we find  , where ρ is the average of the normalized particle density, and υk is the kth eigenvalue of the beam spatial matrix xixj. For round beams such as the ones under consideration here, the choice bmax ≈ σx has physical sense because it garantees a range of scattering angles sufficiently large (see below), which would otherwise collapse to ∼0 for
  . We also find that bmax ≈ σx is adopted in [3], and that it satisfies the prescription
  recalled in [6], with the Debye length λD > σx in our range of parameters.
Raubenheimer [57] recommended to limiting the maximum scattering angle to discard single scattering events. These cause tails on the beam distribution, which may heavily bias the calculation of the IBS effect in the bunch core. We revise this prescription, initially formulated for storage rings, by replacing the typical time scale of a damping time by the time taken by the beam to travel for a length L along the linac (or part of it):

with u, v, w optical functions defined in [57]. The derivation of qmax in [57] from the comparison of inverse scattering rate and damping time, implies a numerical factor in front of the integrals in the expression for qmax which appears already in the growth rate. Since we are considering longitudinal motion without synchrotron oscillations, we use the appropriate factor from the growth rate for unbunched beams [3]; the factor in equation (5) is therefore 2 times larger than in [57].
The maximum scattering angle can be calculated from equation (5) in the approximation ϑmin ≪ ϑmax ≪ 1:

We end up with an expression of the Coulomb logarithm, which applies to the beam core in a single pass accelerator:

Typical values of the scattering angles in the FERMI linac are of the order ϑmin ⩽ 10−6 rad, ϑmax ∼ 10−4 rad, and ![$\left[\mathrm{log}\right]\approx 6$](https://content.cld.iop.org/journals/1367-2630/22/8/083053/revision2/njpaba572ieqn9.gif) . In general,
. In general, ![$\left[\mathrm{log}\right]\approx 5-8$](https://content.cld.iop.org/journals/1367-2630/22/8/083053/revision2/njpaba572ieqn10.gif) in 1–10 GeV linacs, so confirming a weak dependence on the beam energy.
in 1–10 GeV linacs, so confirming a weak dependence on the beam energy.
It is worth stressing that the Piwinski–Bane formalism—see equations (1) and (2)—assumes a Gaussian distribution of particles in position and angular divergence, as it is typical of electron beams at equilibrium in storage rings. This approximation remains good enough for ultra-relativistic electron beams generated in photo-injectors and successively accelerated in linacs, as long as the beam transverse spatial and angular distribution is controlled by quadrupole magnets along the accelerator. In FERMI, the charge distribution is optically-matched to predetermined Twiss parameters, in dedicated and consecutive diagnostic regions located at the exit of the injector (where our model starts being applied), across the first magnetic compressor, and at the linac end [58, 59]. This guarantees that matching is preserved all along the accelerator. The matching process is based on a model that relates the second order momenta of the measured charge distribution in the transverse phase space (x, x') to the standard deviations (σx, σ'x) of a two-dimensional Gaussian distribution [60]. As a result, actual beam profiles, sampled by screens along the linac, are well matched by Gaussian distributions and confirm the applicability of the Piwinski–Bane formulae.
We are now ready to calculate the energy spread induced by IBS along different regions of the accelerator. The solution of equation (1) for a non-dispersive straight section of length Δs and at constant energy γ0 is found by integration, by imposing the initial value σδ (γ0; 0) = σδ,0:

When the beam mean energy grows linearly with Δs from γ0 to γ, such as inside an accelerating cavity, we introduce the accelerating gradient G in eV m−1 so that  , with me the electron rest mass, and thereby
  . With this change of variable, equation (1) can be rewritten as:

where we defined:

and βx is the average value of the betatron function along the accelerating section. The solution of the differential equation for σγ in the rhs of equation (9) is of the form  , with c1, c2 constants and c1 is found by imposing the initial condition σδ (γ0; 0) = σδ,0. Since σδ = σγ/γ, we obtain:

Equation (2) for a dispersive section at constant energy can be rewritten as:

with h = γHx/ɛn and Hy = 0 for dispersive motion in the horizontal plane only. We solve equation (12) with the separation of variables in implicit form:

and thereby:

where σδ (γ0; 0) = σδ,0 is the relative energy spread at the entrance of the dispersive region. The function f is of the form  . For h→ 0, equation (14) reduces to equation (8), as expected.
Linacs driving FELs commonly accommodate four-dipole horizontal chicanes for bunch length compression (see figure 1). In such an insertion, the bunch duration is almost unchanged up to the second dipole magnet, and reaches its minimum duration at the exit of the third dipole. We therefore model the IBS effect in a chicane in two steps: the beam is assumed to be uncompressed in the first half of the chicane, and fully compressed in the second half. Consequently, the ∼1% correlated relative energy spread imposed on the beam for magnetic compression, contributes to the energy-dispersed horizontal beam size in the second half of the chicane only, and the IBS effect is calculated according to equation (2).
In summary, the growth of σδ as due to IBS is calculated along the linac as a multiple-kick effect; each 'energy kick' is calculated according to equations (8), (11) and (14). The growth rate of the transverse emittances is at least two orders of magnitude smaller than the longitudinal growth rate, so that the IBS-induced growth of the transverse emittances is negligible for any practical purpose.
2.2. Microbunching instability
We modified the formalism introduced in [61] for the instability in the presence of CSR in magnetic chicanes, by including the effect of the longitudinal space charge (LSC) impedance averaged over the transverse beam sizes [62, 63]; the LH interaction is modelled as a function of the laser transverse size [64], and we retained low MBI gain terms. The SES at the linac end is calculated by integrating the CSR- and LSC-induced energy modulation, Δγ(λ). This is the product of the initial bunching factor b0(λ)—i.e., the Fourier transform of the initial current distribution with average value I0—properly amplified by the instability gain G(λ), and the LSC impedance ZLSC(λ) (for simplicity of notation, we consider hereafter LSC only, which also turns out to be dominant contribution to the total gain). The initial bunching is defined with a broadband shot noise-like spectral distribution of bandwidth Δν:

where e is the electron charge.
The LSC impedance per unit length and the gain, i.e., the ratio of final and initial bunching, are [63, 64]:

and

where Z0 = 376.73 Ω, IA = 17 045 A,  is the effective electron beam radius, I1, K1 are modified Bessel functions of the first kind, R56 the momentum compaction of the compressor, C the compression factor, k = 2π/λ the modulation wave-number, and σδ the relative uncorrelated energy spread at the entrance of the compressor. The resulting LSC-induced energy modulation amplitude is:

with  the LSC impedance integrated over the linac length. The LSC-induced RMS absolute energy spread is the integral of the modulation amplitude over the whole spectrum of modulations (or a large part of it). By substituting equation (15) into equation (18) we find:

We note that equation (19) agrees with equation H2 in [40]. The integration has been performed over the initial wavelength range 0.1–200 μm, where the gain and the energy modulation spectra are peaked at uncompressed wavelengths λ ≈ 10–50 μm in all the cases considered.
Equation (17) describes a linear regime of the instability, i.e., the final bunching factor is a linear function of the initial bunching factor [61] or, in other words, any amplification of an initial modulation translates into a modulation with null or little harmonic content [65]. Physically, the longitudinal phase space has to remain unfolded. An accurate analysis of the measurements, for example reported in [66], seems to confirm that picture. At the same time, the agreement a posteriori of measured SES with values calculated in the linear regime—shown in section 3—supports the assumption that a linear model is valid in this case.
The IBS-induced energy spread modifies the exponential term of the gain in equation (17), which physically represents energy Landau damping. Doing so, the gain at successive compression stages is diminished, with an overall mitigation of the instability. We show below that in configurations of relatively high gain, neglecting the IBS contribution to σδ can lead to unrealistic predictions of the gain, of the energy modulation and, in particular, of the final SES. The SES in equation (19), summed in quadrature to the unperturbed beam uncorrelated energy spread and to that induced by IBS, is our main observable. The systematic comparison of the SES predicted by the model with experimental data is discussed in the next section.
3. Model versus experiment
3.1. Diagnostic tools
Table 1 lists the main parameters of the experiment carried out at the FERMI facility and used in the model. The FERMI linac is sketched in figure 1. The beam longitudinal phase space was measured at the diagnostic beam dump (DBD) station by means of a vertical RF deflector (VRFD) located at the linac end and followed by a horizontal spectrometer magnet [67]. At the exit of the magnet, the beam is intercepted by a screen, whose horizontal and vertical physical axis is proportional, respectively, to particles' energy (through the dispersion function) and to arrival time (through the VRFD time-position calibration factor).
Table 1. Parameters of experiment at FERMI, for low and high bunch charge. All are measured quantities. Diagnostic resolutions were calculated on the basis of measured beam and machine parameters.
| 100 pC | 650 pC | Units | |
|---|---|---|---|
| Initial peak current | 18 | 60 | MeV A |
| Initial beam energy | 96 | 96 | |
| Beam energy at BC1 | ∼290 | ∼290 | |
| Beam energy at BC2 | 424–740 | 610 | MeV |
| Final beam energy | 713–754 | 900 | MeV |
| R56 of BC1 | −35, −42 | −42 | mm |
| R56 of BC2 | 0, −35 | 0 | mm |
| Compression factor | 31–45 | 11–19 | |
| Normalized emittance | 0.4 | 1.3 | μm m rad |
| <βx,y> along the linac | 7–30 | 7–30 | |
| Temporal resolution | 8–12 | 8–12 | fs |
| Energy spread resolution | 65–85 | 65–85 | keV |
Beam optics were matched in the DBD region in order to optimize the temporal and the energy resolution at the screen. The systematic error to the deviation of the measured SES from the effective value is due to the screen pixel size, to the beam non-zero vertical emittance ɛy, and to the VRFD-induced energy spread. The latter is due to the off-axis longitudinal electric field component sampled by deflected particles. Such spread of longitudinal momentum is correlated with the particle's vertical position inside the cavity, and thus with the bunch length. Its RMS value relative to the beam mean energy  , where
  is the beam central longitudinal momentum and c the speed of light in vacuum, evaluated at σz-distance from the bunch centroid, is [68]:

Measurements of the beam optics parameters, of the SES vs the deflector RF power attenuation factor, and the evaluation of the effective peak deflecting voltage, led to the estimated temporal and energy resolutions in table 1. σδ,VRFD is the dominant contribution to the energy resolution, where the VRFD length is L = 3.5 m, the operational effective peak voltage and RF wave vector are Vrf ≈ 19 MV and krf = 62.8 m−1, and the average vertical betatron function along the deflector is βy,VRFD ≈ 25 m.
The experimental values of SES reported in the following are averaged over 20 consecutive images collected at 10 Hz. At the high charge of 650 pC, a quadratic time-energy correlation appears in the phase space (so-called nonlinear energy chirp, see for example figure 1), due to longitudinal wakefields in the accelerator. In this case, the SES is defined as the minimum value of the energy spread measured along the bunch (i.e., in correspondence of null time-energy correlation). The associated current profile is usually flat. At the low charge of 100 pC, the energy chirp is dominated by a linear component. In this case, the SES is defined as the energy spread of the central slice, and the linear energy chirp is removed in the post-processing. For each slice, the local current level is also recorded.
For most of the recorded images, the SES is calculated as the standard deviation of a Gaussian, which is used to fit the energy distribution of each temporal slice. In some cases, a better fit is ensured by a flat top distribution, and the SES is therefore defined as raw RMS value. For all the images, the temporal duration of the slice is approximately 10 fs.
Representative images of measured longitudinal phase space for the BC1, BC2 and BC1 + BC2 compression scheme are shown in figure 2; the LH is turned off. Current profile and slice energy spread curves are also shown. The fragmentation of the phase space in the double compression case is indicative of much stronger MBI gain, in agreement with the model prediction (see later figure 5).
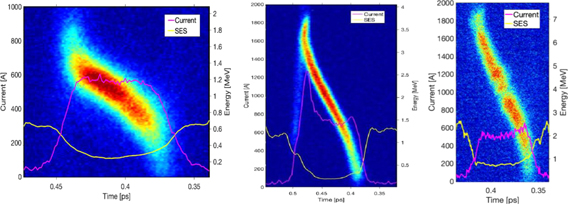
Figure 2. Representative experimental images of longitudinal phase space of a 100 pC charged bunch, for a total compression factor of ∼35 implemented (from left to right) with BC1, BC2, and BC1 + BC2. The beam was vertically deflected and measured at the DBD screen (see figure 1). The current profile (purple) and the SES along the bunch (yellow) are also shown in each plot. The laser heater is off in all cases.
Download figure:
Standard image High-resolution image3.2. Initial slice energy spread
The major uncertainty in our model is the initial value of the uncorrelated energy spread, σE,0, i.e., the uncorrelated energy spread at the exit of the linac photo-injector. Since its variation at keV level substantially modifies the model prediction, and since there is no direct measurement of σE,0 because of limited resolution, it has been treated in our model as a fitting parameter. That is, while keeping all other machine and beam parameters fixed and in adherence to the experimental settings, we scanned the value of σE,0, for the 100 pC and 650 pC bunch charge, in order to obtain a systematic agreement of the measured and the predicted SES over all compression schemes and compression factors. This procedure reproduces the final SES measured in figure 5 for the fitting value σE,0 = 0.9 keV at 100 pC, and σE,0 = 2.4 keV at 650 pC. It is a remarkable result the fact that a single value of σE,0 (per injector set up) satisfies all the diverse linac configurations.
To demonstrate that our fit for σE,0 is the only realistic solution, we conducted two independent checks. First, we calculated the SES without IBS, by selecting the value of σE,0 that, in this unrealistic picture, allows the predicted SES to collapse onto the measured one. A single value of σE,0 cannot be found in order to satisfy all the diverse compression schemes at 100 pC. Also, the values are far from those obtained when IBS is included in the model: in the absence of IBS, they result in the range 5.5–6.8 keV for 100 pC (vs 0.9 keV when IBS is included), and around 4.3 keV for 650 pC (vs 2.4 keV when IBS is included).
Second, we compared our expectations for σE,0 with the SES predicted by particle tracking at the exit of the FERMI injector. This is shown in figures 3 and 4. Tracking was performed with the 3D GPT code [69], which solves the particles' equation of motion starting from the Lienard–Wiechert retarded potentials. This approach promises an accurate prediction of the initial uncorrelated energy spread, in accordance, for example, with findings in [70]. However, IBS intended as a stochastic process was not included in the simulations. Still, the application of our model to the injector section estimates a net IBS-induced energy spread of ∼0.3 keV for both bunch charges. This has to be added in quadrature to the 0.9 keV and 2.4 keV assumed so far. Thus, the correction of IBS in the injector to the effective total energy spread is expected to be negligible.

Figure 3. Left: longitudinal phase space of the 100 pC charge beam at the exit of the FERMI injector, simulated with GPT. Right: peak current (red) and SES (blue) from GPT tracking. The green horizontal line represents the semi-analytical model prediction of σE,0 = 0.9 keV.
Download figure:
Standard image High-resolution image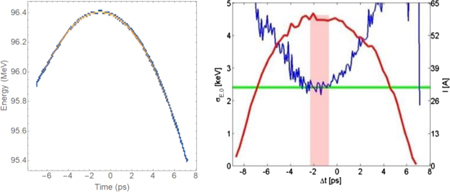
Figure 4. Same as in figure 3, for the 650 charge beam. The green horizontal line represents the semi-analytical model prediction of σE,0 = 2.4 keV.
Download figure:
Standard image High-resolution imageThe simulated longitudinal phase space at the injector exit is also shown in figures 3 and 4. Since our model assumes the same transverse Gaussian distribution and a constant local beam current in each slice, we have highlighted the region of the peak current which, in the tracking, corresponds to the modelled current level. The superposition of blue data (tracking result) and green line (model) within the red bar region (modelled slice current) shows that the GPT prediction for σE,0 is in agreement with our fit in the presence of IBS. In contrast, the aforementioned values of σE,0 used in the model without IBS do not match the tracking results. Oscillations and much larger values of the simulated SES at lower current regions are due to higher numerical sampling noise for small number of particles, and residual large energy chirp components in the phase space.
In summary, our fit for the initial uncorrelated energy spread, as derived from the MBI model with the revisited single pass theory of IBS, is consistent with particle tracking simulations of the injector. An analogous fit from a model without IBS, is not.
3.3. Final slice energy spread
Figure 5 compares the measured and the predicted SES at the end of the FERMI linac, for different compression schemes at low charge (top), and for single compression but at various compression factors at high charge (bottom). The laser heater is switched off in all the measurements. The error bars of the measured data are dominated by the reproducibility of consecutive measurements in the same experimental session. The error bars on the model predictions are dominated by the uncertainty on the average beam sizes in the linac (see next section).
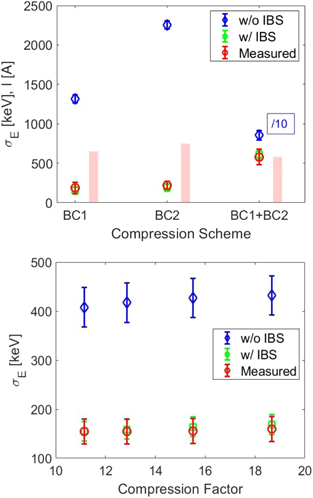
Figure 5. Top: SES (dots) and peak current (bars) measured at the linac end for the 100 pC beam, for various compression schemes. The SES is compared with the prediction of the MBI model with (green squares) and without IBS (blue diamonds). One of the blue points is diminished by a factor 10 for better visibility. Bottom: SES measured at the linac end for the 650 pC beam. The SES is compared with the prediction of the MBI model with (green squares) and without IBS (blue diamonds). The compression is accomplished with BC1 only, and the compression factor varied through linac RF phases. The peak current ranges from ∼600 to ∼1100 A.
Download figure:
Standard image High-resolution imageFigure 5 shows that the proposed model is able to capture the physics of the instability, predicting SES values at the same level as the experimental data. More importantly, it clearly points out the discrepancy between the predicted and the measured SES in the case that IBS is not included in the model.
Figure 5 also shows that the contribution of IBS to the MBI development is larger for higher instability gain, such as in the BC1 + BC2 scheme, as compared to the single compression cases. In fact, when IBS is not included in the model, the double compression offers an unrealistically large value of the SES (see figure 5-top plot, in which the blue marker is lowered by a factor 10 for better visibility). That is because at large gain, any additional although small contribution to σδ enhances the exponential damping in equation (17) more notably. Conversely, when the gain is intrinsically low, the effect of additional Landau damping by IBS is less pronounced: the amplification process and therefore the final SES depends more weakly on variations of the machine configuration such as the compression factor (this is the case of figure 5-bottom plot).
For completeness, we show in figure 6 the prediction of the net contribution from IBS to the SES accumulated along individual linac sections (blue bars), for the three compression schemes studied with the low charge beam. The total SES (orange bars) is also given, which represents the SES contributed by MBI (equation (19)) and IBS (equations (8), (11) and (14)), taking into account the compression factor at each chicane. The height of the final orange bar is the SES reported in figure 5 (top plot, IBS included).

Figure 6. Calculation of the net IBS contribution to the SES (blue bars) accumulated through individual linac sections (labels refer to figure 1), and total SES as contributed by IBS and MBI energy modulations in the presence of magnetic compression. From top to bottom: BC1-only, BC2-only and BC1 + BC2 compression scheme. The bunch charge is 100 pC in each case. Laser heater is off.
Download figure:
Standard image High-resolution imageTo summarize, for plausible injector longitudinal phase space, it is only with the inclusion of the integrated effect of IBS along the whole linac that we can reproduce the SES observed at the end of acceleration, for a wide range of beam parameters and machine configurations, for a single value of σE,0 per injector setup, and in agreement with the σE,0 predicted by particle tracking runs.
4. Sensitivity to laser heater and beam sizes
The validity of the proposed model is now discussed in the presence of two additional effects, laser heater and large electron beam sizes. This draws on additional experimental results.
Firstly, the model predictions are compared with measured values of the SES in a condition of laser heater turned on, and at a level such that the MBI is suppressed. In this case, one expects an approximate preservation of the longitudinal beam emittance (Liouvillian behaviour), and therefore the SES should be inversely proportional to bunch duration. Figure 7 illustrates this situation for the 100 pC bunch charge, compressed in BC1 over a wide range of compression factors. We observe that, first, the model agrees with the expected linear dependence of the SES on the compression factor. Secondly, although the impact of IBS on the beam dynamics is not as significant as in the presence of strong MBI gain, its contribution to the final energy spread leads to the agreement of experimental and modelled results. By comparing figure 7 with figure 5, we conclude that IBS lowers the final SES by virtue of energy Landau damping when the instability gain is high. Conversely, it increases the final SES when the instability gain is intrinsically small.
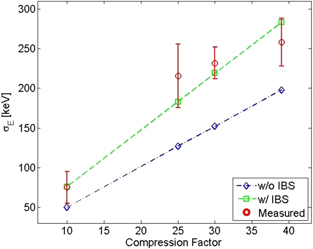
Figure 7. SES vs compression factor, for 100 pC bunch charge and compression in BC1 only. The laser heater is inducing 6 keV RMS energy spread before compression.
Download figure:
Standard image High-resolution imageIt was mentioned earlier that the major uncertainty in the model is the beam initial energy spread. This uncertainty has been addressed in section 3. A second uncertainty may derive from the local variation of the beam sizes (namely, Twiss parameters) along tens-of-meters-long linac sections. As discussed in section 2, the model assumes average beam sizes, calculated as a function of the transverse emittances and Twiss functions measured at the injector exit, of experimental quadrupole magnets setting and accelerating gradients. Optics matching is reinforced at additional locations, i.e., in the BC1 region and at the linac end. While in most cases the deviation of the beam optics from a matched condition is very limited, the possibility exists of local large oscillations of the betatron functions, due to either mishandling of the magnets or inaccurate matching.
To investigate the sensitivity of our model to the beam sizes, we show in figure 8 the predicted SES for the 100 pC bunch charge (with same parameters as in figure 5–top plot, see also table 1) as a function of the average betatron function in the low energy part of the FERMI linac. This region is constituted by the laser heater insertion followed by linac1, for acceleration up to BC1. The beam energy ranges from 96 to approximately 300 MeV, for a total length of 43 m (over a total linac length of 150 m). Single and double compression schemes are modelled in figure 8, with no laser heater action.

Figure 8. SES calculated with the MBI + IBS model vs average betatron function in the low energy region of the FERMI linac, for the 100 pC bunch charge in single (BC1) and double compression (BC1 + BC2).
Download figure:
Standard image High-resolution imageIt is seen that the modification to the predicted SES for a variation of the betatron functions by an unrealistic factor 6 (equivalent to more than doubled beam sizes, and up to ∼500 μm RMS) is at the level of few tens of keV. This variation in the beam optics is considered to have a larger effect on the calculated SES than any remaining inaccuracy in the modelling of the three-dimensional dynamics related to the longitudinal space charge impedance, or in the estimated impact parameters for the Coulomb logarithm. In summary, no realistic uncertainty on the actual beam optics could significantly impact the prediction of the model as depicted in figures 5 and 7, nor the discrepancy of predicted and measured values when IBS is not included.
5. Optimization studies
5.1. Compression schemes
The semi-analytical model was applied to the forthcoming FERMI linac energy upgrade [71], which aims at a beam energy of 1.8 GeV and a peak current ⩾1 kA, for lasing down to 2 nm in fundamental emission (compared to the present 1.5 GeV and 0.7 kA, respectively, lasing at 4 nm). According to particle tracking with the elegant code [72], a two-stage compression promises an increase of the peak current while keeping the final longitudinal phase space 'flat' (small energy chirp, flat current profile), which is ideal for externally seeded FELs. The initial peak current, the ratio of compression factors, the linac RF phasing and the momentum compaction of the two compressors were adjusted as a function of the instability gain and of the SES predicted by our model. This indicates that a gain smaller than in the present single compression can be obtained with: (i) a lower initial peak current of ∼50 A, instead of the present 70 A, leading to a weaker LSC effect at low energy, and (ii) lower energy chirp and larger R56 at BC2, leading to a more effective phase mixing [73], thus a red-shift and overall reduction of the instability gain. Our findings are illustrated in figure 9 and summarized in table 2.
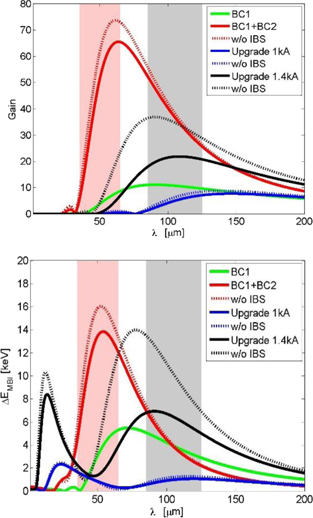
Figure 9. Predicted MBI gain (top) and energy modulation amplitude (bottom) vs initial (=uncompressed) modulation wavelength, for the present FERMI single (green) and double compression (red), and for the upgraded double compression to 1 kA (blue) and 1.4 kA (black). Curves without IBS (dotted magenta, cyan and grey) are also shown. Shadow areas identify the range of FEL cooperation length (properly scaled by the compression factor): red is for 4 nm lasing with present FERMI, grey is for 2 nm lasing with upgraded FERMI.
Download figure:
Standard image High-resolution image
Table 2. Parameters of FERMI for modelling of different compression schemes, in the present and upgraded machine configuration. Parameters in bold underline the improvements enabled by the linac upgrade.
| BC1 present | BC1 + BC2 present | BC1 + BC2 upgrade | Unit | |
|---|---|---|---|---|
| Bunch charge | 700 | 700 | 700 | pC |
| Initial norm. projected emittance, RMS | 0.8 | 0.8 | 0.8 | μm rad |
| Initial peak current | 70 | 70 | 50 | A |
| Initial uncorrelated energy spread | 2.4 | 2.4 | 2.4 | keV |
| Laser heater-induced energy spread | 8 | 10 | 6(3) | keV |
| Beam energy at BC1 | 290 | 285 | 285 | MeV |
| Beam energy at BC2 | 630 | 630 | ∼850 | MeV |
| Final beam energy | 1450 | 1450 | ∼1770 | MeV |
| Average betatron functions | 7, 15, 20, 25 | 7, 15, 20, 25 | 20, 20, 30, 30 | |
| Final norm. projected emittance, RMS | 1.2 | 1.2 | 1.4(1.5) | μm rad |
| R56 of BC1, BC2 | −41, 0 | −41, −35 | −41, −41 | mm |
| Compression factor | 10 | 4 × 2.5 | 4 × 5(7) | |
| Final peak current | 700 | 700 | 1000 (1400) | A |
| Final slice rel. energy spread, RMS | ∼0.07 | ∼0.08 | ∼0.09(∼0.1) | ‰ |
| Peak microbunching gain | 11 | 62 | 8(16) | |
| Final wavelength of max. gain | 9 | 6 | 8(4) | μm |
When the LH is turned on, the final SES becomes proportional to the LH-induced energy spread times the total compression factor. The additional specification of final SES ⩽ 0.01% limits the beam heating to maximum 10 keV in the present machine (consistent with operational experience), and to 6 keV in the 1 kA-upgrade. Any further increase of the peak current (black lines in figure 8) inevitably limits beam heating to ∼3 keV. Such low heating, together with a higher current, implies a pronounced residual energy modulation. Therefore, a show-stopper to longitudinal coherence can be envisaged at peak currents largely exceeding 1 kA, for beam energies at GeV level. We draw attention to the fact that, since the intrinsic gain of the instability is higher for 1.4 kA, the impact of IBS is more apparent, in confirmation of our experimental findings in section 3 and 4.
5.2. Spectral range of the instability
To establish a closer connection to the lasing process, we compare the gain and the energy modulation curve in figure 9 with the characteristic length scale of the FEL emission. In a seeded FEL, the cooperation length lc [22, 23] becomes in fact as long as the coherent pulse length. This is in turn a function of the seed laser duration and of the harmonic order of emission [74, 75]. At 2(4) nm, for a seed length of 30 μm FWHM at 260 nm central wavelength, i.e. at harmonics of the order of 130(65), the expected coherent pulse length is in the range lc ∼3–5(4–6) μm, depending on the level of FEL power growth. The spectral overlap of the MBI curves with the FEL cooperation length is illustrated through shadow areas in figure 9. One should note that since the gain and energy modulation curves are expressed as a function of the initial (i.e., uncompressed) modulation wavelength, for illustration purposes the ranges of lc have been multiplied by the corresponding bunch length compression factor (this is 10 for the present machine scenarios, 20 for the upgrade to 1 kA, 28 for the upgrade to 1.4 kA, see table 2).
Firstly, we observe that the predicted energy modulation for the present BC1-only scheme (green curve) is larger at final wavelengths of 4–6 μm, so matching the observed spectral broadening at FERMI [32]. Secondly, the superposition of the blue curve (BC1 + BC2 up to 1 kA) with the grey area (lasing at 2 nm) indicates a smaller effect of the instability on the upgraded FEL performance than in the present lasing conditions (green curve under the red area). In short, the figure shows the capability of the upgraded and optimized accelerator configuration to largely mitigate the MBI for a stable single line emission in the water window.
6. Conclusions
The systematic agreement of an MBI model integrated with a revisited IBS theory for single pass accelerators, with particle tracking and measurements of the beam longitudinal phase space at FERMI, supports the evidence of IBS effects in an electron linac. We have shown that the contribution of IBS to the beam dynamics can be significant for operating configurations of VUV and soft x-ray FELs, and that neglecting the hereby demonstrated effects of IBS can result in too conservative facility designs or failure to realise the accessible potential performance. One example of this, is a too pessimistic assessment of the possibility of extending the superior longitudinal coherence achieved by external seeding (as opposed to self-seeding, which suffers from shot-to-shot variability) from UV into x-ray wavelengths. An optimization of the FERMI linac parameters driven by the experimentally benchmakred model indicates that an extension of stable longitudinal coherence to the water window is plausible, with far-reaching implications for the light sources user community.
Acknowledgments
The authors acknowledge A Marinelli for comments about the calculation of the SES, T Raubenheimer for advices to the calculation of the Coulomb logarithm, F O'Shea for support to the modelling of the FERMI upgrade with the elegant code, B van der Geer and P Smörenburg for support to the FERMI injector modelling with the GPT code, I Akkermans for support to the experiment preparation, C-Y Tsai for a review of the manuscript, W Fawley and H Owen for helpful comments, and the FERMI team for support in the control room. This work has received funding by the European Union's Horizon 2020 research and innovation programme under Grant Agreement No. 777431.