


Abstract
In magnetic semiconductors the optical spectrum and, in particular, the absorption edge representing the band-gap are strongly affected by the onset of the magnetic order. This contribution to the band-gap energy has hitherto been described theoretically in terms of a Heisenberg Hamiltonian, in which a delocalized conduction carrier is coupled to the localized magnetic moments by the exchange interaction. Such models, however, do not take into account the strong correlations displayed in a wide variety of magnetic semiconductors, which are responsible for the formation of the local moments. In particular, the itinerant carrier itself contributes to the spin moment. Here, we overcome this simplification in a combined experimental and theoretical study of the antiferromagnetic semiconductor α-MnTe. First, we present a spectroscopic optical investigation as a function of temperature, from which we extract the magnetic contribution to the blue-shift of the band-gap. Second, we formulate a minimal model based on a Hubbard–Kondo Hamiltonian. In this model, the itinerant charge is one of the electrons forming the localized magnetic moment, which properly captures correlation effects in the material. Our theory reproduces the experimental findings with excellent quantitative agreement, demonstrating that the magnetic contribution to the band-gap energy of α-MnTe is mediated solely by the exchange interaction. These results describe an intrinsic property of the material, independent of the thickness, substrate and capping layer of the specimen. One of the key findings of the model is that the basic effect, namely a blue-shift of the band-gap due to the establishment of the magnetic order, is a general phenomenon in charge-transfer insulators. The identification of the relevant magnetic interaction discloses the possibility to exploit the effect here discussed to induce a novel regime of coherent spin dynamics, in which spin oscillations on a characteristic time-scale of 100 fs are triggered and are intrinsically coupled to charges.
Export citation and abstract BibTeX RIS

Original content from this work may be used under the terms of the Creative Commons Attribution 4.0 licence. Any further distribution of this work must maintain attribution to the author(s) and the title of the work, journal citation and DOI.
1. Introduction
The investigation of the interaction between light and magnetic materials has been a dominating topic in condensed matter physics, given the applicability of optical methods to virtually all the magnetically ordered compounds, regardless of their electronic nature (conductor, insulator or semiconductor). In particular, a massive and ever-increasing effort has been devoted to control the magnetic order of solids on the ultrafast time-scale by means of femtosecond laser pulses [1–6]. From the plethora of studies already published in the literature two main considerations can be deduced: (i) the time-scale of the photo-induced spin dynamics depends on the specific magnetic interaction (i.e. spin–orbit or exchange) involved in the coupling between light and spins [7–9], (ii) it is highly desirable to convert femtosecond manipulations of the magnetic order into charge signals. The latter point has both fundamental and applied motivations. On the one hand, it addresses unexplored phenomena such as a transfer of coherence, and thus information, from a photoinduced coherent collective magnetic mode to charges on a time-scale as short as 10 femtosecond [10–13] even in the absence of laser-heating [14]. On the other hand, any future information technology which may rely on femtosecond manipulations of magnets needs to be compatible with nowadays available schemes, which are charge-based. In this framework it emerges as paramount to investigate materials in which spin and charges are coupled [15–19], identify signatures of such coupling by means of optical spectroscopic methods and realise which magnetic interaction is involved. In fact the bottleneck of the time-scale of the whole process is determined by the spin system, as the electronic dynamics is typically faster [20]. A class of materials that has recently attracted major interest in this respect is represented by antiferromagnets, in view of their intrinsically faster spin dynamics when compared to ferromagnets [21–23]. In addition, magnetically ordered semiconductors display in their ground state an intrinsic coupling between the optical and magnetic degrees of freedom [24–27].
Here we report an experimental and theoretical investigation of the antiferromagnetic semiconductor α-MnTe. We perform temperature-dependent absorption measurements to extract the magnetic contribution to the blue-shift of the band-gap energy, which is observed as the temperature decreases. The described phenomenon results from a correlation between charges and magnetic order. We unravel the microscopic origin of such correlations, by modelling the magnetic structure of our material and quantitatively calculating the effect of the long-range magnetic order on the energy of the band-gap by means of a Hubbard–Kondo type Hamiltonian. Our work demonstrates that the experimentally detected magnetic contribution to the blue-shift of the band-gap is quantitatively reproduced in a mean-field description based on a two-site cluster and, as such, is directly related to local correlations in the material. Crucially, the correlation between magnetism and optical properties is purely mediated by the exchange interaction: no contribution from the spin–orbit coupling has to be invoked to reproduce the experimental results with excellent agreement.
2. Methods and materials
Hexagonal manganese telluride (α-MnTe) crystallizes in the NiAs structure [28] (space group  ). It is a correlated magnetic semiconductor with a moderate indirect band-gap Eg ≈ (1.27–1.46) eV and magnetic order below the Néel temperature TN ≈ 310 K [29]. The magnetic structure consists of ferromagnetic hexagonal Mn planes, stacked and coupled antiferromagnetically along the c-axis [30, 31] (figure 1). Like for other magnetic semiconductors, it has been shown that free standing single crystals of α-MnTe display a magnetic contribution to the band gap energy that scales like the square of the magnetization of the two Mn-sublattices (shown in figure 1 as Mn⇑,⇓) as a function of temperature [32]. This effect was demonstrated on specimens with thickness on the order of 200 μm [32]. Here, we investigate a 200 nm thick film of α-MnTe grown by molecular beam epitaxy on a SrF2(111) substrate using elemental Mn and Te sources and substrate temperature in the 370 °C–450 °C range. Two-dimensional growth was achieved in both cases as inferred from the streaked reflection high energy electron diffraction (RHEED) patterns observed during growth. The epitaxial relation between the MnTe overlayer and the substrate is (0001)[10(−1)0]MnTe||(111)[11(−2)]sub. A 10 nm thick layer of Al2O3 caps the sample.

Figure 1. Crystallographic and magnetic structure of α-MnTe. The three super-exchange paths are shown by the red dashed arrows [31]: J1 is the dominating antiferromagnetic super-exchange interaction to two vertically adjacent sites, J2 is a weaker ferromagnetic coupling between Mn-atoms within the ferromagnetic hexagonal planes to six horizontally adjacent sites, the Te-mediated J3 is the weakest interaction and it is antiferromagnetic, involving 12 next-nearest neighbour sites.
Download figure:
Standard image High-resolution imageTo access the temperature dependence of the optical band-gap energy, we perform measurements of the absorption spectrum of α-MnTe as a function of temperature (figure 2(a)). For this purpose we employed the commercially available CARY 6000i UV-Vis-NIR system from Agilent Technologies covering the spectral range (175–1800) nm. In this instrument, the output of a tungsten lamp is monochromatised by an out-of-plane double Littrow monochromator achieving a spectral resolution of ≈1 nm. The monochromatic light is then split into two beams by a three-bladed mechanical chopper operating at 30 Hz and fed into two different paths: the sample and the reference path. In the sample path we placed an additional optical cryostat containing the sample, allowing us to change the sample temperature in the (4–400) K range. The intensity of both the transmitted beam and the reference beam are measured.
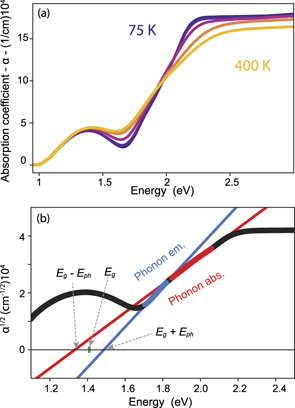
Figure 2. (a) Selected measurements of the absorption spectrum as a function of temperature from 25 K to 400 K. The profile and the position of the fundamental absorption edge change. The instrumental error was estimated to be ±0.03 cm−1 × 10⁴. This value was obtained by calculating the standard deviation of the data in spectral ranges where the absporption is flat. (b) Performing a linear fit for phonon assisted absorption (red) and emission (blue) the band gap energy is estimated. It is defined as the average between the onset energies of the strong absorption for both phonon assisted absorption and emission.
Download figure:
Standard image High-resolution image3. Optical spectroscopy
Figure 2(a) displays the temperature dependence of the optical absorption spectrum in the energy window 1–3 eV for a few selected values of temperature. The rising edge of the absorption spectrum, observed in correspondence of the spectral range containing the band-gap, is strongly affected by the modification of temperature. In order to properly analyse and rationalise this observation, we recall a few basic aspects of the optical properties of indirect band-gap semiconductors.
The optical absorption edge representing the electronic band-gap in indirect semiconductors is influenced by two different processes: the photon absorption and the absorption/emission of phonons that allow the indirect optical transition. Relying on perturbation theory, the imaginary component of the dielectric function in the vicinity of the optical band-gap energy (Eg) is typically described [33] as

where ℏ represents the reduced Planck constant, ω the frequency of the absorbed light beam, Ep the energy of the absorbed/emitted phonon during the optical transition [33]. We observe that this modelling is a strong simplification of the dielectric function, since the probabilities of phonon absorption and emission are assumed to be equal and several other processes, which may strongly affect the spectrum (electron–electron, electron–phonon and electron–magnon scattering, multiparticles processes), are neglected.
From equation (1) it follows that the square root of the dielectric function  (ω) in the spectral range relevant for the band-gap can be fitted with two linear functions, whose intersection with the energy axis is given by Eg ± Ep, respectively. Figure 2(b) shows an example of such a fit procedure performed for the data recorded at T = 25 K. Following a text-book approach [33], Eg is calculated by taking the average of the minimum energy required for phonon assisted transitions i.e. α(ω) ⩾ 0. From the linear fit, and using the calculated value Eg = 1.41 eV, we evaluate Ep = 77 meV which is in the same order of magnitude as the value of 34 meV reported for free-standing single crystals [32].
Let us now discuss the temperature dependence of Eg. In a paramagnetic semiconductor, it is generally described in terms of the phenomenological Varshni function

where a and b are constants and Eg(0) describes the energy of the optical band-gap at T = 0 K [32, 34]. Figure 3 shows the temperature dependence of Eg as extracted from the absorption measurements (black diamonds). By means of equation (2) we reproduce the data in the paramagnetic phase (T > 307 K), by setting b = 60 K and taking a and Eg(0) as fit parameters, as demonstrated in the literature [32].

Figure 3. Temperature dependence of the band-gap energy. The plotted Varshni function from equation (2) reproduces the data in the paramagnetic phase. Subtracting it from the dataset for Eg (black squares, left y-axis), as reported in the main text, allows us to isolate the magnetic contribution to the band-gap energy. This contribution (blue dots, right y-axis) varies with the temperature consistently with the trend followed by the sublattice magnetization, as already reported for bulk samples [32].
Download figure:
Standard image High-resolution imageHowever, as the long-range antiferromagnetic order is established, the experimentally obtained data points are shifted towards a higher energy with respect to the extrapolated Varshni-function. This blue-shift increases as the temperature decreases (figure 3). In order to extract the magnetic contribution to the blue-shift from the data, we subtract the extrapolated Varshni function (red curve in figure 3), representing the paramagnetic behaviour, from the entire data-set. The obtained magnetic contribution to the blue-shift is shown in figure 3 with blue dots and is consistent with the literature [32], scaling with temperature thus, as the squared normalised sublattice magnetization ΔE(T) ∝ (M(T))2. Given the equivalence of the two sublattices in an antiferromagnet, it follows that M = M(Mn⇑) = −M(Mn⇓). The magnetic blueshift detected at the lowest temperature (T = 25 K) amounts to ≈80 meV. The results shown in figure 3 confirm the results reported in the literature for samples with thicknesses on the order of 200 μm [32]. The discrepancy between the results of our analysis and the values reported in the literature [32] can be taken as a measurement of the accuracy of our procedure to extrapolate the low-temperature value of the magnetic blueshift, based on the fitting of data in the paramagnetic phase (i.e. T > 300 K). Such accuracy is ≈10 meV, consistent also with the discrepancy between different datasets in reference [32]. This observation reflects therefore an intrinsic property of α-MnTe , which is independent of the sample thickness and is not affected by the presence of a substrate and capping layer.
Having established this robust experimental evidence, we deal then with the fundamental question about the microscopic origin of the magnetic contribution to the blue-shift of the band-gap energy. In particular, we aim at identifying the magnetic interactions involved in this process.
4. Theoretical model
In the literature, the magnetic contribution to the blue-shift of the optical band-gap has been treated by modelling the system by means of Heisenberg Hamiltonians containing, as a main ingredient, the exchange interaction between a conduction electron (or hole) and the localized magnetic moments of the Mn ions [32, 35, 36]. The value of the magnetic blue-shift can be calculated applying second-order perturbation theory to the ground state of the system with N spins and one electron. Although this procedure gives theoretical values close to the experiments, it does not capture the correlations that underly the observed phenomenon, which are responsible for the formation of magnetic moments. The microscopic nature of the electronic interactions, such as local Hubbard repulsion and Hund's coupling, are missed, although they are known to be crucial [37]. Thereby the origin of the coupling between magnetic properties and charges in α-MnTe is not clarified.
To go beyond this limited picture, we formulate a minimal model based on a Hubbard–Kondo type Hamiltonian by considering two manganese (Mn2+) sites i ∈ {1, 2} along the z-direction, which coincides with the crystallographic c-axis of α-MnTe to gain a qualitative and quantitative description of the spin-charge coupling. At each manganese site there are five electrons, four of which are treated as localized spins  with S = 2, consistent with the first Hund's rule. The two Mn2+ magnetic moments are antiferromagnetically coupled by a single exchange constant J, representing the J1 path displayed in figure 4(a): the two localized magnetic moments mimic the two Mn-sublattices. The fifth electron can hop back and forth between the two sites with an amplitude t. It is important to underline, that we do not state that the d-electrons in MnTe can be rigorously split into four localised ones and an itinerant one. We rather view the itinerant one and its charge dynamics as representative of all five d-electrons. The spin of the itinerant electron is
  with s = 1/2 and it is coupled ferromagnetically to the local spins via the Hund's coupling JH. Since we consider N S = 2 localised magnetic moments and N s = 1/2 itinerant spins for a lattice of N Mn sites, no degrees of freedom are left out. The electrons with opposite spins at each site experience a Hubbard repulsion U > 0 suppressing double occupancy and favouring local moment formation. We also include an additional pivotal element: an alternating effective mean-field h representing the exchange interaction of the two Mn2+ spins with the magnetic moments on adjacent Mn sites, which are not explicitly included in the two-site model (figure 4(b)). It is worth noting that h describes the effect of the magnetic environment on the Mn2+ moments and is thereby generated by a J1 coupling to one adjacent magnetic moment in the z-direction, six nearest neighbours coupled by J2 in the xy-plane and 12 next-nearest-neighbours coupled by J3. The values of these couplings are taken from experiment [31], since their ab initio determination is very demanding [38] and beyond the scope of the present paper. This physical picture is formalised by the following Hamiltonian

where  is the occupation number of the electron with spin σ. Setting h = 0 (figure 4(a)), the ground state is a singlet, i.e. Stot = 0, where

describes the total spin vector. Since our model does not comprise spin–orbit coupling, the light-matter interaction cannot change the total spin. The optical band-gap Δdd is thus determined by the difference between the ground state and the next higher lying state with Stot = 0 (figure 4(a)). Although Δdd overestimates the experimentally detected band-gap Eg, these two quantities are related in a one-to-one fashion. We find that Δdd is the 15th state if the ground state is counted as the first. Hence, the bare optical gap Δdd = E15 − E1 in the two-site model expressed by the Hamiltonian in equation (3). The bare optical gap takes values around U + 4J ≈ 8 eV. However, MnTe is not a simple Mott insulator, but a charge-transfer insulator, since the p-bands from Te are higher in energy than the lower Hubbard band. Inspecting the DOS [30] it follows that the bare optical gap is a transition from the d-levels at −6 eV to the average of the DOS above the Fermi level at around +2 eV is in this range of parameters. In the experiment, the indirect optical gap consists in the transition lifting an electron from the upper edge of the Te p-bands to the lower edge of the upper Hubbard–Mott band at around +2 eV. Thus, the experimentally measured gap is much smaller, but this is in line with the model because the temporal changes of Δdd and ΔE are the same, assuming that the lower Mott–Hubbard band does not shift relatively to the p-bands. It is important to note that under this assumption the prediction of the model can be directly compared with the experiments. However, the alternative scenario, in which the lower Hubbard band shifts relatively to the Te p-bands is not forbidden and cannot be ruled out a priori. In this case, our estimations would be an upper bound of the real effect. However, the quantitative agreement between the predictions of the model and the experimental results (as discussed below) strongly suggests that the relative energy separation between the lower Hubbard band and the Te p-bands is not affected by the establishment of the magnetic order.

Figure 4. (a) Only one exchange interaction, namely the super-exchange pattern J1 (figure 1) is considered explicitly. Solving the Hamiltonian in equation (3) with h = 0, 15 electronic levels are obtained and the bare optical band-gap Δdd is identified as the difference in energy between the first and the 15th level. The mobile spins are indicated as s1,2, while S1,2 represent the localized magnetic moments. (b) Including the effective mean-field h (representing also the effect of the other super-exchange couplings J2 and J3), the energy levels are shifted and Δdd increases. In particular, a quantitative estimation of the blueshift of Δdd and, thus, of Eg, provides a numerical value remarkably close to the experimental observations.
Download figure:
Standard image High-resolution imageSeeking a direct comparison between the predictions of the model and the results in figure 3, we compute the dependence of Δdd on h and on the site magnetization, which reflects the sublattice magnetization and is defined as

whose value ranges between −5/2 and 5/2 in units of ℏ. Many theoretical studies on MnTe use values of U in the range of 5 eV (see table 1). Inspecting local atomic physics, one finds that for the d-orbitals of Mn2+ the Racah parameters A, B and C [39] are deduced and the relation linking to U and JH follows as [40]:

and for comparison the ones from reference [41]

Table 1. Racah parameters (in eV) and resulting couplings (in eV) according to the references in the first column. The first set of Hubbard repulsion and Hund's coupling (columns 5 and 6) are computed according to reference [40], (equation (6)), and the second set (columns 7 and 8) according to reference [41], (equation (7)).
| Reference | A | B | C | U | JH | U | JH |
|---|---|---|---|---|---|---|---|
| [42, 43] | 6.05 | 0.107 | 0.477 | 5.5 | 0.8 | 7.2 | 1.05 |
| [44] | 5.43 | 0.119 | 0.4122 | 4.8 | 0.77 | 6.5 | 1.00 |
In view of the better agreement with other values from the literature, we take U = 5.5 eV and JH = 0.8 as reasonable. We identify the magnetic exchange coupling J in the dimer model with J1 in MnTe and with J1 in reference [45]. The value reported in this reference has to be doubled, since conventionally a bond is counted once in magnetic systems. Then we obtain J = 3.7 meV. The maximum field exerted by the neighbouring sites is simply taken from the maximum of the measured dispersion, hence hmax = 35 meV. This value is essentially equal to the sum of all couplings weighted by their coordination number and the maximum sublattice magnetization hmax = (5/2)(2J1 − 6J2 + 12J3). Note that we assign a minus sign to the ferromagnetic exchange. The hopping parameter can be chosen so that the resulting coupling between the two mobile spins equals J.

which leads to t = 86 meV. Considering hence the saturated magnetization (m = 5/2), which corresponds experimentally to the measurements performed at the lowest temperature, the predicted blueshift of Eg is 84 meV. This value compares remarkably well with the measured 80 meV shift of Eg. The essential observation in figure 5 is that the value of t hardly influences the maximum value of the additional gap, even though it is altered by more than an order of magnitude. There is, however, an influence on the shape of the curve. Nevertheless an estimation of the value of the hopping energy can be done. First, considering the values of the parameters employed and reminding that J = 4t2/Δdd and Δdd ≈ U + 4JH, we thus obtain t = 0.086 eV. Second, taking an estimate of the bandwidth value W ≈ 2 eV from DFT calculations [30] and considering the extreme case, in which only one-dimensional Mn–Mn electronic hopping along the z-direction is relevant, we obtain t = 0.5 eV. Therefore the 0.086 eV–0.5 eV range provides an estimation of the hopping energy t and is not too wide: figure 5 demonstrates that the results of the model are quantitatively robust even for variations of t larger than one order of magnitude. We thus conclude that our model, albeit simplified, properly captures the fundamental physics of the phenomenon displayed in figure 3 for h ≠ 0 and thus m ≠ 0. It is imperative to underline that the addition of spin–orbit coupling to our model is not necessary to reproduce the data shown in figure 3: this effect is thus induced solely by the exchange interaction.

Figure 5. The model parameters are: U = 5.5 eV and J = 3.7 meV. Strikingly the value of t does hardly change the maximum value of the additional band-gap energy.
Download figure:
Standard image High-resolution image
5. Conclusions and outlook
We measured the magnetic contribution to the blue-shift of the band-gap energy as a function of temperature in the antiferromagnetic α-MnTe. Then we formulated a minimal theoretical model able to qualitatively and quantitatively reproduce the experimental observation with excellent agreement. The theoretical calculation successfully describes the increase of the energy gap in a two-site model enhanced by a mean-field effect, showing the significance of local correlations. This result suggests that an improved description in an extended lattice model will be feasible by dynamic mean-field theory [37], although the large number of bands poses an obstacle to a straightforward application. One of our key findings is that the basic effect, namely a blue-shift of the band-gap due to the magnetic ordering is a general phenomenon in charge-transfer insulators. In fact our results were obtained employing only parameters from the literature and without any fine-tuning. Our work lays the foundations to disclose novel dynamical regimes, in which one of these two degrees of freedom is modulated and the other is affected as well. Recently it has been widely demonstrated that the sublattice magnetization of an antiferromagnet (as MnTe) can be modulated coherently (i.e. without energy dissipations) with characteristic frequencies up to the tens-of-THz regime by photo-inducing magnons [10, 12]. Applying such a magnetic manipulation to MnTe, in view of the coupling between sublattice magnetisation and band-gap, is expected to result in coherent oscillations of the band-gap energy. Such an effect could be employed to modulate the transport properties of a semiconductor at THz frequencies and, even, the emission wavelength of semiconducting laser diodes, whose active mediums exhibit the effect reported in our manuscript. Alternatively, the scenario of a transistor can be envisioned: the current flowing through such a device would strongly be dependent on the band-gap, whose energy could be modulated at THz frequency by generating magnons. In the specific case of MnTe, the magnetic phase is robust enough that such effects may be exploited even at room temperature, making this system technologically relevant. We note that the coupling of magnetism and optical properties is not limited to α-MnTe but it is also reported in the zinc-blende phase of MnTe [27, 36] and in other semiconductors, such as EuTe [46] and EuO [47].
Author contributions
DB and MC conceived the project, DB coordinated the project with contributions of MC. The sample was grown by GS and AB carried out the conventional characterization. MT and FM performed the absorption spectroscopy measurements and analysed the data. GSU developed and evaluated the theoretical model. DB and MC wrote the manuscript with contributions from all the authors.
Acknowledgments
This work was supported by the Deutsche Forschungsgemeinschaft through the International Collaborative Research Centre 160 (Projects B8) and by UH 90/13-1. We acknowledge financial support by Deutsche Forschungsgemeinschaft and TU Dortmund University within the funding programme Open Access Publishing. GS acknowledges Austrian Science Fund (FWF), Project P30960-N27. We thank for discussions: Frithjof B Anders, Thorben Linneweber, Kira Deltenre, Mohsen Hafez-Torbati.