


Abstract
Alkali-doping is a very efficient way of tuning the electronic properties of active molecular layers in (opto-) electronic devices based on organic semiconductors. In this context, we report on the phase formation and evolution of charge transfer salts formed by 7, 7, 8, 8-tetracyanoquinodimethane (TCNQ) in coadsorption with potassium on a Ag(111) surface. Based on an in-situ study using low energy electron microscopy and diffraction we identify the structural properties of four phases with different stoichiometries, and follow their growth and inter-phase transitions. We label these four phases α to δ, with increasing K content, the last two of which (γ and δ-phases) have not been previously reported. During TCNQ deposition on a K-precovered Ag(111) surface we find a superior stability of δ-phase islands compared to the γ-phase; continued TCNQ deposition leads to a direct transition from the δ to the β-phase when the K : TCNQ ratio corresponding to this phase regime is reached, with no intermediate γ-phase formation. When, instead, K is deposited on a surface precovered with large islands of the low density commensurate (LDC) TCNQ phase that are surrounded by a TCNQ 2D-gas, we observe two different scenarios: on the one hand, in the 2D-gas phase regions, very small α-phase islands are formed (close to the resolution limit of the microscope, 10–15 nm), which transform to β-phase islands of similar size with increasing K deposition. On the other hand, the large (micrometer-sized) TCNQ islands transform directly to similarly large single-domain β-phase islands, the formation of the intermediate α-phase being suppressed. This frustration of the LDC-to-α transition can be lifted by performing the experiment at elevated temperature. In this sense, the morphology of the pure TCNQ submonolayer is conserved during phase transitions.
Export citation and abstract BibTeX RIS

Original content from this work may be used under the terms of the Creative Commons Attribution 4.0 licence. Any further distribution of this work must maintain attribution to the author(s) and the title of the work, journal citation and DOI.
1. Introduction
The electronic properties of metal–organic interfaces, and particularly the energy level alignment of the metal Fermi level and the molecular orbital states, play a crucial role in determining the characteristics of electronic devices based on organic semiconductors. Bearing in mind the axiom that 'structure determines function', improved understanding of electronic properties can be achieved by first gaining quantitative structural data. One molecule that has attracted considerable interest, due to its strong electron acceptor properties and its ability to form conducting charge transfer salts, is 7, 7, 8, 8-tetracyanoquinodimethane (TCNQ), and there have been a number of investigations of TCNQ on coinage metal surfaces (e.g. [1, 2, 3, 4, 5, 6, 7, 8]). A density functional theory (DFT) investigation of TCNQ adsorbed on Ag(100) with coadsorbed alkali metal atoms highlighted the potential of this combination of adsorbates to control the surface work function and thus the energy barrier at the metal-organic interface [9]. In view of the recent detailed quantitative structural study of TCNQ on Ag(111) performed by some of us [8, 10] these investigations were extended to determine the effect of coadsorption of K on this same surface. In particular, through a combination of scanning tunneling microscopy (STM), low-current low energy electron diffraction (using micro-channel plate amplification—MCP-LEED), and soft x-ray photoelectron spectroscopy (SXPS), two specific coadsorption structural phases were identified. One of these is incommensurate with the underlying Ag(111) with a unit mesh of approximately  and a K : TCNQ stoichiometry of 1:1 [11]; the other phase is commensurate with a
  unit mesh and a K : TCNQ stoichiometry of 2:1 [12]. In the following we denote these phases as the 'α-phase' and 'β-phase', respectively.
The normal incidence x-ray standing wave (NIXSW) technique was also applied to extract quantitative data on the adsorption height and the molecular conformation for these two phases; these results for the incommensurate α-phase were reported in reference [11], while a more complete structure determination of the commensurate β-phase was obtained aided by dispersion-corrected DFT calculations [12]. The NIXSW data from these two phases (high coherent fractions for the C atoms) also show clearly that they comprise only a single molecular layer.
In this paper we present the results of a new investigation, using low energy electron microscopy (LEEM), which provides complementary structural data. Specifically, LEEM allows us to observe the formation and transformations of the KxTCNQy coadsorption phases on Ag(111) in real time, and hence to gain a much better understanding of these phases. One result of this investigation is the identification of two additional K-TCNQ coadsorption phases, the 'γ' and 'δ-phases', which form a progression with increasing K : TCNQ stoichiometry (from α to δ). Notice, however, that because these γ and δ-phases often coexist with other phases and may also be metastable, no quantitative structural investigation of these phases using NIXSW is possible. To inform any detailed discussion of the results of the present LEEM study, we briefly summarise what is known regarding the two (α and β) ordered phases from the two published structural studies [11, 12]. Figure 1 summarises the STM and LEED evidence for their matrix assignments and also shows structural models of the two phases. For both phases the relative heights of the constituent atoms above the surface are clearly established by the NIXSW results, but only for the commensurate β-phase is the structural model, including the adsorbate-substrate registry, complete. For the incommensurate α-phase, of course, there is no well-defined local registry and it is not possible to perform DFT calculations to obtain a more detailed understanding of the molecular conformation, so the structural model shown in figure 1 is based only on the STM images.

Figure 1. (a) and (d) show STM images of the incommensurate KTCNQ α-phase and the commensurate K2TCNQ β-phase, respectively, while (b) and (e) show the corresponding LEED patterns recorded at an electron energy of 14.5 eV. (c) and (f) show top views of the structural models of the α- and β-phase, respectively. K atoms are shown as purple spheres, N blue, C black, H white and Ag grey.
Download figure:
Standard image High-resolution imageIn the previously published work that identified the α and β coadsorption phases, the method of surface preparation was sequential depositions of K, from a SAES dispenser source, onto an Ag(111)  -TCNQ surface [8], each deposition being followed by annealing to 200 °C. In reference [10] we denoted this initial lower density commensurate phase of TCNQ on Ag(111) as the low density commensurate (LDC) phase, a term we also use throughout this paper. During the sequence of K-depositions LEED first showed the coexistence of the pure TCNQ LDC phase and the incommensurate coadsorption phase (α-phase), then only this coadsorption phase, followed by coexistence of the incommensurate (α) and commensurate (β) coadsorption phases, and finally only the commensurate β-phase. Increasing K coverage was found to lead to successive reductions in the work function from an initial value for the pure TCNQ LDC phase of 5.02 ± 0.05 eV to a value of 3.92 ± 0.05 eV for the commensurate K2TCNQ phase (β-phase), as measured by the secondary electron cut-off in ultraviolet photoelectron spectroscopy.
2. Results and Discussion
2.1. Structure of the KxTCNQy phases
Besides the two coadsorption phases already reported in the literature, which we introduced above and denoted α and β-phase, in the course of this study we have identified two further phases, γ and δ. Both have been seen in LEEM in-situ growth studies and structurally characterised using μLEED. In figure 2 we present μLEED patterns for all these phases. As will be described more fully below, we found the γ and δ-phases in relatively large structural domains, so that it was possible to record μLEED patterns showing the diffraction beams from only a single domain. In contrast, conventional LEED patterns as well as μLEED patterns from α and β-phase regions are usually six-fold symmetric, since they contain diffraction beams from all six rotational and mirror domains that occur due to the 3mm-symmetry of the Ag(111) substrate. Table 1 lists the structural parameters of all four phases.

Figure 2. μLEED patterns of all KTCNQ phases α-δ (panels (a)–(d), respectively), recorded in our low energy electron microscope in diffraction mode and corrected for distortions. In one half of each image a calculated diffraction pattern is superimposed (coloured circles, different colours indicating the LEED beams arising from different rotational and mirror domains). The calculated locations of these beams are based on the parameters listed in table 1. Larger circles in (a) mark the LEED diffracted beams used for dark field imaging, as discussed in presenting figure 5. The μLEED patterns were recorded using an electron energy of 17 eV.
Download figure:
Standard image High-resolution imageTable 1. Structural parameters of the ordered phases of KxTCNQy on a Ag(111) surface based on (μ)LEED and STM, listed for increasing x : y ratio. Beside the stoichiometry, the dimensions and included angle (|b1|, |b2| and Γ) of the unit mesh, the angle Φ between b1 and the [1–10] bulk direction, the superstructure matrix, and the unit mesh area are listed. Note that the parameters of the α and β-phase have been reported by Blowey et al [10] and were verified in the present study. γ and δ-phases have been observed and characterised for the first time in this work. The K : TCNQ stoichiometry of the γ phase is x(γ):1 where x(γ) > 2, while that of the δ-phase is x(δ):1 where x(δ) > x(γ).
| Superstructure | Unit mesh | ||||||
|---|---|---|---|---|---|---|---|
| Phase | Stoichiometry | |b1| [Å] | |b2| [Å] | Γ [°] | Φ [°] | matrix | area [Å2] |
| α | KTCNQ | 13.4(2) | 13.4(3) | 90(2) | 67(2) |  | 178.8 |
| β | K2TCNQ | 8.7(1) | 13.2(2) | 109(1) | 0(1) |  | 108.1 |
| γ | Kx(γ)TCNQ | 16.8(2) | 16.8(3) | 90(2) | 18(2) |  | 282.6 |
| δ | Kx(δ)TCNQ | 18.3(2) | 18.3(3) | 91(2) | 19(2) |  | 333.5 |
As can be seen from the superstructure matrices, the β-phase is the only one which is commensurate with the substrate lattice. It should also be mentioned that (so far) the γ and δ-phases have only been identified in the in-situ growth study using LEEM, reported here. When preparation procedures including post-deposition annealing are used, as, e.g., by Blowey et al [8], only the α and β-phases have been observed. This leads us to suggest that α and β are thermodynamically stable phases, while γ and δ may be only metastable.
2.2. In-situ studies of growth and phase transitions
Sequential deposition experiments of K and TCNQ have been performed and followed by LEEM in-situ and in real time. We have applied the two alternative deposition sequences in different experiments. We first report on the K + TCNQ sequence, i.e., TCNQ deposition on K-covered Ag(111) surfaces, using several different initial K coverages. Note that due to the lack of a reliable coverage calibration we cannot give precise quantitative coverages for both species. While coverages for ordered structures can (in principal) be estimated from the visible size of the islands, both species K and TCNQ also form disordered, 2D-gas-like regions, the density of which cannot be measured reliably. This inhibits a quantitative determination of total coverages, at least when ordered and disordered structures coexist. For homogeneous surfaces, such as in the case of the K-precovered surfaces used as starting point for TCNQ deposition, we were able to estimate the K coverage from work function changes, as described below.
2.2.1. Deposition sequence: K first—TCNQ second
Figures 3(a)–(d) show a sequence of LEEM images recorded at room temperature (RT) for TCNQ deposition on a Ag(111)-K sample. Initially, potassium was deposited from an alkali dispenser (Società Apparecchi Elettrici e Scientifici, S.A.E.S., Italy, operated at a current of 6.5 A) on the Ag(111) surface for 20 min at a partial pressure approx. 3 × 10⁻⁹ mbar. The exposure-dependent work function changes obtained by LEEM-IV measurements can be compared to values reported in the literature [13], although there is some ambiguity arising from how 1 ML is defined in these reference data. We estimated our 20 min exposure to correspond to a K coverage of about 0.2 ML. As expected at RT, no ordered structures were observed [14]. When the TCNQ deposition is started, the K pre-coverage acts as a K-reservoir offering a K surplus for the formation of some KxTCNQy phase(s), and hence the most K-rich phase (that is the δ-phase) is expected to nucleate first. Initially, islands of this phase can be seen in the LEEM images as bright areas, such as that marked by the red circle in figure 3(a). This early growth stage (first ∼2 min of TCNQ deposition) is dominated by such compact δ-phase islands. Unstable, needle-like structures were transiently observed, though the short lifetime of such species precluded the determination of their structure.
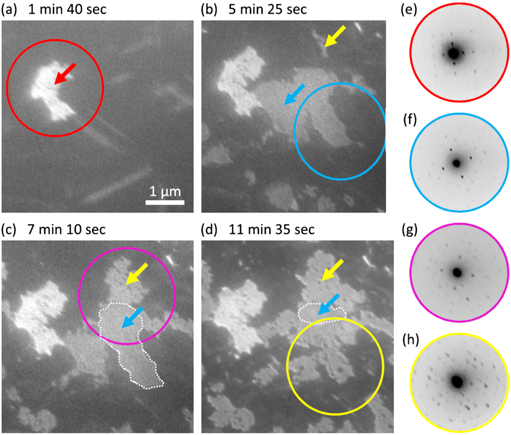
Figure 3. Series of LEEM images (a)–(d) and μLEED diffraction patterns (e)–(h) recorded during TCNQ deposition on an Ag(111) surface, following deposition of K for 20 min. The TCNQ deposition times are given in the figure. The phases occurring are colour-coded red (δ), blue (γ) and yellow (β). In the island circled magenta in (c) both γ and β- phase are coexisting. The coloured circles in the LEEM images mark the surface areas selected for recording the μLEED patterns. LEEM imaging conditions: slight overfocus, Ustart = 5 V 7. μLEED patterns were recorded at 17 eV.
Download figure:
Standard image High-resolution imageNote that all the phases α to δ were unambiguously identified by μLEED, as shown in figure 3. The coloured circles in the LEEM images of figures 3(a)–(d) indicate the surface area from which the corresponding μLEED patterns (e)–(h) were recorded. Figure 3(e) shows the μLEED pattern of a single δ-phase domain, and therefore identifies the bright island in figure 3(a) as δ-phase. While the detailed structure of the γ and δ-phases are unknown, the fact that they appear on the K-precovered surface at the very lowest TCNQ coverages (and subsequently transform into the α and β-phases) strongly suggests that, like the α and β-phases, they comprise only a single K/TCNQ layer.
After ∼2 min deposition time, γ-phase islands (the phase with the second-highest K content) nucleate at random locations, mostly not in close vicinity to the existing δ-islands. The γ-phase islands grow faster than the δ-islands and rapidly become dominant, as can be seen in figure 3(b) (∼5.5 min deposition time, grey islands). The nucleation and growth is clearly seen in the original LEEM movies. We provide two movies that correspond to the sequence of images shown in figure 3, 'Fig3_part1.avi' and 'Fig3_part2.avi', as supplementary online material. The former shows the nucleation and growth of the γ-phase islands. Note that the γ-phase islands are also compact, showing a homogeneous brightness in LEEM and having smooth edges, just like the brighter δ-islands. This behaviour differs from that of the next phase to appear, the β-phase, which also preferentially nucleates within the 2D-gas, at a certain distance from existing islands, and then grows rapidly towards the edges of γ and δ-phase islands. Subsequently, a phase transition of the γ-islands to the β-phase occurs (after approx. 7 min of TCNQ deposition). In the second movie ('Fig3_part2.avi') a clearly visible reaction front that represents the domain boundary between these two phases, γ and β, runs through the γ-phase islands. In individual 'snapshot' images this is difficult to see since the LEEM intensity is very similar from both phases (under the selected LEEM imaging conditions). The phases can be distinguished more easily by the compactness of islands. While the γ-islands show a homogeneous brightness, the β-islands have a speckled appearance and seem to be littered with pores (this is also more clearly visible in the movie than in the individual images). Figures 3(c) and (d) show snapshots of this phase transformation with the borderline of one shrinking γ-phase island marked by a white dotted line, indicating that the reaction front runs upwards through the area marked by a yellow circle in (d). The μLEED pattern taken from the area within the magenta circle in (c) shows the overlay of the two contributing μLEED patterns.
As time advances with further TCNQ deposition, the phase transition from γ to β is completed, and hence all grey islands visible in figure 3(d) are of the β-type; the corresponding μLEED pattern (figure 3(h)) is characteristic of the β-phase only. Interestingly, only the γ-phase islands transform into β, the δ-phase islands are unaffected. Evidently, the δ-phase is more stable than the γ-phase against a change of the overall K-TCNQ ratio. Hence, after ∼12 min of TCNQ deposition, the surface is covered by β and δ-phase islands, see figure 3(d). Doubtless, the area between the islands is still covered by the K 2D-gas phase, but most likely also by a significant amount of diffusing TCNQ molecules.
Upon continuing the TCNQ deposition both β and δ-phase islands eventually transform to the α-phase, which corresponds to the final state we observed in all our experiments using a K-precovered surface. This is shown in figure 4, starting with the coexistence of the β and δ-phases (identified by red and yellow arrows in figure 4(a), using the same colour code as above). These LEEM images stem from a second experiment similar to the one discussed above in context with figure 3. Subsequently, due to TCNQ deposition, the δ-phase islands start disappearing and the LEEM intensity on the entire sample surface becomes increasingly homogeneous. Finally the contrast between the former β-islands and the surrounding 2D-gas phase inverts, as can be seen in figure 4(b). μLEED patterns from both bright and dark regions are shown in figures 4(c) and (d), the areas from which they were recorded are marked by solid and dashed green circles in figure 4(b). Despite their different brightness in LEEM, both regions show the same µLEED pattern. No indications for any remaining β or δ-phase islands are found, but both µLEED patterns indicate the presence of multi-domain α-phase islands, in the region marked with the solid green circle even with equal occupation of the different domains. Since neither of the two phase transitions, δ-to-α and β-to-α, were clearly observable in LEEM, we suspect that they must occur on a length scale below (or at the limits of) our instrumental resolution (approximately 15 nm at a start energy of 5 V).
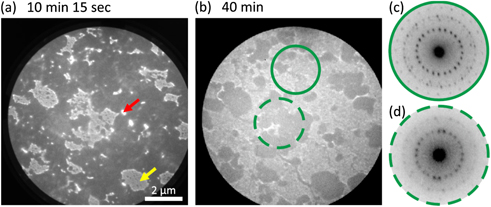
Figure 4. (a) and (b): LEEM images from an experiment similar to that leading to the images shown in figure 3, namely TCNQ deposition on a K-precovered Ag(111) surface. Colour-coding of the δ-phase (red), and β-phase (yellow) is identical to figure 3, while green marks the α-phase. LEEM imaging conditions: overfocus, field of view 10 µm, Ustart = 5 V. (c), (d): μLEED patterns recorded from the area indicated by green circles in (b). The μLEED patterns were recorded at 17 eV.
Download figure:
Standard image High-resolution imageSince it is quite unexpected to observe apparently identical µLEED patterns for regions showing clearly different LEEM intensity, we performed dark field LEEM measurements in order to identify the different rotational and mirror domains. Using the six LEED diffracted beams marked by large coloured circles in figure 2(a), we recorded six dark field LEEM images. After optimising their black/white contrast and colouring (using the colour of the corresponding LEED beams in figure 2(a)) we superimposed all six images, resulting in the composite dark field image shown in figure 5(b). For comparison, figure 5(a) shows the same surface area in bright field imaging mode.

Figure 5. (a) Bright field LEEM image of a sample covered with the α-phase. Two different regions are visible: (i) regions appearing homogeneously bright contain some large compact islands and (ii) darker speckled regions contain many small islands surrounded by 2D-gas. Compared to figure 4(b) the contrast is inverted due to different imaging conditions. (b) Composite image of six dark field LEEM images recorded for the α-structure. Rotational and mirror domains are colour-coded cyan, blue, red, magenta, yellow and green, corresponding to the LEED diffracted beams marked with the same colour in figure 2(a). LEEM imaging conditions: overfocus, contrast aperture inserted, field of view 10 µm, (a) Ustart = 1 V, (b) Ustart = 5 V.
Download figure:
Standard image High-resolution imageThe composite image is very useful for understanding the contrast in the bright field image. It shows that the bright homogeneous regions in the bright field image represent compact islands, consisting of one or only a few domains, as can be seen from, e.g., the blue–cyan and green–yellow areas in figure 5(b). The darker, speckled areas in the bright field image, however, are not homogeneously filled, but contain a large number of small and very small islands of all six possible orientations (black areas in figure 5(b), speckled by many small coloured spots). In bright field LEEM the images of these small islands, mostly having sizes close to the resolution limit of our microscope, smear out and form a rather homogeneous dark-grey area; only the larger islands are visible as small white spots. In dark field, however, due to the strongly enhanced contrast, smaller islands are also visible as (coloured) spots, although their size is probably overestimated in the composite LEEM image by the image processing procedure. We conclude that the final stage of the sample is an inhomogeneous layer of the α-phase forming (i) rather compact, micrometer-sized islands that were formed from the β-phase by a continuous phase transition, and (ii) areas covered with a large number of much smaller α-islands that nucleated in the surrounding 2D-gas phase area.
We have performed several series of similar experiments for different initial K exposures, namely 20 min (the results of two such experiments are shown in figures 3 and 4), but also 15 min, 10 min and 5 min exposures. The schematic diagram of figure 6 summarises the conditions under which the different coadsorption phases are present on the surface as a function of TCNQ deposition time and for different predose times of K deposition. While all four phases were observed in experiments starting with a 20 min K deposition, as described in detail above, at lower initial K coverages (lower K deposition times) the more K-rich phases are no longer formed. A reduction of the K deposition time of 25% (see the 15 min series of figure 6) is sufficient to inhibit the formation of the δ-phase. In this case, the γ-phase forms first; this then transforms to β, and later to α, in a similar way to that shown above for the 20 min K deposition experiments. In a series starting from a 10 min K deposition only β and α-phase islands were found, while following an initial K deposition of 5 min only the α-phase is formed on the Ag(111) surface. This behaviour is consistent with the existence of a certain critical density of K atoms that must be exceeded in order to form a specific KxTCNQy mixed phase. For phases with higher x : y stoichiometry, the critical density is obviously also higher. In this sense, the behaviour is similar to other rather different mixed systems, e.g., to the hetero molecular PTCDA-CuPc system, the structural phase diagram of which was investigated in detail by Henneke et al [15].

Figure 6. Schematic diagram showing the relative occupation of different phases on the Ag(111) surface as a function of TCNQ exposure time for different K initial deposition times. Coloured bars mark the coverage regime in which each phase is present.
Download figure:
Standard image High-resolution image2.2.2. Deposition sequence: TCNQ first—K second, room temperature
A second set of experiments was performed inverting the deposition sequence, namely first TCNQ, followed by K. We performed these depositions with the sample at RT and at 160 °C. Figure 7 shows the results of RT deposition of K onto a Ag(111) surface covered by approx. 50% of a saturated (single) TCNQ layer. The sample was annealed after TCNQ deposition, so most of the molecules formed ordered islands of the LDC phase of Ag(111)-TCNQ, see above and reference [10] for more details. Figure 7(a) shows a LEEM image of this surface, prior to K deposition. LDC islands appear slightly brighter than the surrounding area. One large island is highlighted by the black circle, which also identifies the area used for the μLEED pattern shown in figure 7(e). As shown by the μLEED pattern, this micrometer-sized island is formed by only one single domain of the LDC phase, a consequence of island ripening during the post-deposition annealing of the TCNQ layer. The area around the LDC islands is covered by a disordered, 2D-gas-like phase [10, 11].
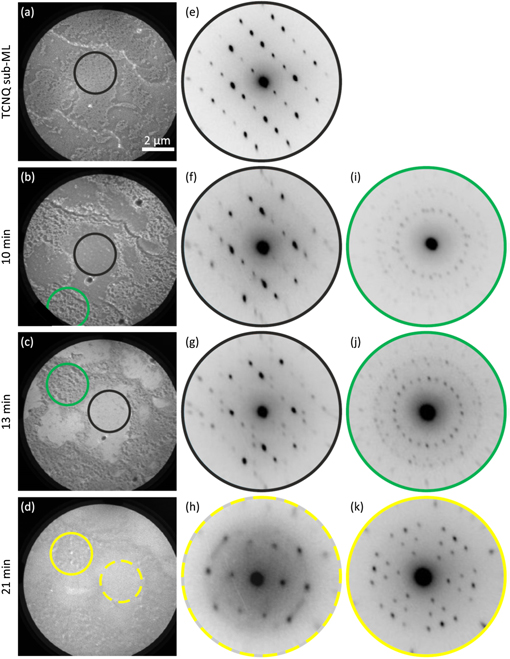
Figure 7. Series of (a)–(d) LEEM images and (e)–(k) μLEED patterns recorded during K deposition on a Ag(111) surface precovered with TCNQ. The K deposition time is given in the figure. The phases occurring are colour-coded black (pure TCNQ LDC phase [10]), green (α) and yellow (β). The coloured circles in the LEEM images mark the surface areas selected for recording the μLEED patterns. LEEM imaging conditions: field of view 10 μm, (a) slight underfocus, Ustart = 1.3 V, (b)–(d) overfocus, Ustart = 0.6 V. μLEED patterns were recorded at 17 eV.
Download figure:
Standard image High-resolution imageK was then deposited onto the sample at RT in three steps. Within the first 10 min, the LDC islands remain unchanged (as confirmed by LEEM and μLEED, see figures 7 (b) and (f)), but growth of small α-islands was observed within the TCNQ 2D-gas phase areas. The green circle in (b) marks such an area, and the corresponding μLEED pattern is shown in figure 7(i). An additional K deposition step of 3 min leads to no change in the structure within the LDC and the α-areas, as can be seen in μLEED (compare figure 7(f) with (g) and (i) with (j)). However, there is a clear increase in the LEEM intensity of the LDC island. The movie 'Fig7.avi' available in the SI shows very clearly that this change is associated with a reaction front running across the LDC island, from the edges towards its center. This marked change in LEEM intensity with no corresponding change in the μLEED patterns is surprising, implying that the change in LEEM intensity is not due to a change in structure. We propose that the growth front is of a potassium layer that is overgrowing the existing (and unchanged) TCNQ LDC island, the LEEM intensity change therefore being due to a corresponding change in work function rather than structure.
A third K deposition step of a further 8 min causes all ordered islands on the surface to transform to the β-phase, as proven by the µLEED patterns in figures 7(h) and (k). For the small α-islands (e.g. in the area marked in green in figure 7(c)) this is not very surprising, since the ongoing deposition of K shifts the K : TCNQ ratio towards higher values, i.e., more K-rich phases become stable. However, the transition of the TCNQ LDC islands into the β-phase without the formation of any intermediate α-phase is more surprising. We suspect that a direct phase transition from LDC to β takes place due to the K-reservoir, on top of the LDC island, accumulated during the previous deposition step. At RT, a small amount of K is evidently not able to destroy the rather stable LDC structure and form the α-phase, but a higher surplus of K is required to change the LDC structure. When the required K-surplus is reached, the stoichiometry is already in the β-phase regime, causing this phase to be formed directly. Note that the resulting β-phase islands are very large and single domain, like their LDC precursor islands (black and dashed yellow circle in figures 7(c) and (d), corresponding to μLEED patterns (g) and (h), respectively). Apparently, the domain size is conserved during this transition. This is consistent with the α-to-β phase transition retaining the multiple rotational and mirror domains structure of the original α-islands within the area used for μLEED (green and solid yellow circles in figures 7(c) and (d), μLEED images (j) and (k), respectively).
We conclude that at RT the deposition of K on a TCNQ precovered surface follows two different scenarios: (1) large pure TCNQ islands of the LDC phase transform directly into the K2TCNQ β-phase, and (2) in TCNQ gas-phase areas small islands of the intermediate α-phase form at much smaller K : TCNQ ratios, and transform to the β-phase at higher K concentrations. While the first scenario produces very large single-domain β-islands, mainly due to starting from large LDC domains (formed by annealing prior to K deposition), the second scenario leads to many very small islands with different orientations, since the nucleation of the α-phase from the 2D-gas regions forms only very small (single-domain) islands on the surface.
2.2.3. Deposition sequence: TCNQ first—K second, elevated temperature
One of the most remarkable findings reported in the previous section is the stability of the TCNQ LDC structure in the presence of small K concentrations; at RT LDC islands do not transform to the α-phase, but directly to the β-phase at much higher K concentrations. As we show in this section, this inhibition of the LDC-to-α phase transition is lifted at higher temperatures.
In this series of experiments the Ag(111) surface was first exposed to TCNQ flux for 50 min at a sample temperature between 230 °C and 240 °C, at which no ordered islands form, but upon cooling nucleation of single domain LDC islands occurred at approximately 175 °C. The nucleation process is clearly seen in the LEEM movie 'LDC-nucleation.avi' available in the SI.
While keeping the sample at 160 °C, potassium was then deposited onto the surface, initially leading to the formation of large single-domain α-phase islands. Figure 8(a) shows the surface in this stage, with all dark areas being α-phase islands (green arrows). Small remaining 2D-gas phase areas are present and appear very bright in LEEM (white arrow in figure 8(a)). No ordered LDC TCNQ islands remain. This indicates that at 160 °C the LDC structure is unstable in the presence of K and the transformation to the α-phase is then facile, contrasting with the behaviour at RT.

Figure 8. Series of LEEM images recorded during K deposition on a TCNQ-precovered Ag(111) surface at 160 °C. The K deposition time is given in the figure. The phases present are indicated by colour-coded arrows white (2D-gas), green (α) and yellow (β). LEEM imaging conditions: in focus, Ustart = 0.6 V, field of view 10 μm.
Download figure:
Standard image High-resolution image
Further deposition of potassium causes the formation of the β-phase, starting in the small remaining 2D-gas phase areas. The β-phase islands appear almost black, initially appearing as small blots in the white 2D-gas phase area, and rapidly transforming this whole area; this is most clearly seen in the movie 'Fig8.avi', available in the SI. The α-islands, before they also transform into β, became brighter, due to adsorption of potassium on top of them and the resulting work function decrease, compare figures 8(a) and (b). In contrast to K adsorption on LDC islands at RT, which led to a growth front moving across the island (see above), in this case the change of the brightness proceeded continuously, most likely due to a higher mobility of the K atoms at elevated temperatures. When a sufficiently high K concentration is reached, the α-phase islands start transforming to the β-phase, exhibiting a clearly visible reaction front that starts from the edges of the α-phase islands, where the β-phase already exists in the former 2D-gas phase areas, see figure 8(c) and the movie 'Fig8.avi', available in the SI. We conclude that elevated temperatures not only lift the inhibition of the LDC-to-α phase transition, but also cause the formation of large single-domain α-islands, the size and single-domain character of which is conserved when they transform to the β-phase.
3. Summary and conclusion
Our investigation of the growth and evolution of several KxTCNQy phases on Ag(111) in-situ following the two alternative deposition sequences of K and TCNQ identified four sub-monolayer coadsorption phases with different stoichiometries. Beside the incommensurate α-phase (KTCNQ) and the commensurate β-phase (K2TCNQ), which were already reported earlier [10, 11], we found two new phases γ and δ with higher K : TCNQ ratios, and followed the phase transitions occurring upon K or TCNQ deposition.
When depositing TCNQ on a surface precovered with K, a sequence of phase transitions was observed involving all four phases, from the most K-rich δ-phase to the most TCNQ rich α-phase. One interesting observation is that the δ-phase is comparably stable; it does not transform into the γ-phase upon TCNQ deposition. Instead, γ-phase islands nucleate additionally on the surface, and transform into β-islands before the δ-islands are affected. Only very late in the TCNQ deposition, when the overall ratio of deposited potassium atoms and TCNQ molecules already corresponds to the stoichiometry of the α-phase, do both β and δ-islands transform to the α structure. Furthermore, we found that the formation of the K-rich phases depends on the amount of initially deposited potassium. With less and less K available, the formation of δ-, then γ- and finally β-islands are inhibited. This behaviour is consistent with recent findings for a hetero-molecular model system: Henneke et al [15] reported a structural phase diagram for mixed structures formed by PTCDA and CuPc molecules on Ag(111). The key finding was that the stability of the mixed molecular phases is determined by the density of a 2D-gas phase surrounding the ordered phases. This 2D-gas phase acts as a reservoir for one of the components (CuPc in that case). Critical densities exist for this reservoir, which have to be exceeded in order to allow specific phases to be formed. The system described here behaves similarly in the sense that a critical concentration of potassium must be present to enable the formation of the K-rich phases. However, the KxTCNQy system also appears to be more complex, for example in the superior stability of a certain phase (the δ-phase, see above), which was not found for the hetero-molecular model system. A possible reason for this is that the PTCDA-CuPc phase diagram has been observed in thermodynamic equilibrium, contrary to our RT study of the KxTCNQy system.
Experiments applying the reverse deposition sequence (TCNQ first, K second) produce ordered TCNQ phases in their early stage (before K deposition), in particular the 'lower density commensurate' (LDC) pure TCNQ phase. Upon K deposition, the KxTCNQy α and β-phases occur, the most TCNQ-rich α-phase first, the β-phase afterwards. The γ and δ-phases were not observed. Moreover, the stability of one phase, the pure TCNQ LDC phase, influences the sequence of transitions; at RT, no phase transition from the LDC phase to α was observed. As a consequence of this frustrated transition, a potassium 'reservoir' forms on top of the TCNQ LDC layer (in the form of a K film overgrowing the molecular layer). At a later stage (i.e., at a sufficient K concentration) the LDC islands transform directly into the β-phase, conserving the single domain structure of the micrometer-sized islands. Within TCNQ 2D-gas phase regions located next to the LDC islands, however, very small α-islands nucleate already at small K concentrations, and quickly transform into β-islands of similar (small) size. The frustration of the LDC-to-α transition can be lifted by raising the temperature, as a second series of in-situ LEEM experiments performed at 160 °C has revealed. In this series, LDC transforms to α, which in turn is overgrown by potassium before it transforms to the β-phase. The single crystallinity of the islands is also conserved in this case.
In conclusion, we have comprehensively studied the occurrence and evolution of the mixed phases formed by coadsorption of potassium and TCNQ on Ag(111). Besides finding two more phases (γ and δ), we characterised the phase transitions occurring for this interesting acceptor–donator model system, which is of principal relevance for tuning and designing the electronic properties of devices based on organic semiconductors.
Acknowledgments
J F and C K acknowledge financial support by the Deutsche Forschungs Gemeinschaft (DFG) through the collaborative research centre SFB 1083. P J B acknowledges financial support from Diamond Light Source and EPSRC.
Footnotes
- 7
The 'start voltage' Ustart corresponds to the kinetic energy at which the electrons interact with the sample surface. An electrostatic field applied between the objective lens and the sample surface decelerates the high energy electrons (20 kV) down to the 'start energy' just before they hit the sample. The same field accelerates the backscattered electrons again, and draws them into the imaging electron optics. For sensitive samples, start energies below 5 eV are often used since radiation damage plays a minor role at these electron energies.