


Abstract
Elemental materials made up from just one type of element is more unpredictable than people usually think at pressures. For examples, alkali metals are reported to transform into insulator firstly and then reenter into metallic state with pressures. Here, we have deeply investigated the structures and electronic properties of elemental phosphorus under high pressure. The phase sequence of phosphorus is improved, and two new close-packed structures are proposed to be stable beyond 350 GPa. Strikingly, for the insulate phosphorus at ambient pressure, the feature of pressure-induced metallization and subsequently reentrant insulativity with pressures is deduced, which is opposite to the evolutionary electronic structures in alkali metals upon compression. Furthermore, the electronic density of states at Fermi level is disclosed to dominate the variation trend of electron–phonon coupling strength and superconducting critical temperature.
Export citation and abstract BibTeX RIS

Original content from this work may be used under the terms of the Creative Commons Attribution 4.0 licence. Any further distribution of this work must maintain attribution to the author(s) and the title of the work, journal citation and DOI.
1. Introduction
Many elemental materials are usually discovered in simple crystal lattice, e.g. cubic or hexagonal lattice at ambient pressure. Alkali metals and group 5, 6 elements, as we know, can crystallize into body-centered cubic lattice under room pressure. Some alkali-earth metals take close-packed structures, for examples, Ca, Sr, Ba, and Be, Mg can crystallize into face-centered cubic and hexagonal lattice, respectively. Except alkali-earth metals, some elemental materials (e.g. Al, Sc, and group 4, 10, 11 elements) also stack to close-packed structures [1]. However, elemental materials cannot always keep the simple crystal lattice up to high-pressure environment, and transform into various complex structures companied with significant changes of their physical and chemical properties. Under high pressure, the incommensurate modulation structures have been observed in many elements, Rb, Ba, Sr, Sc, P, As, Sb, and Bi [2–8]. Certain elements have found to become superconducting at sufficient pressure, i.e. 29 K at 216 GPa for Ca, 8.2 K at 74.2 GPa for Sc, 17 K at 89 GPa for Y, though they are not superconducting at ambient pressure even down to mK temperatures [9–14]. Besides, some metallic solid even exhibited the strikingly pressure-induced antimetallization, i.e. Li and Na will transform into insulating states at 80 GPa and 120 GPa, respectively [15–17].
For the familiar element in the group 15, phosphorus is an indispensable ingredient for life together with carbon, hydrogen, nitrogen, oxygen, and sulfur [18, 19]. And it is essential to explore whether extra-terrestrial life exists on other planets, in which the pressure may reach up to hundreds of gigapascal (GPa) and even terapascal (TPa) [20, 21]. As we discoursed above, such extreme pressures can trigger abundant structural phase transitions and significant changes of physicochemical properties in materials. Recent investigations on phosphorus have focused on the pressures below 300 GPa. Structurally, phosphorus adopts the orthorhombic Cmca (P-I) structure at ambient environment [22, 23], then transforms into the semimetallic R-3m phase (P-II) at 4.5 GPa and to the simple cubic Pm-3m phase (P-III) at 10 GPa [24]. According to the experiment data obtained by Akahama et al, Pm-3m is the stable form of phosphorus up to 107 GPa, then it transforms into the simple hexagonal P6/mmm phase (P-V) at 132 GPa via an incommensurate modulation phase, Cmmm(00γ)s00 (P-IV)[5, 25–27]. With increasing pressure, P6/mmm undergoes a structural transition to the body-centered cubic Im-3m structure (P-VI) at 262 GPa [28]. Mikhaylushkin et al further proposed that Im-3m transforms into a hexagonal close-packed (HCP) structure via an intermediate phase, nevertheless, the HCP structure has not been expounded [29]. Recently, Sugimoto et al claimed a superlattice structure with the space group I-43d to be the candidate for P-VI. The maximum pressure of x-ray diffraction experiment for phosphorus reaches up to 340 GPa in the current experiments [30]. However, physical properties study for I-43d is absent in the paper. Aside from the unusually abundant structural phase transitions, the superconductivity has also been investigated experimentally and theoretically at the pressures lower than 150 GPa [31–40]. And the anomalous pressure-dependent superconductivity has been deeply investigated [35, 37–39].
In this paper, we have extensively explored the candidate structures for phosphorus at extreme pressures of terapascal. Two close-packed structures of P63/mmc and Fm-3m are predicted at higher pressures. New phase sequence of phosphorus is proposed by investigating the structure stability of all proposal phases. Electronic structures, phonon dispersions, and superconductive behaviors of the structures including the I-43d phase are deeply investigated. The tendency of pressure-induced reentrant insulativity in phosphorus has been disclosed, and the electronic density of states at Fermi level is demonstrated to be the main contributor to the variation in electron–phonon coupling (EPC) strength and Tc.
2. Computational methods
We utilize the ELocR code to probe the structures of phosphorus under high pressures [41, 42]. The structural relaxation is performed with the Vienna ab initio simulation package within density-functional theory using the Perdew–Burke–Ernzerh of generalized gradient approximation [43–45]. The 'hard' PAW pseudopotential is adopted and the 3s23p3 electrons are treated as valence electrons. A plane-wave cutoff of 1000 eV and appropriate Monkhorst–Pack k-meshes are employed with the resolution of 2π × 0.025 Å−1 for Brillouin zone (BZ) sampling to ensure that all the enthalpy calculations are well converged to less than 1 meV per atom. The property of electronic structures is rechecked by CASTEP [46].
The phonon and electron–phonon calculations are carried out by QUANTUM-ESPRESSO code [47]. Ultrasoft pseudopotentials with an energy cutoff of 60 Ry and Brillouin zone (BZ) sampling grid of spacing 2π × 0.025 Å−1 are adopted to ensure the convergence of the energy less than 10−8 Ry. For the electron–phonon interaction matrix element, the q-point meshes of 6 × 3 × 5 for P6/mmm, 8 × 8 × 8 for Im-3m, 4 × 4 × 4 for I-43d, 6 × 6 × 3 for P63/mmc, and 6 × 6 × 6 for Fm-3m in the first BZ are chosen, respectively. Moreover, the reliabilities of pseudopotentials are tested by the comparison of Birch–Murnaghan equation of states (see figure S1 in supplementary material is available online at stacks.iop.org/NJP/22/033011/mmedia), and the reliabilities of computational methods are checked by comparing the x-ray diffraction patterns and enthalpy difference curves in lower pressure range (0–260 GPa) with previous works (see figures S2 and S3 in supplementary material).
3. Phase sequence of phosphorus under pressure
We explore the high-pressure structures of phosphorus by the ELocR structure searching method in conjunction with first principle calculations. At 350 GPa, the HCP structure P63/mmc with two P atoms in the 2d Wyckoff positions is obtained, and its conventional structure with 2 × 2 × 1 is shown in figure 1(a). The distance between the two P atoms in the primitive cell is 2.104 Å. At 1.5 TPa, a face centered close-packed Fm-3m structure is found to be the stable phase of phosphorus (figure 1(b)). There are twelve nearest-neighbor atoms around each other with a distance of 1.783 Å.
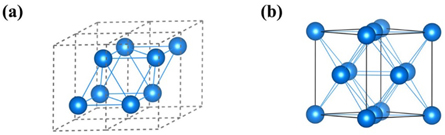
Figure 1. Structures of phosphorus. (a) P63/mmc at 350 GPa, (b) Fm-3m at 1.5 TPa.
Download figure:
Standard image High-resolution imageThe total energy for different phases, the structures presented by predecessors and the two close-packed structures we proposed have been calculated. It is worth mentioning that the incommensurate phase is replaced by the Imma structure proposed by Rajeev Ahuja, owing to the nearly isoenthalpic feature of them [48]. The enthalpy difference curves, which are relative to Im-3m as a function of pressure, are presented in figure 2(a) and figure S4. Afterwards, we obtain a new phase sequence of phosphorus in 150 GPa –2 TPa as plotted in figures 2(d) and (e). Below 220 GPa, P6/mmm is the stable form of phosphorus, and in the pressure range of 220–250 GPa, Im-3m structure is adopted. With pressurization, Im-3m transforms into P63/mmc at about 325 GPa via the superlattice structure I−43d. Ultimately, P63/mmc transforms into Fm-3m, as displayed in figure 2(a) insert. The phase sequences given by previous studies are shown as figures 2(b) and (c). They regarded Im-3m or I-43d as the most competitive structure of phosphorus above 262 GPa, respectively. As for our work, at about 250 GPa, Im-3m transforms to the I-43d structure then attains P63/mmc at about 325 GPa. Lacking of the total energy calculation of I-43d is the main reason of the difference of phase sequence between this work and previous studies.
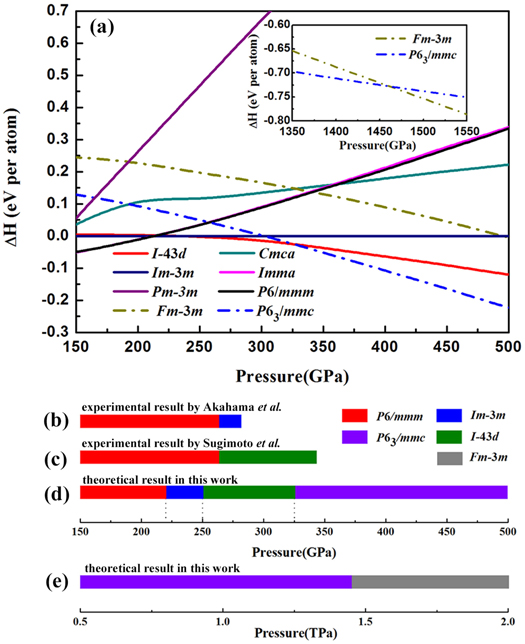
Figure 2. (a) Enthalpy difference per atom as a function of pressure. Dashed dotted lines: the two close-packed structures we predict; Solid lines: the structures reported by predecessors [5, 22–30]. Insert: enthalpy difference for P63/mmc and Fm-3m in the pressure range 1.35–1.55 TPa, where P63/mmc transforms into Fm-3m. (b) and (c) are the experimental results of the phase sequence in phosphorus above 150 GPa given by Akahama et al and Sugimoto et al respectively [28, 30]. (d) and (e) are the phase sequences we predicted in this work.
Download figure:
Standard image High-resolution imageThe stabilities of two close-packed structures we proposed in this work and I-43d given by Sugimoto et al are evaluated by calculating the elastic constants and phonon dispersion curves. The calculated elastic constants of matrix Cij meet the Born–Huang stability criteria (table 1), indicating the mechanical stabilities of the phases [49–51]. Meanwhile, the phonon dispersion curves along several high symmetry directions in the first Brillouin zone have been calculated, as shown in figure 3. Apparently, all the structures with no imaginary frequencies in the whole Brillouin zone demonstrate their dynamical stabilities. The analyzes of elastic constants and phonon structures reveal the same stable pressure ranges with the thermodynamically stable pressure ranges.
Table 1. The elastic constants Cij (GPa) for I-43d, P63/mmc and Fm-3m at 300 GPa, 350 GPa and 1.5 TPa, respectively.
| Structure | C11 | C33 | C44 | C66 | C12 | C13 |
|---|---|---|---|---|---|---|
| I-43d | 9038 | 2119 | 5863 | |||
| P63/mmc | 1449.14 | 1830.36 | 285.51 | 197.73 | 1053.67 | 746.62 |
| Fm-3m | 5722.02 | 2242.99 | 3281.27 |
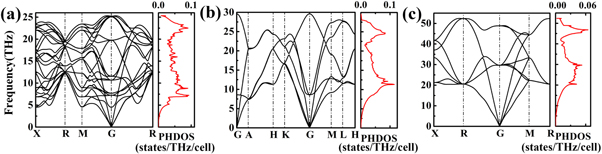
Figure 3. The phonon band structure and phonon density of states (PHDOS) charts. (a) I-43d phase at 300 GPa. (b) P63/mmc phase at 350 GPa. (c) Fm-3m phase at 1.5 TPa.
Download figure:
Standard image High-resolution image4. Pressure-induced metallization and reentrant insulativity
Elemental materials may exhibit peculiar properties under high pressure, e.g. the alkali metals are reported to possess unexpected electronic behavior at high pressures [52–54]. Here, we predict the tendency of pressure-induced reentrant insulativity character of phosphorus, while it is opposite to the reentrant metallicity of lithium and sodium at high pressures. Lithium (Li) and sodium (Na), the familiar alkali metals, are known to possess simple electronic structures at ambient pressure that are well explained by a nearly free-electron model. With the increasing pressure, the metal-insulator transition appears, at about 80 GPa for lithium and 200 GPa for sodium, respectively [17, 52]. With further compression, both of them revert to metal. Semiconducting lithium is affirmed to revert to 'poor metal' above 120 GPa [53] and sodium is reported to reenter into metal at a surprisingly high pressure of 15.5 TPa [54]. While as for phosphorus, which own the insulate state at ambient pressure, might undergo the pressure-induced insulator-metal-insulator transition and is further substantiated by the electronic density of states, three-dimensional Fermi surface and the electron localization function.
Figures 4(a) and (b) present the calculated electronic projected density of states of P63/mmc and Fm-3m at different pressures. Comparing with the semiconducting phase at 1 atm, as expected, the pressure-induced metallization happens and phosphorus shows the nearly free-electron metallic feature. The pressure dependency of density of states at the Fermi level (N(EF)) is plotted in figure 5(d). Obviously, above 150 GPa, N(EF) first rises and reaches a maximum value of 0.29 electrons/eV/atom at about 250 GPa, then declines to 0.11 electrons/eV/atom at 2 TPa. Three-dimensional Fermi surfaces of HCP phase are calculated to verify the downward of N(EF) in the corresponding pressure range. As shown in figures 4(c) and (d), there are four electronic bands across the Fermi surface at selected pressures. From 350 GPa to 1 TPa, the variation trend of the two bands identified by pink and navy blue surrounded by yellow color shrinks is consistent with the decreasing of N(EF). Furthermore, N(EF) descends with increasing pressure and should vanish near 4 TPa by the extrapolation of N(EF) in figure 5(d), which indicates that phosphorus would reenter into insulate state by higher pressure. The variation of metallicity can be interpreted by the calculated electronic localization function shown in figure 6. It is noteworthy that the localized electrons vary obviously with pressure. At ambient pressure (figure 6(a)), the electrons are localized between two P atoms. As pressure is up to 250 GPa (figure 6(b)), green area appears in the interstitial region which symbolizes the pressure-induced metallization. Upon compression, the localized electrons first decrease and almost vanish at about 650 GPa, and then keep ascending when up to 2 TPa, which implies the tendency of pressure induced antimetallization above 650 GPa (see figures 6(b)–(d)). The similar metal-insulator transition in Li and Na is reported as originating from the localization of valance electrons in the voids of crystal [17, 52].
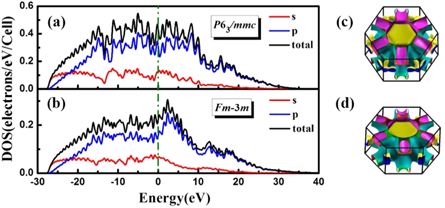
Figure 4. The electronic projected density of states of (a) P63/mmc at 350 GPa and (b) Fm-3m at 1.5 TPa. Three-dimensional Fermi surface of P63/mmc at (c) 350 GPa, (d) 1 TPa, respectively.
Download figure:
Standard image High-resolution image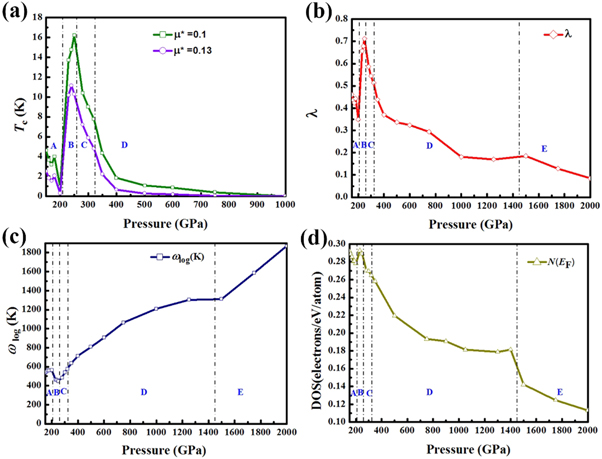
Figure 5. (a) Tc as a function of pressure. A, B, C and D represent P6mmm, Im-3m, I-43d, and P63/mmc, respectively. (b) electron–phonon coupling λ, (c) logarithmic average phonon frequency (ωlog), (d) normalized DOS at the Fermi level (normalized N (EF)) as a function of pressure. A, B, C, D and E represent P6mmm, Im-3m, I-43d, and P63/mmc and Fm-3m, respectively.
Download figure:
Standard image High-resolution image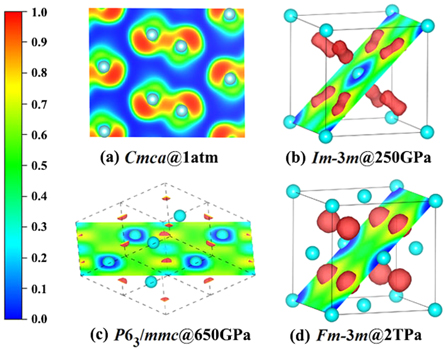
Figure 6. Calculated electron localization function (ELF) at different pressures. Red isosurfaces of ELF in (b)–(d) corresponding to the value of 0.73. The cyan balls represent P atoms.
Download figure:
Standard image High-resolution image5. Effect of electronic properties on superconductivity
As is well-known, the electronic properties play an important role in determining the EPC and superconductivity. Then the effect of electronic properties on EPC λ and superconductivity of phosphorus are investigated. The superconducting transition temperature (Tc) can be estimated by utilizing the Allen–Dynes-modified McMillan equation [55]:

and the formula defined in McMillan's strong coupling theory is adopted to understand the relations between EPC λ and N(EF) [56]:

where M is the atomic mass, N(EF) is for a single spin (i.e. one-half of the value shown in figure 3, which is for both spins),  represents the average over the Fermi surface of the electron–phonon matrix element. Tc as a function of pressure (for two values of μ*) is presented in figure 5. With the increasing pressure, Tc first declines, then climbs and reaches to a maximum value at about 250 GPa, and then descends to 0 K at about 1 TPa. Above 1 TPa, Tc remains 0 K and this is mainly attributed to the weakly EPC, as shown in figures 5(a) and (b). At 150 GPa, the Tc value (μ* = 0.1) by our calculation agrees well with the value predicted by Nakanishi et al [36] The tendency of Tc has been analyzed by the variations in λ and ωlog as a function of pressure and is shown in figure 5. Notably, the variation tendency of Tc is considered to be dominated by EPC λ owing to the similarity tendency between EPC λ and Tc. Taking account of figures 5(b) and (d) along with equation (2), we can understand the qualitative behavior of λ with increasing pressure. N(EF) reaches the maximum value in Im-3m phase at about 250 GPa, which is higher than the values in other phases. Meanwhile, the variation trends of EPC λ resemble the cases of N(EF) in all phases. And N(EF) is considered to be an important factor to the electron–phonon interaction for the similar tendency between EPC λ and N(EF) with pressure. Thus, N(EF) is the dominant factor for the variation trends of EPC λ and Tc.
Furthermore, we have plotted the phonon dispersions, Eliashberg spectral function α2F(ω) and EPC λ at 350 GPa for P63/mmc in figure 7. As shown in figure 7 left, we have projected EPC λ on each vibration mode and represent it by the radius sizes of green solid balls. Strikingly, strong EPC exists along the Brillouin zone L–M–H and G–A. EPC λ is mainly contributed by these regions. What's more, the strength of EPC along G–A is stronger than that along G–L and G–K. It means that the vibration modes along the different directions through G point make disparate contributions to the EPC.

Figure 7. The phonon dispersion (left), Eliashberg spectral function α2F(ω) and electron–phonon coupling strength λ (right) calculated at 350 GPa for P63/mmc. Circles in left indicates electron–phonon coupling with the radius proportional to their respective strength.
Download figure:
Standard image High-resolution image
6. Conclusion
In summary, we have explored the candidate structures for phosphorus above 150 GPa by utilizing ElocR along with density functional total energy calculations. Two close-packed structures P63/mmc and Fm-3m are found to be stable in 350 GPa–1.45 TPa and above 1.45 TPa, respectively. The electronic structures analysis shows the favorable metallicity of both the two close-packed structures. Interestingly, with the pressure increases, N(EF) first declines, then climbs and reaches a maximum value at about 250 GPa, and then keep descending. More analyzes of N(EF) implies that phosphorus may transforms into insulate state at about 4 TPa. The tendency of pressure-induced reentrant insulator character of phosphorus is totally different from the reentrant metal feature of lithium and sodium at high pressure. What's more, the variation tendency of superconducting critical temperature agrees well with the trend of N(EF), and the N(EF) is considered to be the main factor which dominates the variations of EPC λ and Tc under pressure.
Acknowledgments
This work was supported by the National Key R&D Program of China (No. 2018YFA0305900), the National Natural Science Foundation of China (Nos. 51632002, 51572108, 91745203, 11634004, 11174102, 11774119, 11904187), National Key Research and Development Program of China (2016YFB0201204), Program for Changjiang Scholars and Innovative Research Team in University (No. IRT_15R23), National Found for Fostering Talents of basic Science (No. J1103202), Doctoral Scientific Research Foundation of Inner Mongolia University for Nationalities (No. BS480). Parts of calculations were performed in the High Performance Computing Center (HPCC) of Jilin University.