


Abstract
Binding of two complementary DNA single strands to a double-helix, DNA hybridization, is a sequence specific molecular recognition process that plays important roles in biology and biotechnological applications. In the past much work has been devoted to understand double helix formation, however, DNA binding in complex situations often remains difficult to deal with. Here we use fluorescence anisotropy to assess the binding affinities of DNA oligonucleotide strands that compete for hybridization to the same probe molecule in thermal equilibrium. We find that the ratio of the binding constants in competition can change substantially compared to pairwise assessments. This is a signature of non-trivial interaction among the competitors: the binding microstates of each strand are affected by the presence of the other, but to a different degree. To our knowledge this type of phenomenon is not included in current equilibrium models of oligonucleotide binding. We suggest interactions beyond double helix conformations to cause the observed cooperative behavior. The cooperativity could produce more complex binding phenomena than previously thought.

Original content from this work may be used under the terms of the Creative Commons Attribution 3.0 licence. Any further distribution of this work must maintain attribution to the author(s) and the title of the work, journal citation and DOI.
1. Introduction
DNA hybridization, double helix formation from two single strands, plays an important role in biology, bioengineering and nanotechnology. Because of highly specific, sequence-dependent recognition DNA hybridization has many applications, encompassing DNA-based computing [1–6], DNA hybridization catalysis [7–9] and the physical realization of nanodevices and nanocircuits [10–13]. In the latter DNA displacement reactions where a hybridizing strand removes an already bound one often play a role [3, 14–18].
The thermodynamics of DNA hybridization has been studied at length using many different techniques among them UV absorption, isothermal urea titration, microcalorimetry [19–21] and gel electrophoresis [3, 22–25]. DNA duplex stability arises from hydrogen bonding and base stacking interactions that encompass van der Waals-, electrostatic- and hydrophobic interactions between adjacent base pairs. The well-established nearest-neighbor (NN) model considers that the energy of a nucleic acid duplex is the sum of these NN interactions [26–28]. The empirical NN helix propagation parameters (one for each of the 10 possible base-pair doublets) serve to predict the binding free energy of a particular duplex sequence. Other parameters provide corrections for duplex initiation, AT terminal pairs, or a symmetry penalty in case of self-complementary sequences. The NN model adequately predicts oligonucleotide duplex melting temperatures in bulk solution [29]. Elaborate datasets of Watson–Crick NN parameters [30] provide the basis for nucleic acid secondary structure—or melting temperature prediction software as for instance the DINAMelt web server [31] or Mfold [32]. Since these software packages are semi-empirical, scope and precision of the underlying data do matter. For instance if chemical modifications or fluorophores are added or temperature range and buffer conditions are changed, the accuracy of predictions is reduced [17–19, 22, 33, 34]. Nupack [35], used in our study, is one of the latest packages for quantitative prediction of the free energy of DNA hybridization in thermal equilibrium.
Oligonucleotide hybridization also occurs with sequences that include a single mismatched (MM) base pair. Duplexes with mismatches are less stable than their corresponding perfect matches (PM) [36, 37]. Hybridization of mismatched strands studied in confined geometries akin to biological cells revealed that under the studied conditions at least seven contiguous base pairs are needed for rapid duplex formation [38]. The single base pair mismatch-discrimination capability of short (20 nt) oligonucleotide probes provides an important diagnostic tool for the detection of point-mutations and single nucleotide polymorphisms (SNPs) [39]. The NN model can be extended beyond the Watson–Crick pairs to include single base MM defects [29, 40]. A single mismatch is predicted to have a strong impact on the stability of short oligonucleotides, typically a reduction of binding affinities by a factor of about 1000 for the oligonucleotides from our study. However, experiments aimed at the detection of single mismatches could not achieve this discrimination factor, deviating by typically two orders of magnitude (see [22] and references therein). Enthalpic energy penalties can be used to improve molecular recognition accuracy [41, 42]. In spite of many excellent predictions there are cases where NN based models do not provide the expected results, and possible improvements remain a topic of discussion [43–45]. Camunas-Soler et al [46] considered irreversible unbinding of binding complexes with multiple bound states and showed how to extract corresponding free binding energies using fluctuation theorems.
Molecular dynamics (MD) simulations are a valuable tool to investigate DNA dynamics, thermal fluctuations and hybridization for instance for DNA hybridization and mechanical properties of DNA e.g. the persistence length in the presence of surfaces [47–49]. Since the solvant needs to be included, MD simulations require considerable computation power. Accordingly the creation of simple equilibrium models extends far beyond academic interest.
In the past we experimentally and theoretically investigated the effect of single MMs on duplex stability, using oligonucleotide DNA microarrays in cases where the lengths of probe and target match [50–52]. We showed that a double-ended molecular zipper model [53, 54] could successfully reproduce our observations in great detail [52].
We use fluorescence anisotropy (FA), a method to address oligonucleotide binding in solution. The technique is useful in clinical domains for detection of drugs or toxins in food. In biology FA enables the study of molecular binding among DNA strands and/or proteins [55–61]. A FA measurement relies on the increase in emission polarisation anisotropy of fluorescently labeled molecules as a measure of the slowdown of Brownian rotation caused by formation of molecular complexes. Since DNA becomes much stiffer upon duplex formation decreasing rotation considerably, FA is well suited for the detection of helix formation [60, 62–64]. DNA oligomers of reduced length exhibit faster thermal motion leading to reduced fluorescence anisotropy. A common approach to enhance the signal-to-noise ratio if small molecules are involved is to increase the molecular volume through DNA-binding proteins or nanoparticles. However, sometimes this strategy renders the interpretation of the observed anisotropy more difficult [25, 56, 62–64]. Moreover the influence of the particular fluorophore, the choice of an appropriate labeling site and the interaction between fluorophore and binding partner are factors that need to be considered.
For our work we also use fluorescence correlation spectroscopy (FCS) to study binding by considering the slow-down of diffusion if a free oligomer hybridizes to a longer and slower strand. This technique detects binding in bulk independently of the thermal rotation of the fluorescent label.
The advantage of using fluorescent techniques rather than more classical techniques as for instance UV absorption or calorimetry is that we can target defined molecular species, enabling us to study hybridization in competition where more than two species are involved. Moreover fluorescent techniques can give precise informations about the molecular binding conformations.
Here we address the hybridization of two targets consisting of short DNA sequences (12–16 bases) that compete for binding to the same probe. Competition for binding occurs in the cell for instance in homologuous recombination or RNA interference. It also plays a role in biotechnology, for instance for in situ hybridization or DNA microarray detection. It is generally believed that binding constants from pairwise assessment are sufficient to describe competitive binding [65, 66]. Here we find that binding in presence of a competitor cannot always be derived from the individual binding constants of the competitors. We conclude on a subtle interaction among the two competitors that changes the effective binding affinities, that is, the energy distribution of the accessible binding microstates so that not only the binding free energies change in presence of the other strand, but to a different degree depending on the nature of the competitors. This type of cooperative interaction of binding molecules may have far reaching consequences since it enables complex, cooperative behavior.
2. Material and methods
2.1. Sequences
We investigate the DNA sequences shown in tables 1 and 2. Since MMM from set 2 binds only weakly to the probe, the variation in anisotropy in the studied concentration range is smaller. We therefore prolonged MMM by adding 100 thymine bases to 3' end. To make our results comparable, we prolonged the other targets, MME and PM (but not the probes), in experiments without competition in the same way. Set 1 and set 2 are studied at room temperature and at 44 °C, respectively. The samples are prepared in 5xSSPE buffer. In this study all single stranded DNA is HPLC-purified (Metabion, Germany). The ssDNA from set 1 is labeled with Atto 532, set 2 with Cy3.
Table 1. Set 1, including probe P, S1, S2, and , the latter exhibit 3 and 4 bases of overlap with S1 on the probe (marked in red).


| Name | Sequence |
|---|---|
| P | 5'-CGTACAAGCTACTGACCTACTTA-3' |
| S1 | 5'-TAGCTTGTACG-3' |
| S2 | 5'-TAAGTAGGTCAG-3' |
| S | 5'-TAAGTAGGTCAGTAG-3' |
| S | 5'-TAAGTAGGTCAGTAGC-3' |


Table 2. Set 2, including probe P, perfect match PM, MMM and MME with a mismatch in the center, or towards the end (marked in red).
| Name | Sequence |
|---|---|
| P | 5'-TTACGATCTGATCCTT-3' |
| PM | 5'-AAGGATCAGATCGTAA-3' |
| MMM | 5'-AAGGATCACATCGTAA-3' |
| MME | 5'-AAGGATCAGATCGCAA-3' |
2.2. Fluorescence anisotropy (FA) technique
Fluorescence anisotropy uses linearly polarized light that stimulates fluorescent labels with their dipole moment oriented in parallel to the excitation polarization. The polarization of the emitted light depends on how far the molecules rotate during the lifetime of their excited state. As two molecules bind, their thermal rotation slows down and the anisotropy of the emission increases. This can be used to determine the binding affinity of two interacting DNA strands by labeling one of the two strands with a fluorophore and varying the concentration of the other. The corresponding change in anisotropy depends on the fraction q of bound fluorescent molecules, which in turn is determined by the binding affinity (see model section for further details). For good sensitivity the lifetime of the fluorophore must be comparable to the rotational correlation time of a molecule, around 6 ns for a 12-mer DNA strand [67]. This is indeed comparable to the lifetime of most fluorophores (0.1–10 ns). The Perrin equation relates the characteristic rotational correlation time and the fluorescent lifetime to the polarization anisotropy of the emission [55].
To measure the fluorescence anisotropy we use a home-built setup (see supporting information1 ), following the standard experimental scheme in [55] to detect the parallel (I∥) and perpendicular () polarization components of the emission light in two different channels. The anisotropy r is given by


The grating factor g is defined as the ratio of the detector sensitivities for the horizontal and vertical polarization components of emitted fluorescence intensity. A standard error can be obtained by error propagation using the 2 fold standard deviations of I∥and . To improve the signal-to-noise ratio we employ a lock-in amplifier. The relative error of anisotropy decreases from 72% without lock-in to 4% at the integration time of 300 s (see supporting information (see footnote 1)). For measurement of the data presented in this manuscript we set the integration time of the lock-in amplifier to 20 s. We record the output from the lock-in amplifier over timescales of the order of 10 min. Plotting the autorcorrelation function reveals a complete loss of correlation within 50 s. We average the signal over intervals of 50 s to extract our data points. We determine the statistical error of their mean, considering the data points as statistically independent. In the graphs we show the corresponding 95% error as bars. Note that relative errors appear to be larger in measurements with small changes in anisotropy. In practice the absolute values of anisotropy for the same case in different measurements vary to a minor degree, depending on optical alignment, lock-in settings and other technical factors impacting the measurement. For this reason, we base our results solely on relative changes in anisotropy.

2.3. Fluorescence correlation spectroscopy technique
FCS detects the fluorescence intensity fluctuations of labeled molecules that diffuse through the volume of observation, i.e. the focal volume of the objective (40× C-Apochromat, Zeiss, Germany). We deduce the binding constant from changes in diffusion time of the labeled strand as a function of the concentration of its unlabeled binding partner [68]. The characteristic diffusion times for a free, labeled strand and a bound strand are determined first. For each case we fit the autocorrelation functions and to the single-component expression


where Ni is the number of molecules in the focal volume. A mixture of both states, bound and unbound, occurs if the concentration of the unlabeled binding partner is varied within a suitable range. The corresponding correlation functions are fitted to the two-component expression

Here and correspond to the previously determined diffusion times. The fraction of duplex conformations q as well as N are free fitting parameters. The binding constant is determined from the concentration dependency of q [68, 69].


Figure 1 shows the measured fluorescence autocorrelation functions for the single (circles, q = 0) and bound strands (diamonds, q = 1) in P-PM hybridization. The initial concentration of the Cy3 labeled probe is 5 nM. By fitting the data to equation (2), we find the characteristic diffusion times ms (red solid curve) and ms (blue dashed curve), revealing excellent discrimination between unbound and bound states. The molar fraction q of the double strand is extracted using equation (3). The triangles and green dotted curve (q = 0.66) in figure 1 depict a representative measurement along with its fit for cPM = 4 nM. The correlation measurements for P-MME and P-MMM are shown in supporting information (see footnote 1).


Figure 1. Experimentally determined fluorescence autocorrelation functions for single stranded P (data: circles, fit: red solid curve, equation (2)), and double stranded P-PM (data: diamonds, fit: blue dashed curve, equation (2)) as well as a mixture of single and double strands (data: triangles, fit: green dotted curve, equation (3)). The data of the vertical axis are normalized in the range between 1 and 2 for comparison.
Download figure:
Standard image High-resolution image2.4. Notation
In the following we indicate bound strands by the use of a hyphen, e.g. P–S1 denotes a complex of the probe bound to strand 1. All concentrations are written as cx where x corresponds to the sequence name (e.g. cPM is the concentration of the PM strand). For the sequences in set 1, we use the notation cx for the concentration of Sx (e.g. c1 is the concentration of S1).
3. Models and determination of binding constants from fluorescence anisotropy
All measurements of anisotropy are performed on samples with a labeled strand L at fixed concentration and an unlabeled strand U at a concentration that is varied (abscissa in all plots throughout the manuscript). The total anisotropy is the sum of the fractions qi of conformation i (i.e. free in solution, probe bound or as part of a triplet) and anisotropy ri [70]


The superscript 'eq' refers to the equilibrium concentration of each species.
In the following we describe models that yield equilibrium concentrations () as a function of the underlying binding constants. Each model is based on the establishment of rate equations describing the concentration . The equations are solved at equilibrium ().


3.1. Langmuir model for pairwise binding
The hybridization reaction among a fluorescently labeled single DNA strand L and its unlabeled complementary partner U to a duplex LU is described as

where k+ and k− are the association and dissociation rates. The corresponding differential rate equation is

In equilibrium the time derivative equals zero, leading to

from which we can determine the equilibrium concentrations. For given amounts of initial concentrations, and we obtain the well-known Langmuir isotherm [69]


where K is the equilibrium binding constant, , and .


Since only labeled conformations (L and LU) contribute, the total anisotropy (equation (4)) is,

where qL and qLU are the fractions of free, labeled strands and of duplexes, rL and rLU the corresponding anisotropies. Using we obtain


Substituting cLUeq by equation (8) results in an expression for the anisotropy as a function of the binding constant

We use equation (11) to fit the anisotropy data in all individual experiments. rL, rLU, and the binding constant K are free parameters. All initial concentrations are known.
3.2. Exclusive binding model: two targets compete for binding to the same probe
Besides the labeled (L) and unlabeled (U) strands we now consider a third, unlabeled strand, the probe P, at fixed initial concentration . L and U do not hybridize to each other but they form duplexes with the probe, P-L and P-U. Both targets cannot bind to P simultaneously. We refer to this situation as exclusive binding. The following two reactions can occur:


The corresponding rate equations are:


In equilibrium this leads to two coupled nonlinear equations


Here, , and , and . These equations are numerically solved for cPLeq and cPUeq with the help of the Matlab built-in nonlinear equation solver. In order to fit our anisotropy data we use equation (9)


The initial concentrations of single strands are known. , rL and rPL, KL and KU are free fitting parameters.

The expression is not suitable to obtain absolute values for both, KL and KU since fitting KL and KU simultaneously leads to a large error. The fit, however, is strongly dependent on the ratio of binding constants (κ). To illustrate this fact we use the exclusive binding model and plot the predicted anisotropy r as a function of for KU = 10 × 109 M−1, KL = 1 × 10⁹ M−1 (i.e. κ = 10), rL = 0.5 and rPL = 1 (see figure in (footnote 1)). As in experiments we fit the unknown anisotropies rL and rPL against the data, here the theoretically generated curve. All three curves with κ = 10 (the same as for the initially generated curve), are almost indistinguishable from the data, while the red, dotted curve with κ = 30 clearly differs. Therefore, in what follows we keep the value of one of the binding constant fixed (taken from individual binding experiments) and take the ratio of the binding constants as a fitting parameter.

Note that for both models, Langmuir and exclusive binding, the anisotropies of the single strand (rL) and molecular complex (rLU or rPL) are free parameter of the fit rather than being determined by independent experiments. We found that this leads to more consistent results.
Throughout the manuscript the values of the binding constants are given with their error corresponding to a 95% confidence interval as obtained by the respective fits.
4. Results
4.1. Individual binding of the DNA strands (in the absence of competition): set 1 and set 2
4.1.1. Fluorescence anisotropy
We determine the individual binding constants of the strands from set 1 (table 1). Each strand is shorter than the probe but fully complementary. The initial target concentrations of S1, S2 and are and . By fitting the Langmuir model to the anisotropy data in figure 2 we obtain the individual binding constants M−1 for P–S1 (red solid curve), M−1 for P–S2 (blue dashed curve) and M−1 for P–S (green dotted curve). The different relative errors are due to different distributions of free to bound strands (for elevated K the number of free strands diminishes) as predicted by the Langmuir isotherm equation (8). This leads to decreased sensitivity and increased relative error for larger binding constants.


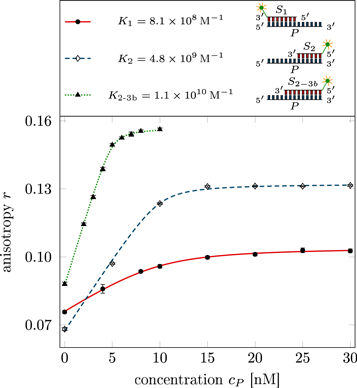
Figure 2. Fluorescence anisotropy as a function of probe concentration cp for P–S1 (data: circles, fit: red solid curve), P–S2 (data: diamonds, fit: blue dashed curve) and P–S (data: triangles, fit: green dotted curve) binding. The anisotropy increases with concentration because probe target complex formation slows down the thermal rotation of the dye. The fit corresponds to the Langmuir model. The dotted curve is shifted vertically by 0.03 for increased legibility.

Download figure:
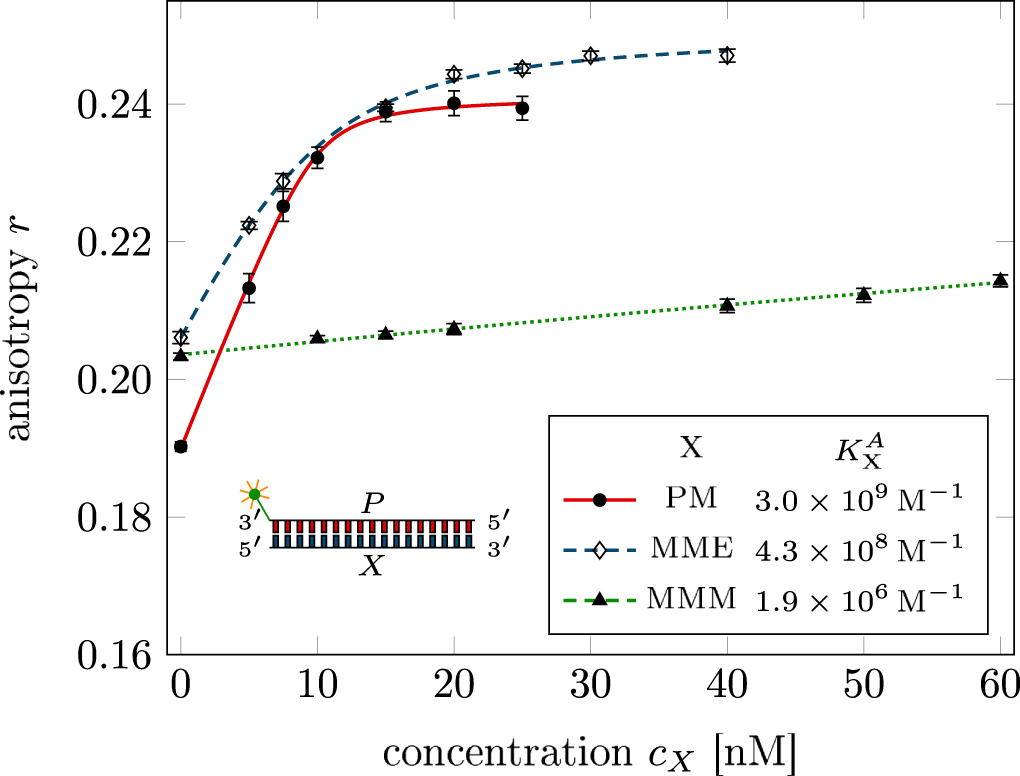
Standard image High-resolution imageIn set 2 (table 2) probe and targets have the same length. The initial concentration of the labeled probe is 10 nM. Figure 3 depicts the observed anisotropies of P-PM, P-MME and P-MMM as a function of the target concentrations (cPM, cMME and cMMM). We determine the individual binding constants KA (A refers to anisotropy) by fitting the Langmuir model to the data. We obtain M−1 (red solid curve), M−1 (blue dashed curve) and M−1 (green dotted curve). The binding constant for P-MMM binding is smaller than P-MME since the mismatch in the center of the strand destabilizes the duplex to a larger degree [50, 71, 72]. The relatively large error of KAMMM stems from the reduced binding constant, which in the studied concentration range entails that the probes are not saturated.

Figure 3. Fluorescence anisotropy as a function of the respective target concentrations cPM, cMME and cMMM for the cases P-PM (data: circles, fit: red solid curve), P-MME (data: diamonds, fit: blue dashed curve) and P-MMM (data: triangles, fit: green dotted curve). The anisotropy increases with target concentration because of probe target complex formation. The fitting curve corresponds to the Langmuir model. The anisotropy for P-PM and P-MME increases until the probe binding sites are saturated. In the accessible concentration range the increase in anisotropy for P-MMM is smaller and does not reach saturation because of weaker binding.
Download figure:
Standard image High-resolution image4.1.2. Fluorescence correlation spectroscopy
Figure 4 depicts the fraction of duplex conformations q from FCS as a function of PM, MME and MMM concentrations for P-PM, P-MME and P-MMM formation. The experimental data are fitted using the Langmuir model yielding M−1, M−1 and M−1 (CS refers to correlation spectroscopy; see red solid, blue dashed and green dotted curves, respectively). Comparing the binding constants determined from FA and FCS techniques we see that the values of KPM and KMME match within the experimental error while the values of KMMM differ by more than two orders of magnitude.


Figure 4. The fraction of double strands, q, for P-PM (data: circles, fit: red solid curve), P-MME (data: diamonds, fit: blue dashed curve) and P-MMM (data: triangles, fit: green dotted curve) as a function of cPM, cMME and cMMM as determined by FCS. The experimental data are fitted using the Langmuir model to obtain the individual binding constants KCSPM, KCSMME and KCSMMM.
Download figure:
Standard image High-resolution imageIn table 3 we compare the experimental findings to theoretical values predicted by the Nupack software package. The theoretical values support the experimental results from the FA technique.
Table 3. Comparison of binding constants as obtained from FCS and FA to the theoretical predictions by Nupack for P-PM, P-MME and P-MMM. Units are 109 M−1.
| Bindings constant obtained from | |||
|---|---|---|---|
| Sequence | FCS | FA | Nupack |
| PM | 3.1 | ||
| MME | 0.35 | ||
| MMM | 0.0023 | ||


4.2. Two fully overlapping strands in competition for binding to the same probe (set 2)
We investigate the binding behavior of two fully overlapping strands, PM and MMM, in competition for the same probe. The initial concentrations of the probe and the labeled PM are 10 nM. Figure 5(a) shows the experimentally determined anisotropy as a function of cMMM.

Figure 5. (a) Fluorescence anisotropy as a function of cMMM in the case where the fully overlapping targets MMM and PM compete for the same probe (black circles). Here, the PM strand is Cy3 labeled at the 3' end. The data are fitted using the exclusive binding model. The green dotted and the blue dashed curves result from respectively taking the individual binding constants as determined by FA (KAPM and KAMMM) and FCS (KCSPM and KCSMMM) and fitting the anisotropies of the single strand and molecular complex as the only free parameters. The red solid curve represents a fit where we use KPMCS from table 3 but the ratio of binding constants κ is a supplementary free parameter (besides the anisotropies of the single strand and the molecular complex). The shaded region corresponds to the 95% confidence band of the fit. Same configuration as in (a) studied using FCS. The graph shows the PM carrying fraction of the probes P (vertical axis) as a function of MMM concentration. Probe occupancy cannot be predicted from the individual FCS binding constants of the competitors (dashed line). The data at 800 nM concentration was corrected for an increase in viscosity as determined by capillary flow.
Download figure:
Standard image High-resolution imageFrom the anisotropy decreasing with MMM concentration we conclude that the fraction of P-PM duplexes is increasingly replaced by P-MMM duplexes. Considering the binding constants KAPM and KAMMM from FA (see figure 3), their values are unfit to reproduce the experimental anisotropy data using the exclusive binding model (green dotted curve). The ratio of binding constants from FA (or Nupack) is , and the binding constant KAMMM is much too weak to remove the PM from the probe by the required amount. However, we see that the individual binding constants from FCS (see figure 4), KCSMMM, and KCSPM lead to a considerably better fit against the data in the exclusive binding model. (blue dashed curve). The error on arises from error propagation of the experimentally determined KCSPM and KCSMMM.

We fit the data keeping M−1 constant and the ratio κ as a free parameter (red solid curve). This leads to an excellent fit with . The confidence intervals of κfit with overlap. In supporting information we show that the result of fitting κ while keeping KCSMMM constant leads to almost the same value for κ () (see footnote 1), however, this would mean that KCSPM increases with the presence of MMM, which is unlikely. Figure 5(b) shows a result corresponding to figure 5(a) with the difference that FCS is used instead of FA. The dashed line corresponds to the expected behavior of the probe occupancy from the values of the individual FCS binding constants, KCSMMM and KCSPM. We see that in competition the effective binding constant of MMM appears weakened with respect to PM.


4.3. Two partially overlapping strands in competition for binding to the same probe (set 1)
Here, we consider strand S1 in competition with a second target, either S2 or , for hybridization to the probe P. The initial concentrations of the probe and S1 are while c2ini and are varied. S1 and share an overlapping tail on the probe. S1 and S2 do not (see figure 6 insets). Concerning S1 and S2, in figure 6(a) we see that the anisotropy rises with initial concentration of S2 (c2ini) until saturation is reached (circles). We interpret this as a signature of simultaneous binding of S1 and S2 to the same probe, forming a triplet (P–S1–S2). We describe the data using the Langmuir model, keeping the binding constant K2 as a free parameter, independent of K1 = 8.1 × 10⁸ M−1. The anisotropies ri of the single strand and molecular complex are free parameters as well. The binding constant obtained from the fit M−1 agrees well with the binding constant determined from the individual experiment K2 = 4.8 × 10⁹ M−1 (see figure 2). Moreover, excellent agreement of fit (red solid curve) and data suggests that K1 and K2 remain unaffected by the presence of the competitor. We conclude that the interaction among S1 and S2 must be negligible, as expected.


Figure 6. Two partly overlapping targets compete for binding to the same probe. The labeled target concentration is kept constant. Fluorescence anisotropy r as a function of the concentration of the unlabeled target. (a) The fluorescence anisotropy for P–S1–S2 binding rises as a function of c2 (data: circles, fit: red solid curve). The increase reveals a slowdown of the thermal rotation of the dye. We suggest that the unlabeled strand binds to the probe while the competing strand stays put. We fit the data using the Langmuir model with as a free parameter, independent of K1. This leads to the same value as from individual binding. (b) for P–S1–S the anisotropy decays as a function of . We fit the data according to the exclusive binding model, considering the previously determined values of the binding constants K1 and as constants, only the anisotropies ri of the single strand and molecular complex are free parameters (blue dashed curve). The red solid curve shows the result of a different fit, taking the ratio of the binding constants (κ) and both anisotropies ri (of the free molecule and the bound complex) as free parameters while keeping fixed. The shaded region corresponds to the 95 % confidence band of the fit. The ratio /K1 has changed compared to the values from individual binding. (c) Residuals from the fitting function in (b): The individual binding constants from FA, K1 and , lead to a systematic deviation from the data (blue open squares, dashed blue lines are guides for the eye) that extends beyond the error, indicated by horizontal, dashed, black lines. The result of the fit considering the ratio of the binding constants as free, which corresponds to the red line in (b), remains within the error of the data (red dots). There is no systematic deviation.


Download figure:
Standard image High-resolution imageIn the case where strand 2 has 3 extra bases of overlap the anisotropy drops with increasing concentration (figure 6(b)). A natural explanation is that removes S1 from the probe. The blue dashed curve corresponds to a fit using the exclusive binding model, where K1 = 8.1 × 10⁸ M−1 and M−1 are taken from the individual measurements and only the anisotropies of the single strand and the molecular complex are free parameters. The fit deviates from the data. We choose , as a free parameter, M−1 is fixed. This fit (red solid curve in figure 6(b)) leads to increased agreement with the data as reflected by the improved mean square error (a factor of 3). The shaded region corresponds to 95% confidence band of the fit. The experimental data are within the shaded region. The ratio of the binding constants changes from (the ratio of the individual binding constants K1 and with their respective errors) to . Note that the asymmetric error stems from the fact that for large values of κ the model becomes increasingly nonlinear in κ. We conclude that is more efficient in removing the competitor than suggested by the exclusive binding model and the individual binding constants.


It is not possible to obtain absolute values of the binding constants of each strand in presence of the competitor. We expect that the binding constants can only decrease in the presence of a competitor. In supporting information we show that fixing K1 instead of and fitting κ leads to almost the same value for κ () (see footnote 1), however, this would mean that increases with the presence of S1, which is unlikely. Analogous measurements for an overlap of 4 bases are presented in supporting information (see footnote 1). They show analog results.


5. Discussion
In this work we compare individual binding constants from pairwise assessments to binding constants as they appear if two targets compete for the same probe. We use fluorescence anisotropy, a technique that is sensitive to the Brownian rotation frequency of the fluorescent label of a molecule. It is the increase in persistence length that comes with the formation of a DNA double helix that will slow down Brownian rotation. At the same time, if for some weakly bound states the rotational mobility of the fluorophore resembles free strands in solution, these binding states will not count as bound. The experimental results for individual binding constants obtained by Fluorescence Anisotropy (FA) agree extremely well to the predictions from Nupack—in all considered cases (see table 3). The Nupack algorithm is based on the NN model [22, 32, 35, 73, 74], that is, interactions that only exist if a double helix is formed. We conclude that FA is a good indicator of helix conformations and their contribution to binding.
FCS measurements deduce the binding constant from a slow-down in translational diffusion caused by binding. Contrary to FA, here loosely bound states cannot be distinguished from a duplex conformation. It is not surprising that the values of the binding constants from FCS are larger than in FA in every studied configuration (see table 3). In the case P-MME, mismatch and fluorophore are located at opposite ends of the double helix. The probability that the mismatch destabilizes the helix is small, in particular at the end where the fluorophore is located. Here, as well as in cases without a destabilizing mismatch, FA and FCS yield similar values. A mismatch in the center of the oligonucleotide, however, reduces the persistence length of the molecular dimer [75]. In this case the FCS binding constant deviates from FA (and from predictions by Nupack) by two orders of magnitude. We interpret this fact with the loss of the long helicoidal conformations, which makes other, loosely bound microstates contribute to binding relatively more, thus increasing the differences between both techniques. Following this idea, taking the values of the affinities from both techniques, as much as 99% of the affinity would have to be generated by less specific interactions than double helix in this particular case.
High salt concentrations as in our buffers tend to screen electric interactions at low frequencies, however, 'London-' or 'dispersion-' forces cannot be suppressed by the presence of ions. For parallel strands of single bases, the corresponding enthalpy of attraction corresponds to roughly −1.1 kcal mol−1, assuming the centers of the bases are separated by a distance of 1 nm (see supporting information (see footnote 1)). This is in vicinity of the effective energy differences of the Boltzmann factors corresponding to the binding constants from FA and FCS in case of the mismatch placed in the middle. Note that this van der Waals energy represents a lower bound for unspecific molecular attraction since it does not account for π–π [76], hydrophobic, or low frequency van der Waals contributions that will not be screened by ions at molecular distances. Partially bound configurations beyond the double helix, so called intermediate binding states, were suggested to play a role earlier, in particular in connection with denaturation of the double strand [77–80].
FA yields individual binding constants as predicted by the NN model. Considering fully overlapping targets, our observations in competition, however, are far from a simple interaction based on these individual binding constants (compare dotted green line in figure 5(a) to experimental data). We conclude that binding in competition cannot be understood solely from competing NN interactions, which would necessarily lead to Boltzmann statistics. Binding constants as determined by FCS deviate from FA and NN model predictions. We can, however, use the binding constants from FCS to reasonably describe the competitive case as observed by FA (figure 5(a)). This underlines that the binding affinities as determined by FCS represent a physically meaningful statistical weight. At the same time this suggests that mostly binding states other than the double helix of MMM are responsible for diminishing the statistical weight of NN helicoidal binding conformations of the competing PM as probed by FA. Since according to figure 5 a better fit is achieved if increases compared to the individual assessments by FCS, we suspect that in competition the MMM binding constant appears reduced compared to its value as determined by FCS. This can easily be understood by not all of the MMM binding microstates competing with their full statistical weight against the helicoidal binding conformations of the PM competitor.

Differences of about two orders of magnitude between theoretical predictions and experiments as we find between Nupack and FCS have been exposed earlier during experimental work aimed at single nucleotide mismatch detection [19, 22] (see introduction and references therein). From our experiments in competition we conclude that these differences are not due to our experimental inability to produce ideal situations [22], rather we observe that the NN model [22, 32, 35, 73, 74], which relies on base stacking interactions, predicts the P-MMM helix stability in excellent agreement with FA, but fails to take into account any other binding conformations that need to be considered to explain the situation in competition.
Following this interpretation an even larger κ must be expected if FCS instead of FA is used to assess PM binding in competition. Indeed, FCS in competition yields results that again deviate heavily from the prediction based on the individual affinities from FCS (figure 5(b)).
For only partly overlapping sequences where each of the competing strands has a foothold on the probe, we see that in competition the ratio of the binding constants again changes, in this case by one order of magnitude in favor of the stronger binding competitor as compared to the individual binding constants, figure 6. Again, the observed change of the effective binding constants due to competition cannot arise within the NN model since neither the stacking microstate energy levels, nor their distribution depends on the presence of a competitor. Simple entropic repulsion among the competing strands would diminish the binding energies of both competitors by the same amount, leaving the ratio of the binding constants untouched. Moreover, sequences with non-specific overhangs do not exhibit a decrease of FA with increasing presence of the competitor (see figure S7 in supplementary material), which we interpret as a tendency to bind simultaneously: a purely entropic interaction is too weak to completely remove the competing target. Following our interpretation above, we are again left with the conclusion that in competition binding states beyond the double helix must lead to changes in the ratio of binding constants compared to the individual cases.
In order to produce the experimentally observed deviations from the Boltzmann picture, the binding microstate distributions of the two competitors must be affected to a different degree by the presence of the other. Since partly overlapping strands bind at different locations, differences are more likely to exist than for the fully overlapping ones. However, this is not what we observe in our experiments: the difference to the Boltzmann prediction, that is, the degree of cooperativity rather seems to increase with increasing length of specific overlap of the competing sequences under study. (See figures 5 and 6 and and S6 in the supplementary material.) This subtle point needs to be elucidated in future work.
6. Conclusion
Binding affinities related to average Gibbs free energies by Boltzmann factors often give a good description of oligonucleotide hybridization, however, here we see that competitive situations can exhibit more complex, cooperative behavior. We observe the ratio of effective probe binding affinities to change in competition compared to pairwise considerations, revealing non-negligible, non-trivial interactions: the presence of one strand affects the binding microstate distribution (and the resulting binding constant) of the competitor to a different degree than vice versa. To our knowledge the observed behavior cannot be reproduced by any of the current models of DNA hybridization. We suggest that binding states that possess lower enthalpy than double helix conformations may play a larger role than previously thought. Their role appears if strand interactions are considered in competition where interactions emerge that extend beyond molecular pairs, resulting in cooperative behavior.
Acknowledgments
The authors acknowledge financial support by German Research Foundation (DFG) as part of the Collaborative Research Center SFB 1027.
Footnotes
- 1
See supplemental material is available online at stacks.iop.org/NJP/21/113027/mmedia at URL for details on experimental anisotropy setup, error analysis of anisotropy data, grating factor measurements, fluorescence autocorrelation functions, extra anisotropy measurements and van-der-Waals energy estimation.