Abstract
Bismuth telluride (Bi2Te3) has garnered significant interest in thermoelectric applications and three-dimensional topological insulators due to its unique electronic, transport, and thermal properties. Bi2Te3 and Sb2Te3 chalcogenide compounds have the same crystal structure. While Sb2Te3 has been shown to be a prototypical phase change memory (PCM) compound along the pseudobinary tie-line of Ge-Sb-Te alloys, whether Bi2Te3 can also exhibit PCM functionality is still not well established. In this work, a systematic study on the structural, dynamical, and electronic properties of amorphous Bi2Te3 during the quenching process has been performed by using ab initio molecular dynamics simulations. Pair correlation function, coordination number, bond-angle distribution functions, and a novel atomistic cluster alignment method are used to explore the structural characteristics of Bi2Te3 as a function of temperature. Our study shows that there are many distorted octahedral clusters in amorphous Bi2Te3. In comparison with the local structures in Sb2Te3, we found that the degree of distortion of the octahedrons in the Bi2Te3 system is smaller than that in Sb2Te3 system. Moreover, the changes in the dynamical properties of Bi2Te3 from liquid to glassy state are also explored. The approximate range of liquid-to-glass transition temperature is determined to be between 673 and 723 K. The electronic properties of Bi2Te3 and Sb2Te3 are also analysed by density-of-states and Bader charge calculations, both of them in glass state are semiconductors. Our studies provide useful insights into the local structure and dynamical properties of Bi2Te3 at the atomistic level during the fast cooling process, and suggest that the compound can be a candidate for PCM materials.
Export citation and abstract BibTeX RIS

Original content from this work may be used under the terms of the Creative Commons Attribution 3.0 licence. Any further distribution of this work must maintain attribution to the author(s) and the title of the work, journal citation and DOI.
1. Introduction
Phase change memory (PCM) materials can repeat ultrafast and reversible phase changes between amorphous and crystalline states via appropriate heating processes [1, 2]. During the SET operation, devitrification takes place when the material is heated above the glass transition temperature  but below melting point
  The system is RESET by further heating above Tm then quenching to amorphous state. Among chalcogenide alloys, Sb2Te3, GeTe, and Ge2Sb2Te5 (GST) are representative PCMs, and are widely used in rewritable optical storage media such as compact discs (CDs), digital versatile/video discs (DVDs), and Blu-ray discs [3, 4].
At ambient conditions, Bi2Te3 and Sb2Te3 compounds have the same rhombohedral crystal structure with space group  (R
(R m), and the atomic layers are arranged in the order of Te1-Bi(Sb)-Te2-Bi(Sb)-Te1 in the hexagonal cell [5]. Both compounds have been shown to exhibit excellent thermoelectric performance, and have played an important role in the thermoelectric studies over the past few decades [6–8]. As the new states of quantum matter, three-dimensional topological insulators of the Bi2Te3 family have also attracted much attention in recent years due to their unique electronic properties [9–11]. Since Sb2Te3 is the prototypical PCM along the pseudobinary tie-line of Ge-Sb-Te alloys, and has been widely studied and applied [12–15], it is of great interest to explore whether Bi2Te3 can also be a good candidate for PCM.
Han et al [16] first pointed out that Bi2Te3 nanowires also exhibit a reversible crystalline-amorphous phase change induced by temperature, laser, or current pulse, similar to chalcogenide alloys. Ju et al [17] found that the amorphous stability of Bi2Te3 can be effectively increased by doping with Si, determined via a combination of experimental and theoretical methods. However, systematic theoretical studies at the atomic level about the structures and properties of Bi2Te3 during a rapid cooling process is still far from complete. In a previous work, we have studied the structural transformation of Sb2Te3 from liquid to amorphous upon fast cooling [18]. Results show that most short-range motifs in the Sb2Te3 system are defective octahedrons. Therefore, a comparison of the structural characteristics of amorphous Bi2Te3 and Sb2Te3 compounds would be very interesting.
In this paper, based on ab initio molecular dynamics simulations and analysis, we report our findings of structural and dynamical transitions of Bi2Te3 from the liquid to glassy state, and compare the local structure motifs of amorphous Bi2Te3 with those of amorphous Sb2Te3. This work is organized as follows: in section 2, the detailed computational techniques are described. The results and discussion of the local structure motifs in liquid to glassy state of Bi2Te3 as well as corresponding dynamical and electronic properties are presented in A, B, and C parts of section 3, respectively. Finally, the conclusions are given in section 4.
2. Methods
Liquid and amorphous states of Bi2Te3 were modelled by ab initio molecular dynamics (AIMD) simulations based on density functional theory (DFT), using the Vienna ab initio simulation package (VASP) code [19, 20]. The projector-augmented wave (PAW) method [21, 22] and the Perdew–Burke–Ernzerhof generalized gradient approximation (GGA-PBE) for the exchange-correlation energy functional were used. The temperature was controlled by an NVT canonical ensemble (constant-number of particles, constant-volume and constant-temperature) with a Nosé-Hoover thermostat [23, 24].
The cubic supercell for the initial configuration contained 200 atoms (80 Bi and 120 Te atoms) randomly distributed in the simulation cell. Only the Γ point is used to sample the electronic structure over the first Brillouin zone during the finite temperature MD simulations. The time step for the MD simulations was 3 fs. Periodic boundary conditions were applied in the simulations. Firstly, the cubic supercell was thermally equilibrated at a high temperature well above its melting point temperature of 858 K [25], in order to eliminate the memory effect on the initial configuration. Then the system was quenched from liquid state at 1173 K to glassy state at 300 K with a uniform cooling rate of 33.3 K ps−1, of which the average pressure was kept close to zero (within 0.0 ± 0.5 kBar) by adjusting the length of the cubic box. Finally, the system with appropriate box length was run for 6000 steps at each temperature shown below for statistical analyzes of the structural and dynamical properties. The pair correlation functions (PCF), bond-angle distribution function (BDF), and atomistic cluster alignment (ACA) methods [26] were performed to investigate the local structure order in Bi2Te3 upon quenching. The self-part of the time-dependent van Hove correlation function is calculated to study the dynamical properties of Bi2Te3 system. Electronic density of states and Bader charge are used to analyze electronic properties of Bi2Te3.
3. Results and discussion
3.1. Local structure order
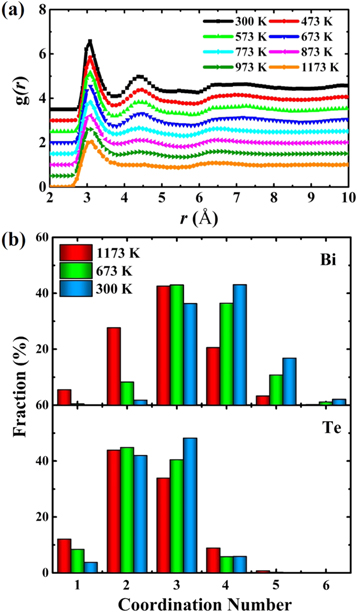
Pair correlation function (PCF), defined as the normalized possibility (relative to the uniform probability) of finding an atom at distance r from the central atom, has been widely used to character the structure of liquids and glass. The total PCFs for Bi2Te3 at different temperatures obtained from our ab initio MD simulations are plotted in figure 1(a). The first peaks in total PCF become stronger with decreasing temperature, demonstrating that the system is more ordered at the glassy state. In order to compare the fraction of homopolar bonds of amorphous Bi2Te3 and Sb2Te3, we calculated the total and partial pair-correlation functions (PCFs)  of amorphous Bi2Te3 and Sb2Te3 in figure S1 is available online at stacks.iop.org/NJP/21/093062/mmedia. Similar to total PCF (in figure S1(a)),
  and
and  in figure S1(b) resemble each other except for the small offset of the peak position. However, the partial PCFs of homopolar bonds (figures S1(c) and (d)) for Bi2Te3 and Sb2Te3 are different. There is an obvious primary peak at 3 Å and 2.9 Å in
  and
and  for Sb2Te3, respectively. In contrast, the peaks around 3 Å in
  and
and  for Bi2Te3 are very small, demonstrating the fraction of homopolar bonds in amorphous Bi2Te3 in the first nearest shell is much lower than that in Sb2Te3. Therefore, amorphous Bi2Te3 exhibits a more ordered amorphous network. Previous research has indicated that homopolar bonds are linked to the stability of tetrahedral fragments in GeTe and GST, but they do not significantly strengthen octahedral motifs [27]. Coordination number (CN) is the number of atoms in the first-neighbor shell of a given atom. The fraction of various CN from 1 to 6 for Bi2Te3 at different temperatures calculated using a uniform cutoff value of 3.3 Å are shown in figure 1(b). It can be seen that Bi-centered atoms are mostly 3 and 4-coordination while Te-centered atoms have predominantly 2 or 3-coordination. As the temperature decreases from 1173 to 300 K, the percentage of 4-coordination Bi-centered atoms gradually increases, the same are for the 3-coordination Te-centered atoms. It is interesting to note that the fractions of the 4- and 5 coordinated Bi atoms increases noticeably as the temperature is lowered. Some 6-coordinated Bi atom also emerged at low temperature. These results indicate that high-coordination Bi configurations are gradually formed in the amorphous state of Bi2Te3. Previous studies have shown that when a cutoff value of 3.3 Å is used for Sb2Te3 at 300 K, the total CNs are 3.77 and 2.58 for Sb and Te, respectively. In this work, the total CNs of amorphous Bi2Te3 for Bi and Te at 300 K are 3.81 and 2.57, respectively, similar to those observed in Sb2Te3.
Figure 1. (a) Total PCFs of Bi2Te3 at different temperatures. (b) The fraction of coordination number for Bi- and Te-centered atoms for Bi2Te3 at 1173, 673, and 300 K. The cutoff distance is 3.3 Å.
Download figure:
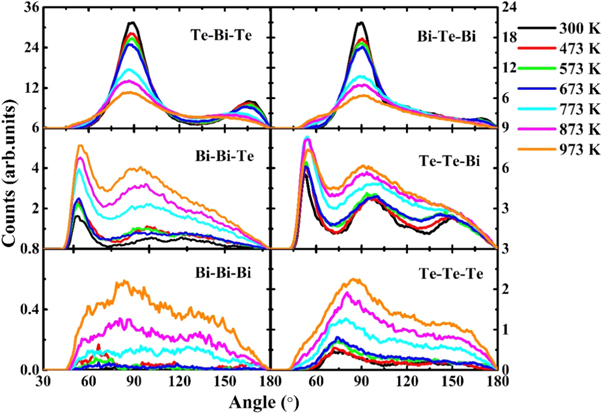
Standard image High-resolution imageTo further characterize the structures of the liquid and amorphous, we also calculated bond-angle distribution functions  in Bi2Te3 at different temperatures as shown in figure 2. Partial bond-angle distribution functions for three bonded atoms are divided into two groups: Bi-centered (the left half of figure 2) and Te-centered (the right half). One can see that among these partial bond-angle distributions, the most prominent peaks are located in Te-Bi-Te and Bi-Te-Bi, namely at 90° and 167°, which are the characteristic peaks of octahedral geometry. The peaks at the bond angle of 90° and 167° becomes sharper upon cooling, revealing that the octahedral configuration may exist in Bi2Te3 and becomes more order with the decrease in temperature. In comparison, the main peaks in Bi-Bi-Te and Te-Te-Bi are around 55°, and there are no obvious peaks in Bi-Bi-Bi and Te-Te-Te. These results indicate that the interaction between Bi and Te atoms are very strong, while there are not many homopolar bonds (such as Bi-Bi and Te-Te bonds) in Bi2Te3.
Figure 2. The calculated partial bond-angle distribution functions of Bi2Te3 at different temperatures.
Download figure:
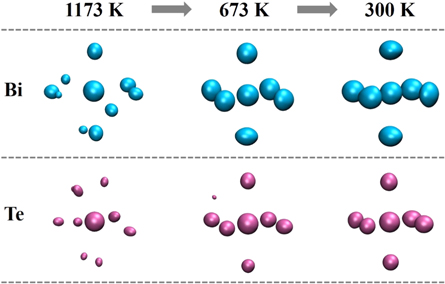
Standard image High-resolution imageTo further explore the local structure in Bi2Te3, we use the ACA method proposed recently [26], which is a full three-dimensional atomistic analysis method that can identify and characterize the local structure more clearly. Collective alignment is the first part of ACA method, which is used to determine whether there is a local structure order in the system. In this part of analysis, 2000 clusters for Bi and Te types of central atoms respectively are randomly selected from the MD simulation trajectories at each temperature of 1173 K, 673 K and 300 K. Each cluster consists of one central atom and six nearest neighboring atoms. The center atoms of these clusters are overlapped to each other, and then a modified Lenard-Jones-type attractive potential and a strong harmonic potential are used to perform a MD-simulated annealing to align the orientations of these clusters. Rigid rotation is applied to the clusters as well as translational operations until their overall mean-square distance is minimized. After the collective alignment, three-dimensional atomic density distributions smoothed with Gaussian smearing are obtained. The collective alignments of Bi-centered and Te-centered results at 1173, 673 and 300 K are plotted in figure 3. At 1173 K, Bi- and Te-centered clusters exhibit only a few high-density spots, showing that liquid Bi2Te3 is relatively disordered. As the temperature drops to 673 K, defective octahedral configuration is gradually formed in the Bi2Te3 system. In the glassy state, the higher atomic-density contour plots with clearer octahedral configurations are shown in the right of figure 3, revealing the short-range order (SRO) of the system is further enhanced at 300 K. On the whole, distorted octahedral is the main SRO of the Bi2Te3 glass around the Bi atoms. Although Te-centered clusters also exhibit octahedral configuration, the volume of the center sphere is significantly larger than that of other six spheres around it, indicating that the existence of vacancies may lead to defective octahedral-like SRO. In comparison, the volume of each sphere for Bi-centered clusters is almost the same, demonstrating that the Bi-centered clusters consist mainly of relatively perfect octahedrons.
Figure 3. The collective alignments result for Bi2Te3 at 1173, 673 and 300 K. Clusters in the upper and lower represent Bi- (blue) and Te- (purple) centered ones, respectively. The isovalue is set at 0.2 Å−3.
Download figure:
Standard image High-resolution imageOne-on-one cluster-template alignment, another part of the ACA method, is applied to further quantify the octahedral SRO in amorphous Bi2Te3. In this scheme, a more direct definition of structure fitting score f is used to describe the structural similarity between given a template and selected cluster:


where  is the distance between an atom C in the cluster and an atom T in the template. The term
  is the minimal square distance between the atom T in the template and all
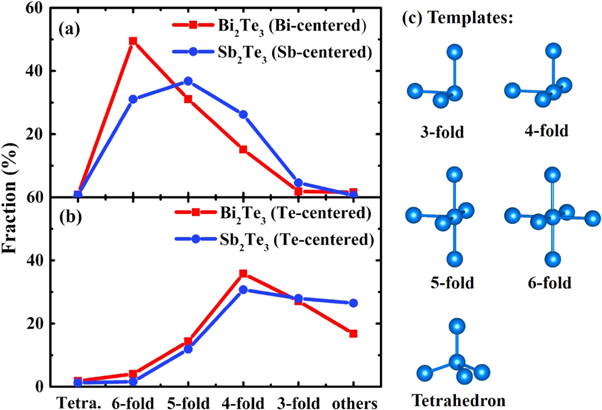
  atoms in the cluster. When the value of f is zero, the structural similarity between selected cluster and template is perfect; on the contrary, a larger f indicates the selected cluster has large deviation from the template. The role that defective octahedrons play in the amorphous Ge-Sb-Te alloy have been studied using the same scheme in our previous work [28], and thus it is interesting to compare the ACA results of the one-on-one cluster-template alignment of amorphous Bi2Te3 with those in Sb2Te3 at 300 K. The Bi (Sb)-centered and Te-centered clusters in amorphous Bi2Te3 with Sb2Te3 with different templates are plotted in figures (a) and (b), respectively. Five Bi-centered or Te-centered atomic clusters of 3-, 4-, 5-fold defective octahedrons and a 6-fold perfect octahedron as well as a 4-fold tetrahedron as shown in figure 4(c) are used as the templates in the alignment. Each Bi(Sb)-centered or Te-centered cluster extracted from the Bi2Te3 and Sb2Te3 system at 300 K is aligned with these five templates to determine their structural similarity to the templates. If the alignment score is less than 0.2, the cluster is identified as corresponding to its template cluster. From figure 4(a), we can see that in the Sb2Te3 system, the highest proportion of configuration are 5-fold clusters, while 6- and 4-fold clusters also occupy a higher proportion. Remarkably, for Bi2Te3, the 6-fold cluster occupies a very prominent proportion, notably higher than 5-fold and 4-fold clusters. On the other hand, as shown in figure 4(b), Te-centered clusters in Bi2Te3 and Sb2Te3 show similar fractions in glassy state with respect to the five templates, except that the population of the 4-fold Te-centered clusters in Bi2Te3 is slightly higher than that in Sb2Te3. There are almost no tetrahedrons in the Bi2Te3 or Sb2Te3 systems at 300 K. For Te-centered clusters of amorphous Bi2Te3, the proportion of 6-fold perfect octahedron is very small, there are mainly defective octahedrons with 3-, 4-, 5-fold octahedrons, resulting in the non-uniform volume of central and surrounding spheres appears in collective alignments result of Te-centered clusters at 300 K (figure 3). By comparison, we find that most of the distorted octahedral clusters in the Bi2Te3 glass sample exist in the Bi-centered configuration, and the SRO in Bi2Te3 is stronger than that in the Sb2Te3 system at 300 K. Introducing a small amount of Sc alloy into Sb2Te3 could significantly enhance the crystallization speed at elevated temperatures [13], and Qiao et al [29] found that Sc forms much more robust octahedral motifs than Sb and Te, which significantly and clearly reduces the stochasticity of nucleation. Therefore, the stable octahedral structure in amorphous state could be regarded as a crystal seed to enhance crystallization speed.
Figure 4. Comparison of the SRO for (a) Bi(Sb)-centered and (b) Te-centered clusters in Bi2Te3 and Sb2Te3 at 300 K. (c) Five templates applied in one-on-one cluster-template alignment method.
Download figure:
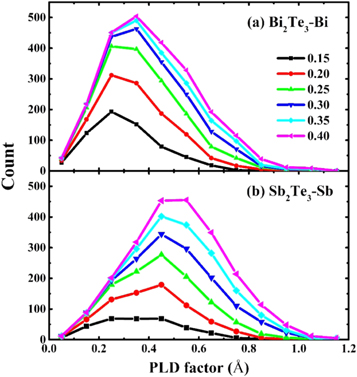
Standard image High-resolution imagePeierls-like distortion (PLD) is a significant feature in the chalcogenide PCMs [30–32]. On one hand, Peierls distortion is reinforced during the spontaneous structural relaxation of amorphous PCMs, resulting in the structural and electronic properties of the glass deviating from those of resonantly-bonded crystals, which lead to the resistance drift phenomenon [30]. On the other hand, Peierls distortion has been found to be the structural origin during the quench, which is associated with fragile-to-strong liquid crossover and metal-to-semiconductor transition in supercooled liquid PCMs [33, 34]. As can be seen from the results above, most configurations in Bi2Te3 systems are defective/distorted octahedral clusters. PLD can result in the instability of the perfect octahedral arrangement, leading to 3-fold, 4-fold, 5-fold, and 6-fold octahedrons as seen from the one-on-one cluster-template alignment. In order to quantitatively understand the PLD in amorphous Bi2Te3 and Sb2Te3, we calculate the PLD factor of Bi-centered and Sb-centered 6-fold octahedrons plot the results in figures 5(a) and (b), respectively. Here the PLD factor is obtained by averaging the differences of long- and short-bonds in the diagonal lines of each 6-fold octahedron [35]. Bi-centered or Sb-centered clusters with the alignment score with respect to the octahedron template in the range from f ≤ 0.15 to ≤ 0.40 are used to calculate the PLD factor. As one can see from figure 5 that there are not many Bi-centered clusters, in the Bi2Te3 amorphous with alignment score f ≥ 0.3, while there is still substantial amount of Sb-centered clusters in Sb2Te3 glass with the score higher than 0.3. Nevertheless, for f ≤ 0.4, 97.1% of the Bi-centered clusters and 94.8% of the Sb-centered clusters can be counted for. The PLD factors in Bi2Te3 system are peaked around 0.25–0.35 Å, while that of the Sb2Te3 system are around 0.35–0.45 Å, which demonstrates that the degree of distortion for octahedrons in Bi2Te3 system is smaller than that in the Sb2Te3 system.
Figure 5. The distribution of Bi-centered and Sb-centered 6-fold octahedrons for (a) Bi2Te3 and (b) Sb2Te3 at different PLD factors for f ≤ 0.15, 0.20, 0.25, 0.30, 0.35, and 0.40 at 300 K.
Download figure:
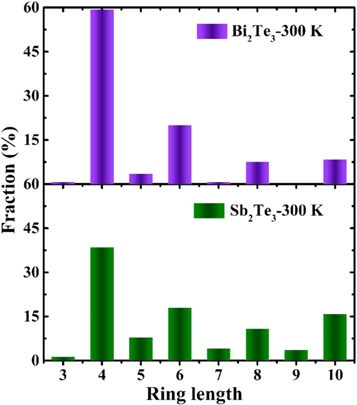
Standard image High-resolution imageInsights on the connectivity of a topological network of the amorphous materials can be obtained from analysis of relevant rings distribution by using RINGS code [36]. The comparison of the primitive rings for Bi2Te3 and Sb2Te3 at 300 K are computed in figure 6. Similar to glassy state Sb2Te3 [18], 4-fold rings in Bi2Te3 are the dominant structural motif among these n-fold rings, the fraction of which is even larger than Sb2Te3. Previous studies have pointed out that the 4-fold rings ABAB are the basic structural elements for fast phase transition in PCMs [37–40], which could reduce the stochasticity of nucleation [41]. In our previous work for amorphous Sb2Te3, we found that these defective octahedrons are connected with each other via 4-fold rings [18]. Highly coordinated (such as 6-fold and 5-fold) octahedrons can provide more structural sites for forming 4-fold ring; therefore, less distorted octahedral motifs in amorphous Bi2Te3 are more conducive to the formation of these 4-fold rings.
Figure 6. Ring distribution fraction of amorphous Bi2Te3 and Sb2Te3 at 300 K.
Download figure:
Standard image High-resolution image3.2. Dynamical properties
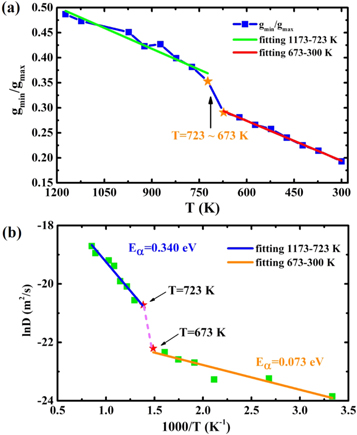
The liquid-to-glass transition temperature is usually determined using the Wendt–Abraham parameter defined as  [42]. Here,
  and
and  correspond to the values of PCF at its first minimum and first maximum, respectively. According to the results of PCF above (figure 1(a)), the Wendt–Abraham parameter of Bi2Te3 from 1173 to 300 K are computed and plotted in figure 7(a). During the quenching process, Wendt–Abraham parameters are divided into two segments for linear fitting: the line of 1173–723 K is labeled in green and the line of 673–300 K is labeled in red. It is worth noting that the slopes of the two straight lines are quite different, revealing that the liquid-to-glass transition temperature of Bi2Te3 system is between 673 and 723 K. Moreover, the self-diffusion coefficient D of Bi2Te3 upon cooling are also simulated, which is usually described by the Arrhenius equation:

where  is denoted as the activation energy and D0 as the pre-exponential factor. The relationship between ln(D) and 1/T is shown in figure 7(b). With the calculated results made linear fitting, the calculated activation energy is 0.340 eV between 1173 and 723 K (blue line). As the temperature decreases continuously, the calculated activation energy becomes 0.073 eV from 673 to 300 K (orange line). A sharp change in activation energy may imply a liquid-to-glass transition, which is consistent with the analysis of Wendt–Abraham parameter.
Figure 7. (a) The calculated Wendt–Abraham parameter of Bi2Te3 as a function of temperature. The green line is the linear fitting results from 1173 to 723 K, and the red line is the linear fitting results from 673 to 300 K. (b) The diffusion coefficient D of Bi2Te3 at different temperatures. The blue line is the linear fitting results from 1173 to 723 K, and the orange line is the linear fitting results from 673 to 300 K.
Download figure:
Standard image High-resolution imageTo further understand the dynamical properties of the Bi2Te3 system during transition from liquid to glassy state, we simulated the self-part of the time-dependent van Hove correlation function, defined by [43]

where N is the number of atoms in the system, and  is the time-dependent position of the ith atom ( i = 1, ..., N). The function
  is the probability to find an atom within time t in the vicinity Dr of points at the distance r given that initially the atom was located at the origin at t = 0. The self-part of the van Hove correlation function
  of Bi2Te3 at different time intervals (0.3, 0.6, 0.9, 1.5, and 3.0 ps) upon quenching is shown in figure 8. As the temperature decreases from 1173 to 723 K,
  exhibits an obvious change with time, indicating that Bi2Te3 is still in the liquid state, and the diffusivity of Bi and Te atoms is similar. Remarkably, when the temperature decreases to 623 K, the peak of
  changes very little with time, indicating that Bi2Te3 changes to a solid. Although the cooling interval is only 50 K (723 to 623 K), the change of the peak for
  is relatively large, which is consistent with the analysis of the Wendt–Abraham parameter such that liquid-to-glass transition temperature of Bi2Te3 system is in the range of 673 and 723 K. As temperature continuously decreases to 300 K,
  again changes very little with time, showing that Bi2Te3 has been completely transformed into a glassy state.
Figure 8. The self-part of the van Hove correlation function  of Bi2Te3 for different time intervals (0.3–3.0 ps) at 1173, 723, 673 and 300 K.
Download figure:
Standard image High-resolution imageIt should be noted that a liquid–liquid transition (LLT) in PCM liquids in the rapid cooling process has been detected experimentally by femtosecond pulse x-ray diffraction, but it is difficult to capture in our AIMD simulations due to the excessive cooling rate and the inadequate equilibration time at each temperature step [33, 34]. In future research, we will try to simulate the transition in supercooled PCM liquids with thousands of atoms and sufficient equilibration time during superfast cooling by using new simulations such as the deep potential for molecular dynamics (DeePMD), which is based on machine learning [44].
3.3. Electronic properties
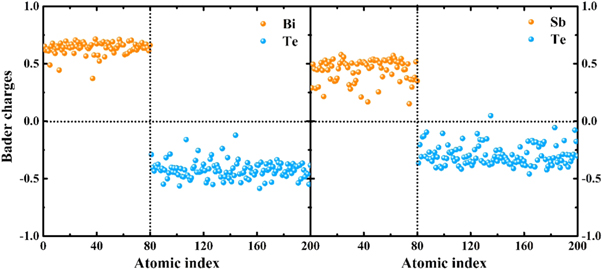
The electronic density of states (DOS) of Bi2Te3 and Sb2Te3 at 300 K are presented in figure 9. The results of DOS are calculated by the HSE06 functional, which can produce accurate band gaps than can the PBE functional. For Bi2Te3 and Sb2Te3, the lower valence band (−14∼−8 eV) originates from Te-5s, Bi/Sb-s states; however, Te-s states of Bi2Te3 dominate in −12∼−10 eV, and that of Sb2Te3 play a dominant role in −15∼−11 eV. The upper valence band (−6∼ 0 eV) is contributed from Bi/Sb-p and Te-p states. The contribution to the low conduction band (0–2 eV) is similar to the upper valence band, which is dominated by Te-p and Bi/Sb-p states. It is noteworthy that the contribution of Bi-p states in Bi2Te3 make major contributions to the low conduction band; in contrast, Sb-p and Te-p states of Sb2Te3 contribute equally to the low conduction band. There is a strong hybridization between Te-p states and Bi-/Sb-p states for the two amorphous compounds in the energy of −6 to 2 eV. Furthermore, both of Bi2Te3 and Sb2Te3 in glass state are semiconductor, and the energy gap of Bi2Te3 is 0.310 eV, which is slightly larger than the gap of 0.244 eV for Sb2Te3. The energy gap of crystalline Bi2Te3 is also larger than that of crystalline Sb2Te3, the corresponding energy gaps are 0.202 and 0.157 eV respectively by HSE06 calculations [45]. In addition, the Bader charge [46, 47] can give more electronic information based on the electronic charge density. The results of the Bader analysis for Bi2Te3 and Sb2Te3 at 300 K are presented in figure 10. A positive indicates the loss of electrons and a negative indicates the gain of electrons. On average, each Bi atom loses about 0.64 electrons and each Sb atom donates about 0.44 electrons. The scatter of the Bader charge for the same type of atom in amorphous Bi2Te3 is smaller than that in amorphous Sb2Te3, indicating that scatter of the short-range configurations in Bi2Te3 is relatively limited, which is consistent with the conclusion that the distortion of octahedrons is smaller in amorphous Bi2Te3 than in Sb2Te3. Similar to what is shown by previous research of amorphous Sb2Te3 and Sc2Te3 [41], Bader charge analysis shows larger charge transfer in amorphous Bi2Te3 than that in Sb2Te3, leading to larger energy penalty for forming Bi-Bi and Te-Te homopolar bonds due to stronger Coulomb interactions, a fact which explains why amorphous Bi2Te3 has fewer homopolar bonds than does Sb2Te3.
Figure 9. The partial DOS for Bi2Te3 and Sb2Te3 at 300 K. The dashed vertical line is the energy of 0 eV, corresponding to the Fermi level.
Download figure:
Standard image High-resolution imageFigure 10. Distribution of Bader charges for the 200-atom sample of Bi2Te3 and Sb2Te3 at 300 K. Yellow dots represent the 80 Bi/Sb atoms and blue dots represent the 120 Te atoms.
Download figure:
Standard image High-resolution image4. Conclusions
In summary, by means of AIMD simulations, we have generated models of the liquid and glassy states of Bi2Te3 compound, and explored the local structures, the dynamical as well as the electronic properties. PCF analysis shows the strong interaction between Bi and Te atoms. The main peaks of the bond-angle distribution functions of Bi2Te3 are the characteristic peaks of octahedral geometry, suggesting presence of the octahedral clusters in the Bi2Te3 system. In addition, the ACA method, a full three-dimensional atomistic local-structure analysis method, is applied to study the SRO of Bi2Te3 during its transition from liquid to glassy state. Results show that the Bi atoms in Bi2Te3 are in a defective octahedral environment, in agreement with that seen in Sb2Te3. The octahedral structure became more ordered as temperature decreased. Comparing Bi2Te3 and Sb2Te3 systems in the glassy state by using the one-on-one cluster-template alignment, we found that octahedral SRO around the Bi-center atoms in Bi2Te3 is stronger than that of Sb-center atoms in Sb2Te3. Ring statistics reveal that 4-fold rings are dominant in amorphous Bi2Te3. The self-part of the van Hove correlation functions show similar diffusivity of Bi and Te atoms in liquid Bi2Te3. Based on the dynamical property with temperature, it can be inferred that liquid-to-glass transition temperature of the Bi2Te3 system is around 673 to 723 K. Electronic properties of Bi2Te3 and Sb2Te3 are revealed by DOS and Bader charge analysis, which show both amorphous compounds are semiconductors. Our results shed more light on the structural transition of Bi2Te3 during the liquid-to-glass process at atomic level, and broaden the application field of PCM.
Acknowledgments
Work at Fudan University was supported by the key projects of basic research of Shanghai Municipal Science and Technology Commission (No. 18JC1411500), the NSF of China (Grant No. 61427815 and 11374055), CIOMP-Fudan University joint fund(No. FC2017–001), and the Fudan High-end Computing Center. W-S Su would like to thank the Ministry of Science and Technology for financially supporting this research under Contract No. MOST-108-2112-M-979-001. Support from the National Centers for Theoretical Sciences and High-performance Computing of Taiwan in providing significant computing resources to facilitate this research are also gratefully acknowledged. Work at Ames Laboratory was supported by the US Department of Energy, Office of Science, Basic Energy Sciences, Division of Materials Science and Engineering, including a grant of computer time at the National Energy Research Scientific Computing Centre (NERSC) in Berkeley, CA. Ames Laboratory is operated for the US DOE by Iowa State University under contract # DE-AC02-07CH11358.


