


Abstract
Peace is not merely the absence of war and violence, rather 'positive peace' is the political, economic, and social systems that generate and sustain peaceful societies. Our international and multidisciplinary group is using physics inspired complex systems analysis methods to understand the factors and their interactions that together support and maintain peace. We developed causal loop diagrams and from them ordinary differential equation models of the system needed for sustainable peace. We then used that mathematical model to determine the attractors in the system, the dynamics of the approach to those attractors, and the factors and connections that play the most important role in determining the final state of the system. We used data science ('big data') methods to measure quantitative values of the peace factors from structured and unstructured (social media) data. We also developed a graphical user interface for the mathematical model so that social scientists or policy makers, can by themselves, explore the effects of changing the variables and parameters in these systems. These results demonstrate that complex systems analysis methods, previously developed and applied to physical and biological systems, can also be productively applied to analyze social systems such as those needed for sustainable peace.
Export citation and abstract BibTeX RIS

Original content from this work may be used under the terms of the Creative Commons Attribution 3.0 licence. Any further distribution of this work must maintain attribution to the author(s) and the title of the work, journal citation and DOI.
1. Introduction
Achieving and sustaining peace among communities and nations is essential for people to lead safe, satisfying and fulfilling lives. However, most previous research studies have analyzed peace only in a negative way, considering it only as the absence of conflict, violence, or war. Recently, there has been a growing effort to understand 'positive peace', that is, the political, economic, and social systems that generate and sustain peaceful societies [1–5].
An international initiative lead by the Advanced Consortium on Cooperation, Conflict, and Complexity (AC4) at The Earth Institute at Columbia University has been analyzing sustainable peace as a dynamical system by using methods from the study of such complex systems that have proved valuable in understanding physical and biological systems. It is now in the third year of a projected ten year study to identify the factors that are most important in sustaining peace, determine how those factors interact with each other, and understand how these separate factors together function as a system so that the consequences of intended and unintended interventions to that system can be predicted [6].
In order to identify the peace factors and how they interact with each other, the team at AC4 first reviewed the existing literature, then conducted an international survey [7] where 74 scholars and scientists from many different fields (including neuroscience, evolutionary biology, political science, environmental policy, and philosophy) identified a 'core engine' of the factors most central to sustaining peace, and those results were critically analyzed and improved through two workshops with participants from nine universities in the United States, United Kingdom, and Turkey and representatives from the United Nations, Environmental Law Institute, the United States Institute of Peace, the Inter-American Development Bank, The Omidyar Group, and Bloomberg LP.
1.1. Causal loop diagrams (CLDs)
In order to identify these peace factors, describe how they influence each other, and how these individual interactions function together as a system, we developed a CLD that is a visualization of each factor, its links to the other factors, the strengths of those links, and whether each link is positive (inducing an increase in the target factor) or negative (inducing a decrease in the target factor).
Based on the input from the literature search, survey, and workshops, a number of CLDs of increasing complexity were developed over the last three years. First, it was decided that the CLD would reflect intergroup interactions rather than individual or national level interactions. Then we considered what are the most central elements in the CLD. We concluded that the most essential elements are Positive and Negative Intergroup Reciprocity (PIR and NIR). PIR is when a positive action of a member of one group is reciprocated by a positive action of a member of another group and NIR is when a positive action by a member of one group is returned by a negative action of a member of another group. Next we noted that the most important factors influencing PIR and NIR were people's emotional historical memory of the past and their goals and expectations of the future, so we added Positive and Negative Historical Intergroup Memory and Positive and Negative Goals and Expectations. As negative emotional assaults hurt deeper and last longer than positive reinforcements, the positive and negative factors were kept separate so that we could give them different strengths and different rates at which their effects decline. These were arranged spatially on the CLD so that the past is on the left, present is at the center, and the future is on the right. An analysis of that first CLD was presented in Liebovitch et al [8]. In subsequent CLDs we then added the factors of Promotive Intergroup Normative Pressures and Constructive Conflict Processes and Institutions. We believe that these eight factors are the essential 'core engine' of sustainable peace. We then broadened our investigation to consider additional secondary factors. We first added 5, then another 11, and then another one additional secondary factors that influence the core engine. These secondary factors were arranged spatially on the CLD so that the factors enhancing the positive factors in the core engine were on the top and the factors reducing the negative factors in the core engine were on the bottom. Next we explored the different ways that these peace factors could influence each other. Does each factor influence only a few other factors or does each factor influence all the other factors? In order to study the consequences of each of those choices we created two polar models: a 'sparse connection model' CLD where the peace factors only influence a few other factors and a 'dense connection model' CLD where each factor influences all, or nearly all, of the other peace factors. We selected these models for detailed study as they represent extremes in different types of influence amongst the peace factors. Our goal was to understand if these two different types of models lead to different long term stable states and different types of dynamics in the approach to those stable states.
The CLD is a directed graph or network with positive or negative strengths on the edges connecting the nodes. It is valuable in: (1) helping people to work collaboratively to identify the important factors in a system, (2) organizing the existing data so that the overall system can be seen and the place of each factor in the system, (3) helping to suggest new hypothesis to test, (4) determining if there are 'leverage' points where interventions would be most effective. It has proved a valuable tool in assessing systems such as the conditions that lead to obesity, teenage pregnancy, or the lack of potable water in rural settlements and in designing successful interventions [9, 10]. One of the CLDs of the conditions identified as needed for sustainable peace and their interactions with each other is shown in figure 1.

Figure 1. One Causal Loop Diagram (CLD) of the factors needed to sustain peace and their interactions. PIR is positive intergroup reciprocity and NIR is negative intergroup reciprocity. Positive factors and links are in blue and negative factors and links are in red. The strengths of the links are proportional o their thickness.
Download figure:
Standard image High-resolution imageThese valuable CLDs also have some limitations. It is often hard to trace the effects from one peace factor to its first targets and then from those targets to their targets and so on throughout the tangled web of connections that form the whole interconnected system. Since there are no quantitative values assigned to each peace factor, it cannot be validated as a predictive analytical model to determine the consequences of interventions in the system.
1.2. Mathematical model
A rigorous mathematical model, derived from the CLD, can further extend the value of the CLD by determining: (1) the quantitative values that result from the simultaneous interactions of all the peace factors, (2) the dependence of those values on the strengths and signs of the connections between the peace factors, (3) the dynamics, that is, the evolution in time of the values of the peace factors, and (4) the long term steady state values of the peace factors that define the dynamical 'attractors' of the system. It can also be the back end for an interactive interface for policy makers to study the consequences of different interventions in the system. Extending previous mathematical models of networked systems [11–15] to analyze a CLD, we determine the value xi of each peace factor from:

where the parameter mi determines the memory time scale (set shorter for positive than negative peace factors because of the stronger and longer lasting effects of negative emotional encounters [16]), bi is self-reinforcement or input from variables external to the system, ci,j is the strength of the influence from peace factor j to peace factor i. The hyperbolic tangent factor tanh() is used so that the effects from one peace factor to another are linear at small values but reach a limiting threshold at large values. In effect, this system is equivalent to a recurrent artificial neural network where the 'memories' defined by the attractors are determined a priori by the parameters, rather than by training the network. We integrate these coupled, nonlinear ordinary differential equations, forward in time using Euler integration requiring that all the values of peace factors  so that a negative peace factor acting through a negative link does not produce a positive effect.
1.3. Objectives
The current work of the project reported here is directed toward achieving four objectives:
- I.Develop a user-friendly graphical user interface (GUI) to the mathematical model so that scholars, practitioners, and policy makers can see the consequences of changes that they make in the model.
- II.Develop an automatic way to construct the input files needed by the mathematical model from CLDs drawn in PowerPoint. This will also have value for the analysis of other social systems and business management systems.
- III.Discover the properties defined by the mathematical model of the CLD, such as the existence of attractors, the size of the basins of those attractors, and the dynamics of how the system evolves in time.
- IV.Create methods and develop code to start the process of determining quantitative values of the peace factors from structured and unstructured databases in order to test, improve, and validate the model.
2. Methods
2.1. Objective I: GUI
In order to make it possible for scholars and policy makers, who are not computer sophisticates, to use and explore the mathematical model, we developed a GUI to the numerical integration backend so that the initial values of the peace factors xi(t = 0) and the strengths of the connections between them ci,j can be entered and the numerical integration executed to a steady state solution using event handling of mouse actions. The program displays the results in a meaningful graphic where the size of each peace factor and the strength of each connection is displayed proportionally to its value.
2.2. Objective II: input from CLDs on PowerPoint slides
Social scientists, practitioners, and policy makers typical construct CLDs as an interactive process using a whiteboard or Post-its [10, 17]. Microsoft PowerPoint can then be used to turn that CLD into a slide where the strengths of the interactions between the variables ci,j are coded in different thickness and the colors of those connections represent positive or negative interactions. This serves both as a presentation tool and as an analysis tool to generate the input data files needed by the GUI of the mathematical model. Since 2007, Microsoft has used the Office Open XML text file format for their presentation documents [18]. When the file extension is changed from .pptx to .zip and unzipped, it contains XML files that encode all the information in the presentation. We coded a program in Python 3 to parse these text XML files and retrieve the relevant information from the CLD to automatically construct the data input files of the parameters.
2.3. Objective IIIa: empirical study of model properties
We present here our study of the sparse connection model and the dense connection model in detail as they are the most complete models that we developed and represent extremes in topology of how the peace factors can be connected. The ci,j parameters for the sparse connection model (shown in the results section) were developed from the strengths of the interactions between the 8 central peace factors in the core engine that were identified in 49 published studies [6, 19, 20] and proposed estimates for the remaining connections between the peripheral peace factors. The ci,j parameters for the dense connection model (also shown in the results section) were estimated from a proposed understanding of the peace factors and their interconnections using a scale of −3 (decisive inhibiting influence) to +3 (decisive enhancing influence).
Using the GUI to run numerical integrations of the mathematical model we determined the dynamical systems properties, namely, the number of attractors and the time evolution of the system to those attractors of the sparse and dense connection models. Our goal was to identify the most sensitive peace factors and how they affect the outcome of the system which could serve as a guide to interventions by policy makers. To do this we determined the results when we varied the initial conditions, changed the connection strengths between the peace factors, and held one peace factor at a time constant throughout the calculation, effectively changing it to a source node.
2.4. Objective IIIb: network theory driven study of model properties
In the previous section the effects of systematically varying parameters on the attractors and system dynamics were determined. In addition to that empirical trial-and-error approach, we also used network theory to identify the nodes or groups of nodes and connections that are most influential in determining the properties of the whole system [21, 22]. Many real networks display community structure, that is, some of their nodes tend to be more connected forming groups or modules. The importance of the existence of these clusters is that the information flow between the nodes which form a group is higher compared to the flows outside the group. Particularly, there are specific nodes which play an important role acting as brokers between the subgroups and their presence is important for the communication between different parts of the network. There are different algorithms to detect the communities in a given network. In our case, we used the methodology developed by Girvan and Newman [23] to detect modules in the network representing the CLD. To provide further insights in our analysis, we also computed the eigenvalues and eigenvectors of the ci,j matrix [24].
2.5. Objective IVa: measurements—databases
We used the Global Peace Index (GPI) [25] and its eight 'Pillars of Positive Peace' to measure PIR when a positive action of a member of one group is reciprocated by a positive action of a member of another group and NIR when a positive action by a member of one group is returned by a negative action of a member of another group. The GPI breaks down peace into eight 'Pillars of peace'. Each pillar is made up of several data points from the databases of several organizations that compile, measure, and quantify different sets of data from surveys, government reports, and expert opinions. These databases feed off of each other making it difficult to determine or validate the final sources of their data. We then examined each of the reports that the GPI uses, to sort the individual groups of data that these reports compile and assessed the data and methodology used to determine if the measurement can be used as a quantifier of PIR or NIR. For example, the GPI uses 'The Indices of Social Development' [26] as a source of data in developing the 'Pillars'. We normalized the scores from the datasets from 0 to 1 with 0 being a weak indicator and 1 being a strong indicator.
2.6. Objective IVb: measurements—Twitter hashtags
We used social media to quantitatively measure the peace factors PIR and NIR. To do this we:
- Identified distinct groups within a larger society.
- Mined tweets defining membership in the identified groups.
- Measured group intermingling by analyzing the mined tweets.
The Global Peace Index 2017 suggested a rise in populism amongst European countries. One source of contention amongst the population was in regards to refugees and the threat they may pose on citizens of European countries. We selected the city of London as the first region to analyze due to its rising anti-refugee sentiment, and English being its official language. Next we began developing methods to identify groups within the larger population of London. To identify groups we looked for hashtags that would support membership in one ideological group versus another. By defining groups this way, we could attempt to measure PIR by looking at mixed intergroup activities. We then also analyzed tweets from a much larger area, Northern Ireland, which is part of the United Kingdom.
- We used hashtag searching tools to scout for trending hashtags on Twitter. We started by looking for users who tweeted #refugeeswelcome and #refugeesnotwelcome. #refugeesnotwelcome led us to a more popular nationalist hashtag, #britainfirst. With the two hashtags defined we could begin data mining. To ensure the tweets accurately reflect the sentiment of London, we limited the tweet mining to geocode 51.5074, −0.1278. We used the same model to data mine tweets from Northern Ireland, with a focus on groups tweeting support for hashtags #unionist and #nationalist on longitude and latitude 54.584 11, –6.833 62.
- The tweets were mined using Python scripts and tweepy API calls [27]. The program would identify and save usernames that tweeted our selected hashtags. Once the usernames were identified, the script would traverse through each user timeline and pull their most recent 200 tweets. The tweets would then be warehoused for further analysis. Due to limitations in the tweepy API, we mined the tweets over multiple iterations of data mining.
- Our goal was to identify interdependence and intermingling between the two groups having opposing opinions on a major factor of global peace. To do this we selected the most popular sport in England, football (soccer). London has crowds of over 15 000 attending regular season games with that number rising to 30 000–40 000 for playoff games [28]. We wanted to find intermingling between both groups at local events by looking at their tweets in support of local teams. We searched through the Twitter users timelines for tweets mentioning the following teams located in London: Arsenal, Chelsea, Crystal Palace, Tottenham Hotspur, West Ham United, Brentford, Millwall, Barnet, and Bromley.
- The search was done using Python IO modules along with string processing. We iterated through the dataset and matched tweets mentioning the teams listed above. The results were then aggregated programmatically and written to text files. We then pulled local ethnic demographic information by borough [29]. This was then compared to the results extracted from Twitter.
2.7. Objective IVc: measurements—Twitter sentiment analysis
We measured two influential key factors in the core engine of the sustainable peace map: Intergroup Historical Memory and Intergroup Future Goals and expectations. This was done by collecting an additional set of tweets (separate from those described in the previous section) from the cities of London and Belfast and the city-state of Singapore because of the large percentage of English speakers in those locations.
- Two lists of key-terms were created; one with words relating to the future, and the other with terms relating to the past. The assumption is that the presence of one or more of the keywords in a sentence would indicate that the sentence is referring to either the past or future.
- Words used for past: Yesterday, last week, last year, ago, in the past, in the 60s, in the 70s, in the 80s, in the 90s, earlier, before the, prior to, historically, back in the day, once, recently, previously, formerly, memory, memories, old days, antiquity, retrospect.
- Words used for future: Future, Tomorrow, Next week, Next year, Expect, Expecting, Upcoming, Should, Anticipate, Approaching, Nearing, Await, Predict, will go, Will be, Year 2020, Year 2030, Next decade, Soon, Time to come, Eventual, Later, Lie ahead, Look forward.
- Using the API search from the tweepy [27] module in Python we scraped tweets in English containing keywords from the selected locations. We gathered tweets from a 40 km radius around 51.507 N 0.128 W for London, 40 km radius around 54.597 N 5.930 W for Belfast, and a 30 km radius around 1.352 N 103.820 E for Singapore. We also gathered a similar number of tweets with no specified keywords, to create a random sample for comparison. The tweets gathered are only from users who chose to share their location. We did not filter out re-tweets. However, those were marked for future filtration.
- For each tweet, the sentiment scores of each word were obtained using the pos score() ans neg score() methods of swn.senti synsets in the nltk [30] module in Python. This is a lexicon based unigram classifier, which returns positive and negative scores between 0 and 1 for the most common usage each word and is independent of its context in the sentence. The scores for each tweet were summed, adding the negative scores as negative values.
- Tweets from London and Belfast were gathered between 19 November 2017 and 2 January 2018. Tweets from Singapore were gathered between 27 December 2017 and 27 February 2018. At the time the analysis was done, there was a volume of close to 10 000 Tweets per city per time. We note that the sentiment of tweets depends on the time period chosen [31].
3. Results
3.1. Objective I: GUI
We developed a program that provides a user-friendly GUI for the mathematical model so that social scientists or policy makers, can by themselves, explore the effects of changing the variables and parameters in the system by mouse clicks and data entry widgets. It plots graphs of how the peace factors evolve in time from initial conditions as well as final states in an intuitive way where the final values of the variables are represented by the text size of the name each of each variable. It was coded in Python 3 using the Tkinter package and we have made it available as open source (MIT license) on GitHub [32]. Further modifications of this program also served as the starting point for the software developed to determine the properties of the mathematical model [33].
3.2. Objective II: input from CLDs on PowerPoint slides
Our program that can automatically transform a qualitative CLD drawn as a PowerPoint slide into the input files needed for the mathematical model was also coded in Python 3. We have made it available as open source (MIT license) on GitHub along with various examples and documentation to run the scripts [32].
3.3. Objective IIIa: empirical study of model properties
- Over a wide range of initial conditions and parameters these systems have only two attractors: a 'Good' attractor with large values for the positive peace factors and small (or zero) values for the negative peace factors; and a 'Bad' attractor with large values for the negative peace factors and small (or zero) for the positive peace factors. As shown in figure 2, over most initial conditions, the dense connection model ends up in the 'Good' attractor. Only if the initial values of the positive peace factors are made very small (0.1) and the the negative peace factors very large (10.0) does this system reach the 'Bad' attractor. On the other hand, over most initial conditions, the sparse connection model reaches the 'Bad' attractor. Only if the initial values of the positive peace factors are made very large (10.0) and the the negative peace factors very small (0.10) does this system reach the 'Good' attractor.
- When we changed the connections strengths, additional attractors were created. For example, when we weakened the connections from the negative to the positive peace factors that split the system into separate independent communities with high values for both the positive and negative peace factors.
- To evaluate importance of individual peace factors in determining the system properties and understand the consequences of policy interventions, we fixed the value of one peace factor at a time and computed a global measure of the system, the average value of the positive minus the average value of the negative peace factors. This is equivalent to making that peace factor a source node. As shown in figure 3, as we varied that fixed value, some peace factors drove a sharp phase transition in the system, for example, switching Constructive Processes and Institutions from 0.622 69 to 0.622 70 flips the system from the 'Bad' to the 'Good' attractor. On the other hand, some nodes had little effect on the system properties.
- Because negative emotions have stronger and more long-lasting effects than positive emotions [16], those stronger interactions within the negative peace factors of the core engine self-reinforces those negative peace factors pushing the positive peace factors towards zero bringing the system to the 'Bad' attractor. We are able flip the system to the 'Good' attractor by increasing the connection strengths from the positive to the negative peace factors, by changing certain 'leverage' peace factors to sources, or by increasing the number of positive variables to overload the negative.
- Since both the topology of the network (as in the dense connection model) or the specific connection strengths (as can be done in the sparse connection model) can lead to sustainable peace, this suggests that thoughtful policy interventions may need to be situationally dependent to achieve the same successful results in different situations.

Figure 2. Initial conditions (left) and final steady state values (right) of the peace factors at their attractors. Top: sparse connection model. Bottom: dense connection model.
Download figure:
Standard image High-resolution image
Figure 3. Effect on  when a single peace factor is held constant. From left to right for the sparse connection model: Constructive Processes and Institutions, Positive Intergroup Reciprocity, and Promotive Intergroup Normative Processes.
Download figure:
Standard image High-resolution image3.4. Objective IIIb: network theory driven study of model properties
The application of these methods were helpful, but not always conclusive. This is because those methods have typically been developed to analyze networks where ci,j = (0, 1). The results of the community analysis for the sparse connection model are shown in figure 4. For the dense connection model, the application of the community structure analysis is not conclusive because the high connectivity present among most nodes does not allow detecting subgroups with a clear tendency of a noticeable internal connectivity.
- The community analysis [23] identified three separate communities of peace factors as shown in figure 4. The first community at the upper left consists of the factors: Free Flow of Information, Procedural Justice, Constructive Conflict Management, Safety and Security, Norms and Values Devaluing Violence, Rule of Law, Equitable Distribution of Resources, Basic Need Satisfaction, and Sustainable Development. This community can be characterized as 'justice/law/conflict management'. The second community at the center consists of the factors: NIR, Negative Intergroup History, Negative Intergroup Goals and Expectations, PIR, Positive Intergroup History, and Positive Intergroup Goals and Expectations. This community is our original core engine of six peace factors that can be characterized as 'reciprocity in relationships over time'. The third community at the right consists of the factors: Vision of Peace, Overarching Governance, Peaceful Leaders and Elite, Shared Identity, Peace Education Socialization, Ceremonies and Symbols Celebrating Peace, Cross-cutting Structures, and Self-Transcendent Values and Norms This community can be described as 'peace system elements'. This community analysis also identified that the factors, Constructive Conflict Management and Promotive Intergroup Normative Pressures, play an important role as the gatekeepers between the core engine and the two communities of the other factors. This was supported by our analysis where fixing the value of those two factors was much more influential than other factors in switching the system from the 'Bad' to the 'Good' attractor. These communities of 'reciprocity in relationships over time' , 'justice/law/conflict management', and 'peace system elements' resonant with these concepts that have been noted in previous studies of peace and peace systems.
- For the dense connection model the largest component of the eigenvector, associated with the largest eigenvalue, correctly identified NIR as the peace factor with largest value at long times. For the dense connection model the largest components of that eigenvector did not match the peace factors with the largest values at long times. That result is not surprising as the eigenvalue-eigenvector analysis assumes that
 and that the system is essentially linear while in our system some ci,j < 0 and it is nonlinear as peace factors xi < 0 are reset to xi = 0. We hope that the need to analyze networks, such as the ones presented here, will provide an incentive to develop tools that can better analyze directed, weighted networks where the ci,j are positive and negative real numbers.


Figure 4. Community structure analysis of the sparse connection model where three groups are identified.
Download figure:
Standard image High-resolution image3.5. Objective IVa: measurements—databases
We were able to measure quantitative empirical values or PIR and NIR from the GPI database.
- PIR: The Indices of Social Development—Inclusion of Minorities. Inclusion of Minorities measures levels of discrimination against vulnerable groups such as indigenous peoples, migrants, refugees, or lower caste groups. The components being measured include—the level of inclusion of minorities using indicators which are based on direct measurement of social institutions and their outcomes, and perception-based indicators, based on assessments by public opinion surveys, private agencies and non-governmental organizations, and proxy measures to measure the access to jobs and educational attainment. In the United States the score is 0.56, a high value of PIR.
- NIR: The Indices of Social Development—Intergroup Cohesion. Intergroup cohesion refers to relations of cooperation and respect between identity groups in a society. The components being measured include—data on the number of reported incidents of riots, terrorist acts, assassinations, and kidnapings; agency ratings on the likelihood of civil disorder, terrorism and social instability; and reported levels of engagement in violent riots, strikes, and confrontations. These are all signs of NIR. For the United States the score is 0.27, a low value of NIR.
- The GPI [25] and similar databases provide good resources for measures of PIR and NIR.
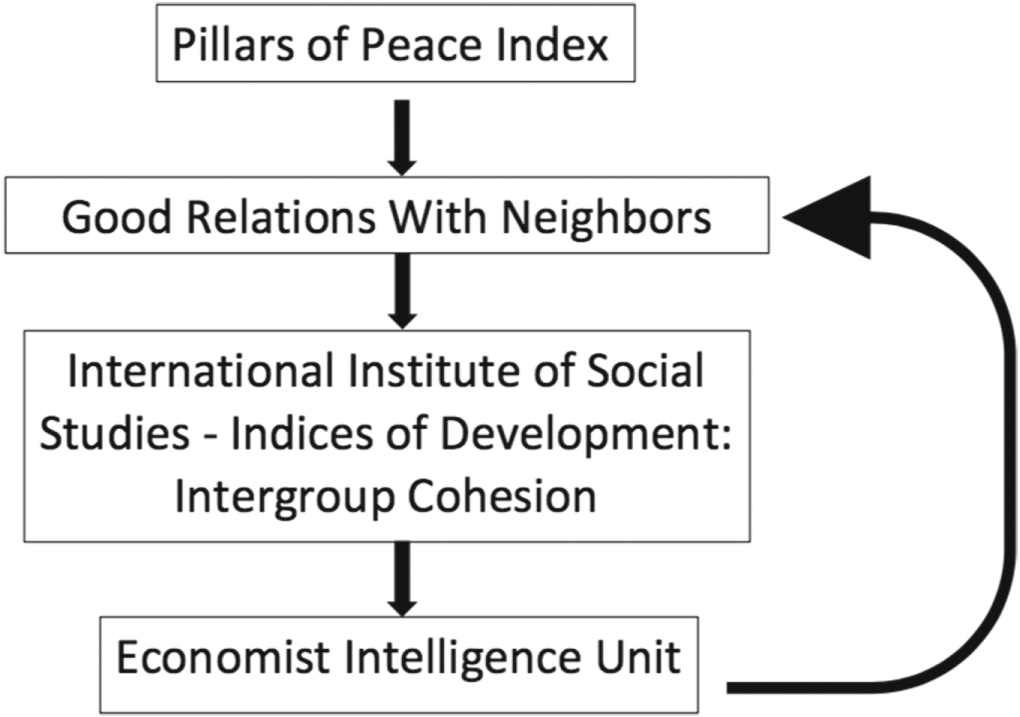
- However, as shown in figure 5, these databases have interlocking and sometimes not fully annotated sources of data.
- As an example, using these sources, the United States ranks high on PIR at 0.56 and low on NIR at 0.27 on a scale of [0, 1].

Figure 5. Sources of data in the pillars of peace from the Global Peace Index.
Download figure:
Standard image High-resolution image3.6. Objective IVb: measurements—Twitter hastags
The Twitter hashtag analysis, shown in figure 6, yielded empirical data on PIR and NIR. We used the Python modules matplotlib, seaborn and graphviz to read the aggregated results and prepare visualizations of our findings [34–36]. Our initial data mining efforts suggested that the groups are intermingling by supporting the same local sports teams. To verify the findings, we used the two tailed t-test to test statistical significance between samples collected over the course of multiple data mining iterations. Our comparison between samples of support for teams by users who tweeted #refugeeswelcome and those who tweeted #BritainFirst found no significant difference for five out of the six teams tested (Arsenal P = 0.0482, all others P > 0.148). This shows that regardless of the ethnic and idealogical make up of the towns, PIR exists between the groups supporting many local teams. This pilot study shows that social media data can be used to measure variables such as PIR and NIR.

Figure 6. Results and local demographics.
Download figure:
Standard image High-resolution image3.7. Objective IVc: measurements—Twitter sentiment analysis
The results of the sentiment analysis of Twitter posts are shown in figure 7 and table 1.
- The mean scores for all of the data collected was slightly positive, which was surprising.
- The overall trend for each locations is: the mean positive sentiment of the future is greater than the mean for the past, which is grater than the mean score for the random tweets, namely, Future > Past > Random.
- London future > London past (p = 0.0042), and London past > London random (p = 1.15 × 10⁻⁴). Belfast future > Belfast past (p = 1.54 × 10⁻⁸) and Belfast past > Belfast random but not significantly so (p = 0.369). Singapore future > Singapore past (p = 0.0071) and Singapore past > Singapore random (p = 6.16 × 10⁻⁷).
- The result above is predicted by the mathematical model. When the system ends up in a positive attractor, the Positive Future Goals and Expectations peace factor is larger than the Positive Historical Memory peace factor.
- The mean score for the random tweets London is greater than the mean for random tweets in Belfast, but not significantly so (p = 0.097). The random score for Belfast is greater than the mean score of random tweets in Singapore (p = 0.0002).

Figure 7. Mean positive sentiments for London, Belfast, and Singapore for tweets about the Future (F), Past (P), and Random tweets (R).
Download figure:
Standard image High-resolution image
Table 1. Mean sentiment ± standard error of the mean for London, Belfast, and Singapore.
| London | Belfast | Singapore | |
|---|---|---|---|
| Future | 0.229 ± 0.006 | 0.230 ± 0.008 | 0.196 ± 0.005 |
| Past | 0.208 ± 0.006 | 0.172 ± 0.007 | 0.178 ± 0.005 |
| Random | 0.181 ± 0.005 | 0.169 ± 0.005 | 0.143 ± 0.005 |
4. Conclusions
- We showed how a representation using qualitative CLDs can be useful in identifying the factors relevant to sustaining peace and how they interact with each other. This provides a graphic realization of this complex system and is the starting point for exploring what factors might be missing and formulating new hypothesis to test about the system.
- We showed how such a qualitative CLD can be turned into a quantitative mathematical model of ordinary differential equations. We then used that mathematical model to determine the attractors in the system, the dynamics of the approach to those attractors and the factors and connections that play the most important role in determining the final state of the system. The most important result of this analysis is that since negative emotions have stronger and more long-lasting effects than positive emotions, those stronger interactions self-reinforce the negative peace factors reducing the positive peace factors and pushing the system far from peace. This situation can be overcome and the system brought closer to peace by increasing the connection strengths from the positive to the negative peace factors, by enhancing 'leverage' peace factors that connect different communities of peace factors, or by increasing the number of positive peace factors to overload the negative ones. Since both the topology of the network or the specific connection strengths can lead to sustainable peace, this means that thoughtful policy interventions may need to be situationally dependent. That is, different approaches may need to be used to achieve peace in different situations.
- Given sufficiently clear operational definitions of the peace factors, we showed that we can use modern data science methods from structured and unstructured data (such as Twitter) to provide empirical quantitative measures of the peace factors such as positive and NIR, positive and negative intergroup historical memories, and positive and negative intergroup goals and expectations. This provides a proof of concept that in future work we may be able to measure all the peace factors in this system and then use those empirical measurements to test, improve, and eventually validate a quantitative model with predictive analytics for policy makers to assess the effects of interventions in the system.
- We also developed and have made available on GitHub, computational tools that can have useful application to other social science research and business management applications. One program can automatically transform a qualitative CLD drawn as a PowerPoint slide used by social scientists into the input files needed for the mathematical model used by physical scientists to compute the properties of those mathematical models. Another program provides a GUI for the mathematical model so that social scientists or policy makers, can by themselves, explore the effects of changing the variables and parameters in these systems.
- These results demonstrate that complex systems analysis methods, previously developed and applied to physical and biological systems, can also be productively applied to analyze social systems such as those needed for sustainable peace.
Conflicts of interest
The authors declare that they have no conflicts of interest in relation to this article.