


Abstract
We report on the observation of coherent terahertz (THz) emission from the quasi-one-dimensional charge-density wave (CDW) system, blue bronze (K0.3MoO3), upon photo-excitation with ultrashort near-infrared optical pulses. The emission contains a broadband, low-frequency component due to the photo-Dember effect, which is present over the whole temperature range studied (30–300 K), as well as a narrow-band doublet centered at 1.5 THz, which is only observed in the CDW state and results from the generation of coherent transverse-optical phonons polarized perpendicular to the incommensurate CDW b-axis. As K0.3MoO3 is centrosymmetric, the lowest-order generation mechanism which can account for the polarization dependence of the phonon emission involves either a static surface field or quadrupolar terms due to the optical field gradients at the surface. This phonon signature is also present in the ground-state conductivity, and decays in strength with increasing temperature to vanish above  , i.e. significantly below the CDW transition temperature. The temporal behavior of the phonon emission can be well described by a simple model with two coupled modes, which initially oscillate with opposite polarity.
Export citation and abstract BibTeX RIS

Original content from this work may be used under the terms of the Creative Commons Attribution 3.0 licence. Any further distribution of this work must maintain attribution to the author(s) and the title of the work, journal citation and DOI.
1. Introduction
The non-equilibrium dynamics of complex solids, following ultrafast excitation, continues to be an important avenue to elucidate the coupling between the various degrees of freedom (electron, spin and lattice) and their resultant ordered phases, as it allows one to track the evolution following selective excitation, and capture signatures of transient non-thermalized states and quasi-particle populations [1–3]. Here low-dimensional electronic systems which possess charge-density-wave (CDW) phases [4–6] are important examples, as their broken-symmetry ground-states (GSs) often involve a coupled periodic lattice distortion which is driven by strong electron–phonon coupling. While the basic theories to describe CDW states are quite mature [5, 7], the roles of specific interactions in many materials remain open questions, especially for complex crystals, which are still highly challenging for ab initio theory. Moreover, the discovery of competing CDW phases, e.g. in high- superconductors [8] has led to renewed interest in the context of materials with strong electronic correlations. The low-energy excitations (i.e. in the meV-range) are particularly important probes of the CDW physics, as their quanta can involve a strong mixing of charge and lattice coordinates.
Here we focus on a well-established, quasi-one-dimensional CDW material, blue bronze (K0.3MoO3), which undergoes a transition to an incommensurate CDW phase below  [7], with an associated modulation imposed on the centrosymmetric, monoclinic structure (space group C2/m) [9]. This system has been studied intensively with both equilibrium [10, 11] and time-domain [5, 6, 12, 13] spectroscopies, mostly focusing on electromagnetic excitation and probing of the incommensurate CDW along the b-axis, where the amplitude [12, 14] and phase [13] modes can be resolved. We recently applied coherent terahertz (THz) spectroscopy to the excited-state (ES) evolution and temperature dependence of the phase modes [13], which indicated that electronic impurities (which lead to nonlinear CDW transport) and screening by photo-excited carriers play an important role.
In this paper, we apply a complementary time-resolved THz study, in experiments where the coherent THz emission following ultrafast electronic excitation (i.e. in the absence of a THz probe pulse) is measured. The generation of coherent phonons (typically with frequencies in the THz range) by sub-picosecond optical excitation is a well-established technique [15–19], especially for Raman-active modes (probed by coherent oscillations in the inter-band permittivity), mostly in conventional semiconductors and semimetals [20], but also for more complex inorganic crystals [21, 22]. In comparison, studies of phonon emission from IR-active modes are significantly fewer [23–26], and only recently have such studies been extended to more complex solids [27–29]. As discussed in detail below, different physical mechanisms have been invoked to account for the generation of both transverse and longitudinal optical (TO, LO) phonons in different scenarios. The first mechanism involves transient stimulated Raman scattering (TSRS) [17, 27, 30–33], which comprises both the impulsive and displacive limits for the phonon oscillations (the latter historically referred to as 'displacive excitation of coherent phonons'), depending on the nature of the electronic excitation [30, 31]. A second mechanism, often responsible for excitation of IR-active LO phonons, is due to coupling to longitudinal surface fields which are either generated, or screened [34], by the excited carriers—the generation case corresponding to the photo-Dember (PD) effect [24–26, 29, 35] (see section 3), as introduced in [23] to account for the THz emission. However, in this report, we observe emission from IR-active TO phonons, whose excitation mechanism differs from the cases above.
The main findings of the paper are summarized in the scheme in figure 1(a), i.e. we observe both a low-frequency broadband emission (polarized in the plane of incidence) due to the PD effect (blue curves), as well as a long-lived coherent phonon emission (red curves), which is composed of the temporal interference of two near-degenerate modes (with opposite initial polarity), whose field polarization remains perpendicular to the b-axis (i.e. lies in the a–c plane). While only very few studies focused on electrodynamics in the a–c plane [36] (mostly to characterize the highly anisotropic DC transport [37]), these directions in the lattice are still relevant for the CDW physics, as 3D order plays an important role [7, 38]. As shown in figure 1(b), in the CDW phase there is also a commensurate modulation along the c* direction with  , which is favored in order to minimize the inter-layer Coulomb energy [39, 40]. As shown below, the spectral characteristics of this near-degenerate phonon doublet (centered about
  ) are close to those observed in the GS conductivity spectrum, which was measured in a previous FTIR reflection study by other authors [36] for polarization along the z-direction (labeled 'FTIR pol.' in figure 1(a)). However, in [36] the main emphasis was on the behavior of modes further into the mid-IR, and these features in the THz spectral region were not visible in the presentation of the data. For the GS conductivity spectrum, one can readily assign the bands to TO (and not LO) phonons. The relevant range of their extracted conductivity spectra is shown in figure 1(c), where the phonon doublet is clearly observed at
  , and collapses and vanishes in going above 100 K (which we address later in the paper). Preliminary THz time-domain spectroscopy reflection measurements performed polarized along the [102] direction (in the
  surface) also indicate a phonon signature in this frequency range with the same T-dependence, i.e. the phonon dipole is in the a–c plane at an angle to both the [102] and z axes. We note that this phonon mode is distinct from the phase-modes which we previously identified polarized along the b-axis (the nearest of which lies at
  [13]).

Figure 1. (a) Scheme of photo-induced THz emission contributions versus crystal orientation for moderate excitation fluence (blue: photo-Dember, p-polarized for both orientations; red: coherent phonon interference, perpendicular to b-axis). (b) Crystal structure of K0.3MoO3 in the modulated CDW phase (at  , based on the approximate 1 × 4 × 2 commensurate supercell [9]) looking at the a–c-plane perpendicular to the
  -surface and the incommensurate CDW b-axis. The commensurate modulation along the c-direction corresponds to cell doubling along this direction for the approximate commensurate supercell, as indicated. The lattice distortion is amplified by a factor 20 to aid visual inspection. The drawing also includes the definition of the laboratory reference frame used for the model based on third-order nonlinear THz emission with a surface field. (c) Ground-state THz conductivity spectra from far-infrared FTIR reflection experiments in [36] for field polarized along the z-direction (i.e. perpendicular to [010] and [102], as indicated in (b)), in the spectral range of the coherent phonon emission for three selected temperatures. (d) Schematic of coherent THz emission experiment (also indicating THz probe beam input via Si beam-splitter, as used for pre-alignment via the optical-pump THz-probe signal [13]).
Download figure:
Standard image High-resolution imageIn the following, we first demonstrate the atypical polarization behavior of the phonon emission and discuss the symmetry properties for a displacive excitation in terms of a phenomenological nonlinear optical framework. We then analyze the time-resolved coherent emission at  including a coupled-oscillator model to account for the beating of two near-degenerate modes, and finally discuss the temperature dependence of the coupled phonon emission, which also vanishes well below the CDW transition temperature.
2. Experimental details
The single crystals of K0.3MoO3 investigated in this study were grown by the temperature gradient flux method [41], with lateral dimensions of  , and the as-grown
  surface was sufficiently smooth to use without further polishing. The setup used for the THz emission experiments is similar to that used for optical-pump THz-probe measurements in [13], based on a femtosecond Ti:Al2O3 amplifier laser (
 ), as shown in figure 1(d). The optical pump beam was brought down to a beam diameter of
  on the sample, which was mounted in a liquid-helium cryostat (Oxford Microstat, equipped with a 50 μm thick polypropylene window to avoid losses for the emitted THz radiation). The divergent THz emission from the sample is then collimated by an off-axis paraboloidal mirror (OAPM, effective focal length
  ). We used a geometry where the optical pump beam is incident on the sample at a small angle (
 ), and the sample is tilted so that the OAPM axis is aligned with the axis of the reflected pump beam (and hence, the phase-matching angle for THz emission), which also allows one to discard the optical pump beam via a small hole bored in the OAPM. The emitted THz radiation is then guided to the detector via a Si wafer reflector, wire-grid polarizer, Au mirror and indium-tin-oxide dichroic beam-splitter, and is focused with the optical detection pulse by a second OAPM (
 ) into a 0.5 mm thick ZnTe crystal to allow electro-optic time-domain sampling of the temporal THz field [42, 43]. In order to switch between detection of p- and s-polarized THz field components, we rotated both the wire-grid polarizer and the ZnTe crystal together. For these weak signals, we typically averaged over 50–100 temporal scans (with a 50 ms lock-in time constant), with intensity spectra then calculated via numerical Fourier transformation. From the multi-scan data, we can determine the standard error
  of each point in the THz field signal
  , which can then be carried over to confidence intervals for each point in the calculated intensity spectra
  using a numerical method described previously [44]. In the spectra here, we show the 95%-confidence intervals, i.e. a non-zero value of the lower confidence bound implies finite signal with 95% statistical certainty.
3. Polarization dependence and origin of emission contributions
We first discuss the dependence of the THz emission on the orientation of the sample and the polarization of the signal, at  and with a moderate excitation fluence of
  , as summarized in figure 2. As shown in figure 2(a), the p-polarized emission (parallel to the b-axis) corresponds to a low-frequency (
 ) broadband emission, whose temporal field performs
  damped oscillations in the time window measured here with continuously decreasing frequency. Such emission for this geometry is typical for materials with short optical absorption lengths (
 at
at  for K0.3MoO3 [12]) and photon energies well above the band-gap (such that the excited carriers have significant excess energy), i.e. arising from the PD effect. The PD emission is due to charge separation perpendicular to the surface from the ambipolar diffusion of electrons and holes (whose mobility, and hence diffusion coefficients are usually different) driven by the steep excitation gradient, which possesses a finite component along the p-polarized direction for oblique incidence of the pump beam.
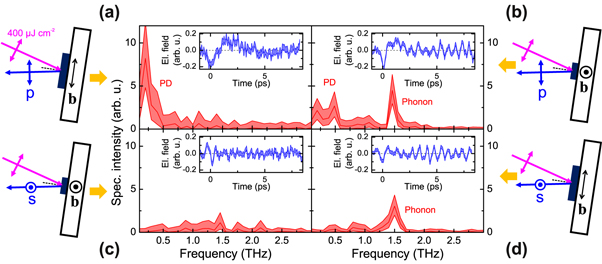
Figure 2. Dependence of THz emission (for  and excitation fluence
  ) on the relative directions of the crystal axes and detected THz polarization, as indicated in the schemes (sample viewed from above). Main plots show the intensity spectra (common scale, including 95%-confidence intervals), calculated from the detected time-domain fields (shown in insets, as ±σ error regions). Labels denote contributions from photo-Dember ('PD', in (a), (b)) and coherent phonon emission ('Phonon', in (b), (d)).
Download figure:
Standard image High-resolution imageUpon rotating the sample about its normal, such that the b-axis is now perpendicular to the plane of incidence (figure 2(b)), one still observes the PD signature at low frequencies. However, an additional narrow-band emission band at  is clearly resolved. That this emission component is locked to the crystallographic axes is confirmed by rotating both sample and detected THz polarization (figures 2(c) and (d)), whereby the phonon is again only detected for
  , and the PD component vanishes as expected for the s-polarization direction. In the insets of figures 2(b) and (d), one observes that the temporal envelope of the phonon contribution appears to rise to a maximum some ps after t = 0. As shown in the next section with higher spectral resolution, this phonon signature is indeed a near-degenerate doublet, which correlates strongly with the GS conductivity spectrum along the z-direction shown in figure 1(c).
As mentioned in the introduction, coherent phonon emission from ultrafast photo-excited surfaces has been previously observed in a broad range of materials, with two main mechanisms invoked to account for the pump-induced phonon generation. The first involves the excitation of LO phonons perpendicular to the surface, which are driven by their coupling to the rapid field gradients built up by the PD effect [23–26, 29]—referred to hereon as the PD–LO mechanism. The transverse-longitudinal incompatibility which prevents coupling between LO phonons and a THz electromagnetic field in the bulk is relaxed due to the sub-THz-wavelength excitation depth. Besides relatively simple crystals such as InSb [24] and Te [23], the PD–LO mechanism has been established for more complex solids such as hybrid perovskites [29]. While the bands in the GS conductivity spectrum (figure 1(c)) must be due to TO phonons, one could consider whether the phonon emission here is due to the corresponding LO phonons (with a small LO–TO splitting due to the weak oscillator strength of the bands).
However, two key features of the data in figure 2 deviate from the expected PD–LO behavior. Firstly, the PD and phonon contributions do not maintain a parallel polarization, with the phonon emission instead following the crystal azimuthal orientation. While quasi-LO phonons can indeed possess a polarization component perpendicular to their wavevector (especially in media with complex unit cells [45, 46]), one still expects at least a finite longitudinal component which should remain p-polarized as per the PD emission. Secondly, in previous studies, the bandwidth of the PD emission extended out to that of the driven phonon, whereas here it falls away (at least, below the noise floor of the measurements) well below 1.5 THz. The spectral overlap requirement is equivalent to the PD fields forming sufficiently rapidly to trigger the phonon motion coherently.
A second possible mechanism involves TSRS which can couple to coincident IR-active phonon modes [27, 32, 33]—however, this is only allowed in non-centrosymmetric media and hence is not expected in K0.3MoO3. While surface fields could indeed relax the selection rules for Raman/IR exclusion [47], we note that no Raman band at 1.5 THz ( ) was detected (probing either parallel or perpendicular to the b-axis) in back-scattered spontaneous Raman [11] and optical-pump Raman-reflection-probe studies [14].
To account for the excitation of the coherent phonon emission and its polarization dependence, we proceed here in terms of a general nonlinear optical framework. While such an approach is only strictly valid in the transparency region (i.e. for below band-gap excitation), it is also a reasonable approximation if one neglects dispersion [48, 49]. We firstly note that bulk  processes cannot be responsible for the emission, as the corresponding tensor vanishes in centrosymmetric media, such as K0.3MoO3. Moreover, and regardless of the symmetry class, an inspection of the selection rules for the surface-
 nonlinear susceptibility [50, 51] indicates that surface-induced difference-frequency generation cannot account for the polarization dependence of the phonon emission.
Instead, we propose an effective  mechanism involving the third-order nonlinear susceptibility, which results either due to the presence of a static surface field [52, 53], or quadrupolar terms arising from the spatial gradient of the optical fields [50, 51]. Surface fields due to Fermi-pinning by surface states are fairly common in doped semiconductors, and in other contexts can give rise to broadband THz emission [53] or narrow-band LO-phonon emission [34]. Pinning of the surface electric field in K0.3MoO3 could arise due to the termination of the alternating MoO3 and K+ layers parallel to the
  -surface (as well as the CDW modulation along the c* direction).
In the case of a surface field, the resulting THz polarization can be written as [48],

where Ek, El are the components of the complex optical-pump field amplitude,  the components of the constant surface field,
  are indices of the crystal axis system (summations over {j, k, l} are left implicit),
  is the THz frequency (where ω and
  correspond to frequency pairs within the spectral width of the optical pump pulse) and we already apply permutation symmetry to write the product in frequency-ordered form. The detailed physical response to photo-excitation is contained in the spectral (or equivalently, temporal) dependence and tensorial structure of
  . For the quadrupolar excitation mechanism, one replaces
  with ∂jEk in equation (1) [51]. One can show that both mechanisms yield the same qualitative results in the following, as their tensors have identical symmetry properties.
Considering the monoclinic  space group of K0.3MoO3, there are 41 independent non-zero
  elements, such that the analysis appears somewhat daunting. Fortunately the field geometry and the experimentally based assumption of optical isotropy for the near-IR pump field [54] reduce this to simple expressions for the components of the THz polarization. As derived in the appendix, this results in a THz polarization where
  for all relative orientations of the crystal/pump field, with a constant value of
  in the a–c plane (whose orientation relative to the
  -surface depends on the relative values of the unknown tensor components
  and
and  ), consistent with the observations in figure 2. Essentially, this result can be traced back to the mirror plane perpendicular to b for the
  space group (in combination with the optical isotropy), which forbids any THz emission polarized parallel to the b-axis. We note here that for higher excitation fluence (
 ), the 1.5 THz phonon signal was observed also with a component in the plane of incidence along with the b-axis (the geometry in figure 1(a)), as shown later in figure 4(b). We attribute this still to polarization in the a–c plane, i.e. due to a component along the z-axis (normal to the surface), which in the foregoing
  -treatment could be due to the emergence of higher-order nonlinear terms (e.g. involving two-photon excitation).
4. Temporal dynamics and phonon line splitting
As can already be seen in the insets of figures 2(b) and (d), the envelope of the phonon emission appears not to decay from a maximum at t = 0, as typically observed for coherent phonon emission, but exhibits a beating signature indicative of interference between near-degenerate modes. In order to study this in detail, we performed measurements with superior spectral resolution (i.e. longer time window) facilitated by using a higher excitation fluence ( ) to improve the signal-to-noise ratio. The temporal THz field and corresponding intensity spectrum from such a measurement at
  are shown in figures 3(a) and (b), respectively. Here the interference envelope is extremely clear, and the improved spectral resolution reveals two peaks in the intensity spectrum with a separation of
  , which closely resembles the GS conductivity along the z-direction measured previously [36] (figure 1(c)). We also show in figure 3(c) the corresponding spectrogram intensity, i.e.
  where
where  is a sliding-window Fourier transform of E(t), using a 4 ps wide window function w(t) to achieve a reasonable compromise between the temporal and spectral resolution (
 ). Here the interference is even more clearly discernible, and demonstrates a modulation depth close to unity. We also include the instantaneous mean frequency
  (where
  is the temporal marginal of Is), which reveals a small but significant modulation in the mean frequency with time. Spectrogram analysis of the data for the lower fluence (
 , time signal shown in figure 2) also exhibit similar growth from a near-zero signal about t = 0.

Figure 3. Coherent phonon emission with improved temporal range/spectral resolution (for  and excitation fluence
  ), with a horizontal b-axis and detecting the perpendicular s-polarized emission (as per figure 2(d)). (a) Temporal electric field and (b) corresponding intensity spectrum. (c) Spectrogram intensity Is(ν, t) calculated from the temporal field in (a), including the time-dependent center frequency
  calculated from the spectral first-moment of Is. Also included in (a) is the temporal envelope extracted from Is (i.e. the rms signal in the range
  , dashed curve), and vertical arrows to indicate the approximate positions of t = 0 and the first maximum and minimum of the temporal interference. In (b), the dashed red curve is the spectral marginal
  ), while the horizontal dashed lines indicate the peak positions of the GS phonon bands in figure 1(c) [36]. (d)–(f) Corresponding theoretical results from the coupled-oscillator model (see main text for details), assuming a constant coupling constant K. (g)–(i) As per (d)–(f), only assuming a time-dependent coupling constant. Note that vertical reference arrows in (d) and (g) are at the same positions as the experimental envelope in (a). (j) Time-dependent coupling parameter K1/2(t)/(2π) used in (g)–(i) and corresponding time-dependent coupled-oscillator eigenfrequencies
  .
.
Download figure:
Standard image High-resolution imageDifferent possible causes for this near-degenerate phonon doublet could be considered. One possibility is that one observes both TO and LO mode frequencies simultaneously, which can arise e.g. due to the lateral excitation profile [35] resulting in regions with low excitation density (where the intrinsic LO phonon frequency of a longitudinal phonon results) and regions with high density (where photo-excited carriers can screen the Coulomb forces associated with the LO phonon, resulting in the TO phonon frequency)—these two contributions can interfere if the excitation beam diameter is sub-THz-wavelength in dimension. However, that both peaks appear in the GS spectrum supports the assignment as two TO phonons.
In general, the periodic lattice distortion in the CDW state should lead to phonon zone-folding, and the appearance of new modes in the optical spectra. One scenario, whereby such an IR-active doublet would arise, involves the folding of two near-degenerate, transverse acoustic branches. In the case of molecular solids, one can ascribe the presence of such a doublet to Davydov (or 'correlation-field') coupling between molecular sub-units [11, 55–58]. For dimers in centrosymmetric media, this typically leads to a splitting with one mode IR-active and the other Raman-active [55, 57], although this exclusion rule does not hold if the phonon dipole moments of the two units are not identical [58]. Indeed, the notion of Davydov splitting in K0.3MoO3 has been considered previously for Raman modes polarized along the incommensurate b-axis direction [11]. For the present case, such an interaction between non-identical sub-units could result from the commensurate modulation along c*, which implies that neighboring sub-units in two adjacent layers are distorted relative to one another (see figure 1(b)). Formally, this is closely related to phonon zone-folding in the CDW phase [59]. In any case, as shown below, we need to invoke a coupling of these two modes in order to account for the precise temporal interference envelope of the THz emission, which can be readily built into a classical Davydov-like coupled oscillator treatment.
As the detailed phonon mode structure is presumably highly complex in K0.3MoO3 (and has not been analyzed theoretically), to develop a quantitative model for the results in figures 3(a)–(c), we consider a model of a single unit cell containing a representative dimer of two interacting molecular sub-units, which we assume to be distorted relative to each other due the modulation along the c* direction. The time-dependent dipole moment induced in each unit is taken as  where Qn (n = 1,2) represents the conformational coordinates of the nth sub-unit and
  the effective charges, and we allow
  to account for any asymmetry between the two units and the simplified scalar treatment. In general, the sub-units will be coupled with an interaction
  , which could arise from dipole–dipole interaction and/or steric interactions, and results in new eigenfrequencies να,β for the coupled system (see below). Upon electronic excitation, we assume that orbital contributions to the ES bands lead to a change in bonding/anti-bonding contributions and hence the equilibrium conformations and dipole moments (which could involve a partial suppression of the electronic CDW amplitude [5, 6]). Note that in previous reports on coherent phonon generation, it is assumed that due to ultrafast electron scattering (i.e. much faster than the phonon period), the symmetry of electronic orbital displacement can only excite totally symmetric
  Raman-active modes [17], as other modes are considered energetically unfavorable on group-theoretical grounds [18, 20]. Nevertheless, caveats to this rule have been asserted in the literature, i.e. either when the electronic scattering rate is sufficiently slow (i.e. at least some fraction of the THz phonon period) such that anisotropic orbital contributions can drive non-symmetric lattice displacements [31, 60], or due to the possible presence of a nearby structural phase transition [18]. While strong optical excitation of K0.3MoO3 can indeed drive structural changes, i.e. due to melting of the CDW lattice order [61], this is only significant for
  . Moreover the average C2/m structure is maintained (and its unit cell parameters do not change abruptly) at the CDW phase transition
  [62].
[62].
In the previous section, however, we found that a surface electric field (or quadrupole term) in combination with the low, monoclinic symmetry allows for a net THz polarization in the a–c plane even for optically isotropic excitation (at least within a nonlinear polarization ansatz). This is consistent with photo-excited dipole displacements of the two sub-units, which cancel precisely in the centrosymmetric bulk, but become asymmetric under the influence of the surface field. Ultimately, while the notion of displacive excitation of non-symmetric (IR-active) modes has not been reported to our knowledge for any system, we proceed with such a model due to its ability to quantitatively reproduce several features of the THz emission, as demonstrated in the following.
The predictions of the coupled-phonon model are yielded via integration of the equations of motion:

where  are the instantaneous equilibrium coordinates for each sub-unit, K = κ/m, and assuming degenerate uncoupled frequencies ω0 = 2πν0 and damping Γ. The coupled system has the steady-state eigenfrequencies
  and
and  , where
  . In the simulation, we take

where  are the ES displaced equilibria,
  the ES lifetime (
 is the Heaviside function), and we convolve with G(t) which represents the Gaussian temporal intensity profile of the pump pulse (here with 150 fs duration). The far-field THz emission is then calculated as per
  . Note that by taking
  and
and  , the solution to equation (3) is equivalent to the χ(3) polarization introduced in the last section.
The simulation results are shown in figures 3(d)–(f), based on the parameters  ,
,  and
and  . This reproduces certain aspects of the experimental data, i.e. temporal interference, spectral splitting and the small curvature in
  due to the somewhat higher amplitude of the
  -mode. However, a closer inspection of figures 3(a) and (d) shows that the simulated interference envelope is not consistent with experiment. This is evident from comparison of the vertical arrows in figures 3(a) and (d), which correspond to the time-zero, and first subsequent maximum and minimum of the interference envelope (i.e. based on the experimental data in all plots). Indeed, this emphasizes that the envelope does not have a simple sine-dependence, but that the first half-cycle is initially retarded, with the first maximum shifted by
  . Such an effect cannot be achieved by slowing the onset of the displacement functions
  , as then the excitation of the phonons is no longer coherent and the interference is destroyed.
However, a time dependence for the coupling  can indeed reproduce this effect. In figures 3(g)–(i) we show the results with the same parameters, only with a transient suppression of the coupling directly after excitation, i.e.
  with
with  (K(t) and the resultant eigenvalues
  are shown in figure 3(j)). Here one sees that the correspondence with experiment is greatly improved. Such a transient suppression of the coupling indeed seems reasonable, due to screening of the dipole interactions by the initially excited carriers. Hence the combination of a Davydov-type coupled-phonon interaction within the unit cell and photo-induced coordinate displacement can account for the spectro-temporal phonon emission characteristics well. Moreover, the agreement with experiment is essentially unchanged if one takes a much shorter lifetime
  for the photo-induced displacements
  in equation (3) (even down to 1 ps). Hence, the model also holds if one assumes that the system returns to a hot electronic GS on such a short time scale, as found in pump–probe experiments [12, 13, 63].
Some final comments considering the foregoing results should be noted. Firstly, for the case of photo-excited Raman-active phonons, the distinction between the impulsive and displacive limits (which manifest in the initial absolute phase  of the oscillations) was discussed in detail [17, 30, 31] as it reveals aspects of the excitation mechanism. While the model above assumed an anti-parallel displacive excitation of two sub-units (i.e. with Φ0 = 0, π), similar results could be obtained with an impulsive excitation (with
  ). However, due to the distorted temporal envelope and initial destructive interference (figure 3(a)) we cannot distinguish these two cases from our results. Moreover, we also considered other possible mechanisms which could give rise to the split phonon doublet. It is compelling that the impurity-pinned phason mode in K0.3MoO3 was measured with a peak at
  [10], close to the splitting of the observed doublet. Hence we cannot rule out that this mixes with the observed phonon to produce the observed lineshape. Finally, the near-commensurate modulation along the b-axis could, in principle, lead to phonon broadening/splitting, due to a slow modulation of local lattice bond strengths (and hence, phonon frequencies) [64, 65]. Here a splitting can result due to the sinusoidal spatial dependence of the distortion, which yields a distribution with peaks at the extrema of the modulation, as observed in NMR studies of incommensurately modulated crystals (e.g. in Rb2ZnCl4 [66]).
5. Temperature dependence
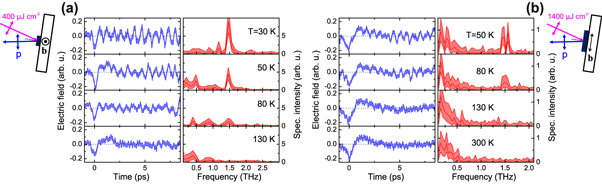
We now turn to the temperature dependence of the PD and phonon emission contributions. In figure 4 we show the temporal electric field and corresponding intensity spectra for two different excitation fluences and crystal axis orientations. As can be seen in figure 4(a), the strength of the coherent phonon band at 1.5 THz continuously decays with increasing T and can no longer be resolved at  , still well below the CDW transition temperature
  . The low-frequency broadband PD emission is more easily discernible in figure 4(b) where one has both a higher fluence and the more conducting b-axis is in the plane of incidence, and one observes that the PD emission is essentially temperature-independent, and persists even at
  , well above
  . Indeed, the near-IR optical properties are almost T-independent (e.g. comparing measurements at T = 100 and
  [54]), such that the generation of excited PD carriers should remain unchanged above
  —nevertheless, this attests that the changes due to lattice distortion and zone-folding in the bands associated with the CDW do not significantly affect the mobilities of the excited carriers.
Figure 4. Temperature dependence of THz emission: (a) for an excitation fluence  (b-axis vertical, p-polarized detection), and (b)
  (b-axis horizontal). Temperatures indicated in each spectral plot. Temporal electric fields in each set of left panels and corresponding intensity spectra in right panels. Error margins as per figure 2. Note that the measured time window is longer than shown in (b), yielding a superior frequency resolution compared to (a) which allows to resolve the phonon doublet.
Download figure:
Standard image High-resolution image
The more intriguing issue is why the coherent phonon emission vanishes well below  . A comparison of the emission spectra in figure 4 with the GS conductivity spectra in figure 1(c) shows a consistent T-dependence—hence this behavior is not related specifically to details of the excitation mechanism. We first consider the T-dependence of other low-energy IR- and Raman-active phonons investigated previously. The modes directly coupled to the incommensurate CDW, i.e. the Raman-active amplitude-modes [5, 11, 14] and IR-active phase-modes [13] indeed possess a marked T-dependence, as they are coupled to the electronic density modulation and hence depend on the CDW gap energy Δ(T). However, Δ(T) (and the bands of these modes) only change significantly above
  in approaching
  (whereupon the bands shift and broaden significantly). While some minor anomalies in the Raman spectra between 80 and 100 K were reported [11] (for the xx polarization, where
 ![$x\equiv [102]$](https://content.cld.iop.org/journals/1367-2630/21/1/013013/revision2/njpaaf81fieqn112.gif) ), the band strengths of those modes did not change significantly, at least between 40 and 120 K. The low-energy IR-active phonon modes polarized along the z-axis above
), the band strengths of those modes did not change significantly, at least between 40 and 120 K. The low-energy IR-active phonon modes polarized along the z-axis above  [36] also show no significant T-dependence in the relevant range here.
We can consider other T-dependent properties which might specifically affect this low-energy phonon doublet. For instance, in the Davydov-type model above, the relative distortion of neighboring sub-units in adjacent layers (due to the commensurate modulation along the c* direction) should play an important role in yielding the split phonon doublet. However, crystal structure studies show that the  modulation persists from
  down to at least
  [67]. The incommensurate modulation qb along the b-axis does indeed depend on T [37, 40, 68, 69], starting at
  for
for  and approaching a near-commensurate value just below
  as
as  , but already reaches a plateau at 100 K. Moreover, the average lattice parameters do not show any clear signature to correlate with the coherent phonon emission [62].
Being a narrow-gap semiconductor in the CDW phase, one property of K0.3MoO3 which shows a very strong T-dependence for  is the DC conductivity
  [70–73], due to the thermal excitation of carriers across the CDW gap. Indeed, in going from
  –
– , σ0 changes by over 5 orders of magnitude [37], along all three crystal directions b:[102]:z, where the conductivity ratio of 2000:100:1 remains approximately constant. Hence these carriers could affect the low-energy phonon modes considered here, via screening or an increase in the electron–phonon scattering rate. The latter effect seems unlikely, as one can see from the spectra in figures 1(c) and 4 that there is no significant band shift or broadening, rather the bands coalesce and their combined strength decays to zero. A screening effect could be considered though, which only affects this low-energy phonon doublet significantly, although this raises the question as to why the phase modes (polarized along the b-axis), with a similar low energy, maintain their band strength well above
  [13]. However, a comparison of the peak conductivity of the respective bands show that the phase modes [10, 13] have more than an order of magnitude higher band strength than for the phonon doublet here (based on the component along the z-direction in figure 1(c)), and hence would be less susceptible to such screening.
One other possibility is that there is a weak, secondary structural order parameter which decays to zero well below  , which was not resolved in previous crystal structure studies [62], such that the phonon modes are no longer zone-folded above
  . Similarly, we cannot rule out the emergence of the second-harmonic of the CDW wavevector in the periodic lattice distortion at low T, as observed for NbSe3 [74, 75], which would result in a different irreducible representation for the phonon spectrum. Here, further dedicated studies of the T-dependence of the superstructure, especially in the a–c plane, could provide a test of such hypotheses.
6. Conclusion
We have demonstrated photo-induced coherent THz phonon emission from a near-degenerate doublet at  in K0.3MoO3, polarized in the a–c plane perpendicular to the incommensurate CDW b-axis. The atypical polarization dependence of the phonon emission, and the assignment as TO phonons from their presence in ground-state spectra, rules out the ultrafast build-up of photo-Dember fields as the driving mechanism, while the absence of coincident Raman-allowed modes discounts the possibility that the observed doublet arises from excitation via transient stimulated Raman scattering. Hence we proposed an excitation mechanism where the bulk centrosymmetry is broken by either a surface electric field or due to quadrupolar terms While the assumption of displacive excitation for non-symmetric modes is usually ruled out, given that in previous studies only the A1(g) Raman modes were observed, we note that most studies concentrate on Raman-active modes and in crystals with higher symmetry than monoclinic. Indeed, a displaced coupled-oscillator model can account for the temporal and spectral characteristics of the phonon emission, with the inclusion of a transient suppression of the coupling to obtain quantitative agreement with the temporal interference envelope of the emission. We strongly advocate further studies of coherent phonon emission from such complex inorganic solids (including molecular crystals), as well as ab initio theoretical treatments of the phonon spectrum in K0.3MoO3. Also, ultrafast x-ray diffraction studies [61] could provide direct information on the lattice response to optical excitation. A compelling open issue is the role of the CDW on such phonon emission, which also is relevant for probing the CDW order in high-
 superconductors [76]. Indeed, the use of THz phonon emission may well offer useful complementary experiments for photo-induced phase transition experiments close to
  [61, 77].
Acknowledgments
We thank Martin Dressel for helpful discussions and kindly providing the ground-state conductivity spectral data [36]. We acknowledge Alfred Suttner for the growth of the K0.3MoO3 single crystals; SvS acknowledges support from the Deutsche Forschungsgemeinschaft (DFG, German Research Foundation) – 265092781.
Appendix:
We present here a short derivation of the results for THz emission in a third-order nonlinear framework with a surface field at the  -surface of a monoclinic C2/m crystal, as referred to in section 3 to account for the polarization dependence of the phonon emission, i.e. confined to the a–c plane. We emphasize that the selection rules for quadrupolar excitation and the field-induced nonlinearity are identical.
Starting with the general definition of the third-order nonlinear polarization [48], with a broadband optical field (with complex amplitude vector  ) and static surface field
  , we can invoke mathematical permutation symmetry to write the nonlinear polarization
  at the difference frequency
  in frequency-ordered form (i.e. equation (1)), where ijkl are the axial coordinates, and sums over jkl and integration of
  over the optical bandwidth is implied. The nonlinear tensor
  in general possesses 41 independent non-zero elements [48]. The transformation between the laboratory and crystal axes is as shown in figure 1(b), i.e.
  (and likewise for
  and
and  ), where capital indices refer to the laboratory frame I = X, Y, Z. The surface field is given by
  . While the orientation of the principal axes of the linear optical properties in monoclinic crystals in the a–c plane is non-trivial [78] (and depends on frequency), this does not affect the main results here and we take the crystallographic x-axis along a. Here M is a rotation matrix about the Y-axis by an angle,
which denotes the angle between the a-axis and the  -surface, in terms of the unit cell dimensions a, c and monoclinic angle β = 117.65° [9]. As the dispersion in the optical range is negligible over a range of at least some THz, one can drop the distinction between the optical fields at ω and
  , which allows one to take the optical fields as real and implies that
  (reducing the number of non-zero independent tensor elements to 28). Hence the THz polarization along the Ith laboratory axis can be written as:

The optical field can be written as

where θ is the angle of incidence and φ the polarization angle to the X-axis. While the explicit expressions for equation (4) are rather unwieldy, calculations show that for normal incidence (θ = 0) one may have a finite THz polarization in the XY-plane (i.e. the surface field  also breaks the symmetry for orthogonal components), although
  can still be non-zero for
  , contrary to the data in figures 2(a) and (c). However, inspection of the optical spectra for K0.3MoO3 show no significant polarization dependence for the optical properties in the near-infrared (at least for the measured [010] and [102] polarizations [54]). Hence we make a major step in assuming that the THz response is independent of the optical polarization, which assumes that both the electronic excitation and its net displacement effect on the THz phonon displacement are isotropic (the latter consistent with rapid electronic scattering). This translates to a diagonal, invariant form for the two optical indices of the tensor, i.e.
  (where m can be chosen freely from the non-zero elements). This reduces the tensor to 15 non-zero elements with 5 independent values (xxxx = xxyy = xxzz,
  , zzzz = zzxx = zzyy, xzyy = xzxx = xzzz, zxyy = zxxx = zxzz), although the terms yymm do not contribute in equation (4) as the surface field component
  . The THz polarization (equation (4)) is then independent of the optical field orientation and its components are given by:


where  and
and  . We note that the low, monoclinic symmetry plays an important role in this result, e.g. for a cubic symmetry, the transverse polarization vanishes under the same assumptions, leaving only
  parallel to the surface field.