


Abstract
Organizing cell divisions in an embryo, especially coordinating cell cycles across larger distances, is of crucial importance for the development of an animal. Here we show that cell-cycle times and cell volumes are anti-correlated during all phases of embryogenesis in the simple model organism Caenorhabditis elegans. By revisiting and significantly extending a previously proposed model, based on a limiting component, we arrive at a quantitative agreement with the experimental data for all stages of embryogenesis. The model not only rationalizes the average anti-correlation but also captures most of the cell-to-cell variations observed in experiments. Our findings suggest that inter-cell communication may not be mandatory to coordinate cell-cycle times in the embryogenesis of C. elegans. Rather, cells in this simple organism might decide autonomously about the next mitosis event by estimating their own volume via a limiting component. Together with several asymmetric cell divisions, a rather homogenous distribution of cell sizes is obtained at the onset of gastrulation, hence facilitating the inward motion of cells during subsequent stages of development.
Export citation and abstract BibTeX RIS

Original content from this work may be used under the terms of the Creative Commons Attribution 3.0 licence. Any further distribution of this work must maintain attribution to the author(s) and the title of the work, journal citation and DOI.
1. Introduction
Timing cell divisions during embryogenesis is crucial for the proper development of many multi-cellular organisms. Having too many or too few cells in an emerging tissue, for example, may reduce the fitness of the developing animal or it may even become lethal at embryonic stages. Progress through the cell cycle in eukaryotes is governed by an elaborate and widely conserved biochemical oscillator [1, 2] that allows individual cells to autonomously decide when mitosis, i.e. cell division, is initiated. To mutually coordinate their cell cycle oscillators, higher animals mostly rely on biochemical or even mechanical inter-cellular feedback loops [3–5].
As an alternative, cells could also use hard-wired look-up tables that define a deterministic sequence of cell divisions without the need for cell–cell communication. While this scenario may sound somewhat odd at first, simple model organisms like the small nematode Caenorhabditis elegans seem to exploit this possibility (see www.wormbook.org, especially [6–8]): the vast majority of adult C. elegans worms are hermaphrodites with an invariant total number of 959 somatic cells. These adults produce self-fertilized oocytes (zygotes) that are enveloped and protected by a stiff chitin eggshell. The autonomous development inside the eggshell, from a single cell to precisely 558 nuclei in about 550 cells (due to syncytial combination of nuclei), follows an invariant scheme of volume-conserving cell divisions, i.e. the cell lineage tree is the very same for all individuals (see figure 1(a) for the early lineage tree). C. elegans not only features an invariant cell lineage tree but also cell positions, migration paths, and division times during early embryogenesis are basically invariant, making the early development appear quite deterministic. Moreover, cell cycles in the early stages of development are reduced to S-phase and mitosis, i.e. many checkpoints for quality control during the cell cycle are omitted and the cells seem to run on a pre-configured autopilot through the required sequence of cell divisions.
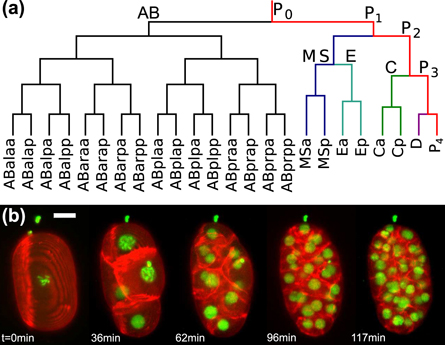
Figure 1. (a) Invariant early lineage tree of C. elegans until gastrulation. (b) Representative maximum projections of three-dimensional dual-color image stacks (taken with strain OD95), highlighting the sequence of developmental stages before and beyond the onset of gastrulation (scale bar: 10 μm). Gastrulation starts approximately in the fourth image (96 min).
Download figure:
Standard image High-resolution imageSupporting this almost deterministic appearance, we have shown earlier that mechanical interactions of cells determine cell positions and migration paths during the early embryogenesis of C. elegans [9, 10]. Moreover, cell cycle times and cell volumes have been observed to be anti-correlated until the onset of gastrulation and a limiting-component model was shown to quantitatively capture this relation [10]. Hence, cells seem to not really utilize hard-wired and pre-determined look-up tables, but they rather appear to exploit their initial volume and protein contents to decide autonomously on their progress through mitosis.
Here, we first revisit and discuss this limiting-component model, emphasize its generic nature by providing an additional molecular interpretation, and subsequently extend the model to developmental stages beyond the onset of gastrulation. From this extended model we derive predictions for the anti-correlation of cell volumes and interphase durations for most of the embryogenesis of C. elegans. We experimentally confirm these predictions and also provide evidence for an Arrhenius-like behavior of the model parameters. In addition, we confirm the prediction of an increasing asynchrony of cell divisions within a cell lineage, and we verify that the physical process of dividing a cell takes a period that depends on the cell type (somatic versus germline precursor) but is independent of the cell's volume. Altogether, our data suggest that cell–cell communication may not be mandatory for orchestrating cell division timing during the embryogenesis of C. elegans. Instead, autonomous decisions based on simple physico-chemical measures appear sufficient to arrive at a fail-safe developmental progress.
2. Materials and methods
2.1. Sample preparation and imaging
Worm culture, sample preparation and imaging on our custom built SPIM-setup was performed as described before [9–11]. In this study, embryos of strains OD95 and XA3501 were used: Strain XA3501 features labeled histones and tubulin (GFP::H2B + GFP::tbb-2 [12]), whereas strain OD95 has fluorescently labeled plasma membranes and histones (GFP::PH(PLC1δ1) + mCherry::his58, [13]). Embryos of strain OD95 were used to determine cellular volumes and cell cycle durations at 22.5 °C, strain XA3501 was used for temperature-dependent measurements of cell cycle durations.
In total, we used four different measurement series: in series No. 1, n = 11 embryos (OD95) were imaged at 22.5 °C for a total period of 3 h, with one stack in each channel taken every 30 s. In series No. 2, n = 5 embryos (OD95, 22.5 °C) were imaged for 4.5 h every 45 s in both channels. For all of these acquisitions, we tracked cell nuclei and segmented cells (see below). While acquisitions in the first series were tracked until the 44-cell state, tracking in the second series was carried out until about 90 cells were present.
In series No. 3 and No. 4, we only imaged the histone channel. Series No. 3 was again carried out on embryos of strain OD95 (n = 9) at 22.5 °C with a prolonged total measurement time (7 h). To avoid bleaching, the temporal resolution was reduced here to one stack acquisition every 60 s. Measurement series No. 4 was done at varying ambient temperatures in the range 15 °C–25 °C with n = (6–11) embryos (XA3501) imaged at each temperature for 3 h in intervals of 30 s.
2.2. Image analysis
Cell volumes were measured by segmentation of membrane labeled images as described before [11]. Cell nuclei were tracked with a custom-made tracking algorithm [9, 10] with an improved error correction possibility for higher precision of the data. From the trajectories, cell identities can be uniquely assigned based on the stereotypical lineage tree of C. elegans. After manually assigning each trajectory to a cell, its life time (i.e. cell cycle duration) was read out as the number of stacks in which it was observed, multiplied with the time lag between two stacks. Since cell cycle durations are read out via nuclei tracking, they were defined to last from anaphase of the mother cell to the next anaphase of the daughter cell. The read-out error of cell cycle durations hence is the time lag between two stacks.
Tracking becomes quite tedious beyond the 50-cell state due to strongly increasing error rates resulting from the limited resolution of the SPIM. For post-gastrulation data (measurement series No. 3) we hence did not track individual cells, but manually read out mean lineage-specific cell cycle durations of whole cell generations. To avoid a potential bias due to the evaluation approach, also pre-gastrulation data were re-analyzed in the same fashion. Cells of one generation within a specific lineage, e.g. the AB-lineage, generally divide rather synchronized and in waves. While the degree of synchronization is high for early cells, it gets more variable for later cells (see also our data below on fluctuations within a lineage generation). We therefore determined the period needed for cell division (defined via the point in time at which the first image stack showed the cell to be in anaphase) of one cell generation as the mean between the first and the last division within the current wave. Mean generation cell cycle durations are then the difference between consecutive mean division times.
To determine the duration of the mitosis event itself, we used a completely manual approach. For each analyzed cell, mitosis was defined to start as soon as the fluorescence signal of the nucleus became inhomogeneous due to chromatin condensation. Mitosis was defined to be complete at the onset of anaphase, i.e. when sister chromatids were transported into the daughter cells. Even though we may certainly miss parts of the mitosis event (ana- and telophase), we have chosen the named criterion as it turned out to be the only one that could always be detected unambiguously in the image series.
3. Modeling embryonic cell cycle durations
The cell cycle in all eucarytos is regulated by an elaborate and evolutionary conserved biochemical oscillator [1, 2]. At the heart of the cell cycle oscillator is a mitosis promoting factor (MPF) that essentially consists of a complex of cyclin B and activated Cdk1. Most organisms run the oscillator by varying the concentration of cyclin B while keeping the concentration of Cdk1 constant throughout the cell cycle: when exceeding a critical concentration, the MPF triggers an irreversible transition from interphase to mitosis. High MPF levels during mitosis induce a rapid degradation of cyclin B, leading eventually to a sub-critical MPF concentration right after cell division. In the subsequent interphase, cyclin B levels are replenished by protein synthesis, i.e. via transcription and translation, until the critical MPF concentration is reached again. In addition, time scales of the enrichment process in interphase can be tuned and fine-regulated by several auxiliary feedback loops (see [2] for discussion).
While C. elegans also utilizes this generic cell cycle oscillator with several essential cyclin protein species [14], transcription is known to be at least partially silenced in the early phase of development prior to the onset of gastrulation, i.e. until the 26-cell state [15–19] (see also discussion below). A poor protein synthesis rate, however, is prohibitive for using the usual synthesis-and-degradation cycle of cyclins. It is therefore reasonable to assume that the total amount of MPF complexes in the embryo is approximately constant until gastrulation (for later stages see below). As a consequence, the cell cycle oscillator during early embryogenesis of C. elegans may be driven by a temporally varying activation of MPF complexes and/or a change in their subcellular localization [20].
Given that cells in C. elegans embryos are blastomers that arise from volume-conserving cell divisions, constant protein pools lead to conserved protein concentrations in unbiased cell divisions. Yet, the actual intracellular particle copy numbers are reduced when partitioning the available protein pool into the emerging smaller daughter cells. Therefore, vital cellular processes may eventually be affected by a limitation of components (see, for example, [21]).
We have shown earlier that a limiting-component model quantitatively captures the anti-correlation of cell volumes and cell-cycle times in C. elegans embryos up to the onset of gastrulation [10]. To assume a definite form, we had employed nuclear pore complexes (NPCs) as the limiting component at this point. In the next paragraphs, we briefly review the model and stress its generic features by outlining how an alternative molecular interpretation of the limiting component leads to the same result. Based on this, we extend the limiting-component model to later stages of development, i.e. beyond the onset of gastrulation, in which protein synthesis needs to be considered.
Neglecting the elaborate details of the cycle oscillator, one can describe its essential action as a simple integrate-and-fire process (see also figures 3 and 5 in [2]): after having emerged from a preceeding division event, the relevant concentration of active MPFs, a(t), in a cell grows at a constant rate Γ from its low initial value a0, and mitosis is irreversibly triggered upon exceeding a critical threshold ac, i.e.

From this we can infer the typical cell cycle time as  . In spirit of the discussion above, ac and a0 are considered approximately constant for all cells due to particle-number conservation and the blastomeric emergence of cells.
In previous work [10] we had proposed that active MPF complexes need to translocate from the cytoplasm to the nucleus via a limiting number NP of NPCs, i.e.  with γ being the translocation rate for each NPC, while a and c denote the MPF's nuclear and cytoplasmic concentrations, respectively. Since particle number conservation demands that the copy number of NPCs per cell is reduced in each division event (see above), the cell volume V determines the number of proteins, i.e. NP ∼ V. Consequently, cell cycle times were predicted to depend on cell volumes as

Here, the parameter  denotes the period needed for going through the different phases of mitosis. We shall assume that τM is independent of cell volume, and we will provide experimental evidence for this in the next section. The parameter α is an empirical prefactor that integrates a variety of molecular details that do not change the gross behavior, e.g. the initial number of NPCs, the translocation rate γ, and the threshold concentration ac [10]. Fixing parameters τM and α indeed yielded an excellent agreement with experimental data of the development of wild-type and RNAi-treated C. elegans embryos until the onset of gastrulation [10]. Notably, the scaling in equation (2) is even preserved when relaxing the demand of strict particle number conservation, i.e. when allowing for minor net protein synthesis instead of exactly counterbalancing translation and degradation of proteins (see supplemental information in [10]).
The favorable agreement with experimental data indicates that equation (2) as a generic relation correctly describes the early embryogenesis of C. elegans, irrespective of the detailed molecular assumptions. Therefore, one might employ another molecular interpretation for the limiting-component model as well. Instead of a temporal change of MPF localization, a change of MPF activation can also be envisaged: it has been shown in an elegant study that centrosomes are sufficient for determining a timely entry into mitosis [22] due to MPF activation by the centrosome-bound Aurora kinase AIR-1. Since the number of centrosomes is constant for all cells, it appears reasonable to name AIR-1 as prime candidate for the limiting component of MPF activation. In particular, we only consider the number of AIR-1 proteins at centrosomes, not their local spatial arrangement, i.e. minor variations in centrosomal size are neglected.
Interpreting a(t) as the concentration of active MPFs in this case, we can again start off from equation (1). Let NA and ω denote the number of centrosome-bound AIR-1 proteins and their rate of activating MPFs, respectively. Then, the production rate reads  with c being the concentration of not yet activated MPFs. Assuming
  yields an approximately time-independent rate Γ, hence satisfying equation (1) and predicting a cell cycle time
  . Particle number conservation during blastomeric development of the embryo demands the number of AIR-1 proteins within a cell of volume V to scale as NA ∼ V. Thus, including the time τM needed for the mitosis event, we arrive again at the relation given in equation (2), yet with a different molecular interpretation of the parameter α.
Notably, either of the two molecular interpretations leads to the same generic result (equation (2)), and both integrate biochemical processes into the parameters τM and α. Therefore, an additional prediction of the limiting-component model is that both parameters should comply with the classical Arrhenius behavior seen for biochemical rates upon varying the temperature. Moreover, following the molecular interpretation based on AIR-1, germline cells can be predicted to have a larger value of α as compared to somatic cells: cells of the P lineage emerge from geometrically and biochemically asymmetrical division events [8]. The very first cell division, for example, generates a larger somatic and a smaller germline cell (AB and P1, respectively) with an enrichment of components of the cell-cycle oscillator in the AB cell [23–25]. Therefore, germline cells start off with lower values of c as compared to their somatic siblings, leading to an increased value of α for this lineage. These two predictions will also be probed experimentally in the next section.
While the assumption of particle number conservation may be justified for developmental stages before gastrulation (starting at the 26-cell state) [18, 19], transcription and hence production of new proteins needs to be taken into account for later stages. On a qualitative level, a reduced dependence of cell-cycle times and cell volumes should be observed for the ever decreasing cell sizes beyond the onset of gastrulation due to a replenishing of the limiting component via protein synthesis. Therefore, the effective parameter α in equation (2) should decrease for cell volumes smaller than those observed at the onset of gastrulation.
To account for new protein synthesis beyond gastrulation, we consider again the total copy number of the limiting component within a cell and use a first-order approximation to include the addition of new protein copies with rate β, i.e.  . Here, N0 ∼ V denotes the amount of the limiting component in a cell of volume V in the 26-cell state, and
  is the time elapsed after the onset of gastrulation. Therefore, this cell's progeny will have a cumulative amount of the limiting component that grows linear in time. Computation of the time
  for any cell can be facilitated by expressing it iteratively via the k cell cycle times that have been accumulated since starting from the 26-cell state,
  . Integrating this to equation (2), cell cycles should depend on cell volumes as

This relation not only incorporates the already experimentally confirmed result before gastrulation (equation (2)) but it provides now also a substantial and quantitative expectation for the remaining development within the eggshell. The next section is devoted to an experimental test of this model.
4. Experimental results and discussion
In order to probe the quantitative relations derived from the limiting-component model, we performed an extensive set of measurements on C. elegans embryos (see Materials and Methods for details). In particular, we monitored and evaluated cell volumes and cell cycle times for all individual cells along the lineage tree until the 90-cell state. In order to reduce fluctuations that are specific to the individuum, and hence cannot be captured by our generic model, shown data have been averaged over a set of embryos unless stated otherwise.
For probing the validity of equation (3) we have initially restricted our analysis to data averaged over cell generations, hence smoothing slight cell-to-cell variations. A cell generation is defined as a set of cells within one lineage at the same stage of development, e.g. the first generation of the AB lineage contains just one cell whereas the third generation already contains four cells (ABal, ABar, ABpl, ABpr). The germline is the only lineage in which all generations are composed of only a single cell. First, we analyzed cell cycle durations at constant temperature before or during the onset of gastrulation. This includes the whole germline precursor lineage (P1 to P4), the first five AB-, four MS- and three C-generations. Here, EMS was grouped into the MS-lineage. The E-lineage was excluded from the analysis, since it introduces gap phases, in contrast to all other lineages, and hence has a particular behavior [26, 27]. Furthermore, we have refrained from analyzing the D-lineage as there is only one generation present before gastrulation.
As reported before [10], this data is well described by equation (2), i.e. by the initial regime of equation (3), see figure 2(a), underlining that the approach via a limiting component is a good one. In contrast to our earlier work, we have allowed here that the parameter τM assumes slightly different values for somatic cells and germline precursors, which resulted in τM being about 10% larger in the P-lineage. As will become clear below, this difference is a significant and distinct feature of the germline precursors. In addition we allowed the prefactor α to vary between the different lineages since AB-, MS-, and C-lineages emerge successively and hence can be expected to show slightly increasing values for α. As a result, we observed that all somatic cells featured very similar but slightly increasing values of α, i.e.  , whereas the P-lineage demanded a roughly two-fold larger value (see full lines in figure 2(a)). This result agrees with our earlier report [10] and it confirms in particular the prediction of an elevated value of α due to an asymmetric partitioning of cell-cycle components into somatic cells. It is worth noting here that the development of the germline in terms of its cell cycle timing is completely captured with these data since the progeny of P4 (Z1 and Z2) exit the cell cycle until the embryo hatches.

Figure 2. (a) Generation-averaged cell cycle times τ (lineage-specific colored symbols), obtained before the onset of gastrulation, show an excellent agreement with the predicted dependence on cell volumes, V (equation (2), full lines). Data were taken from n = 11 embryos in measurement series No. 1; error bars indicate standard deviations obtained from all cells in this generation in the ensemble of embryos. (b), (c) Parameters α and  (symbols, obtained by fitting data from measurement series No. 4) follow an Arrhenius-like scaling
  (dashed lines; T0(α) = 8031 K,
  K); error bars are 90% confidence intervals. Please see also main text for discussion.
Download figure:
Standard image High-resolution imageNext we wanted to test the expectation that parameters τM and α follow an Arrhenius scaling. Upon varying the ambient temperature, we observed indeed a favorable agreement with the anticipated Arrhenius scaling (figures 2(b), (c)), albeit with different critical temperatures. These data support the notion that the two essential parameters of the model integrate the complex biochemistry associated with cell cycle timing.
We next sought to obtain some experimental support for our ad-hoc assumption that τM, the period needed to go through the different stages of mitosis after reaching the critical MPF concentration, does not depend on cell size. In fact, the time needed for cytokinesis is the same for all cells [28, 29], and also the speed of chromosome condensation during prophase seems to be independent of cell size [30]. The period in between, however, had not been tested yet. To address this aspect, we have used long term acquisitions of embryos at ambient temperatures in the range 15 °C–25 °C (measurement series No. 4, see Materials and Methods). By reading out the period τPA, defined as the period between onset of prophase and the onset of anaphase (see figure 3(a)), we were probing the duration of the so-far unexplored phase of mitosis. For simplicity, we carried out this analysis for the first four generations of AB cells, EMS, MS and the germline precursor cells P1 to P3. Due to the limited resolution in our imaging approach, later cells could not be evaluated with sufficient precision. As can be seen in figure 3(b), the period τPA did not show any significant dependence on cell volumes even though the indicated cells covered more than an order of magnitude in absolute volumes [11]. However, significant differences were seen between germline precursor cells and somatic lineages, confirming that distinguishing τM between these two sets of cells is meaningful. One possible reason for the elevated period τPA in germline cells is a DNA-replication checkpoint that is preferentially activated in these cells but not in somatic ones [31].

Figure 3. (a) Representative fluorescence image series of chromatin in a single embryonic cell (scale bar: 5 μm). The period τPA, an indicator for the duration of mitosis, was quantified from prophase to anaphase (highlighted by asterisk and hash mark, respectively). (b) The mean period τPA of the indicated cell generations (symbols) show no significant dependence on cell volume but vary with temperature. Moreover, germline percursor cells feature significantly elevated values for τPA, in line with slightly larger values of τM in P cells. (c) Mean periods τPA follow an Arrhenius scaling with T0 = 4586 K (somatic) and T0 = 4344 K (germline), in favorable agreement with results on τM (see figure 2(c)). Error bars for each condition denote standard deviations in the ensemble of n = 5 embryos.
Download figure:
Standard image High-resolution imageMoreover, in agreement with the aforementioned temperature-dependence of the model parameter τM (figure 2(c)), the experimentally determined periods τPA also showed an Arrhenius-scaling with a very similar value of the critical temperature (figure 3(c)). Altogether, these data show that assuming the duration of mitosis to be independent of cell volume is well justified, but the period is significantly longer for germline precursor cells as compared to their somatic neighbors.
So far, the analysis of our experimental data had been restricted to stages before gastrulation. In order to probe the predictions of the extended model (equation (3)) we have significantly expanded the image acquisition and evaluation to later stages of embryogenesis (measurement series No. 3, see Materials and Methods), enabling us to quantify cell cycle durations of the initial nine, six, and five generations of the AB-, MS-, and C-lineages, respectively. Please note that this is a full coverage of the AB-lineage as the 10th generation exits the cell cycle until hatching. In order to reduce bleaching and phototoxicity, we have not imaged the plasma membranes in this series, i.e. cell volumes needed to be determined differently. We had shown before that the cumulative volume of cells per generation within a lineage is conserved, and that individual cell volumes are very reproducible between individuals [11]. Since we are currently only focusing on generation-averaged cell volumes, these insights open up a way to estimate volumes with a high precision: the volume VF of any founder cell (AB, MS, or C) has been determined in our previous experiments (see above). Since the number of cells increases two-fold with every new generation, the mean cell volume in generation g is  . For the fifth generation of AB-cells, for example, this predicted value differs from the actually measured value only by negligible 2.5%.
Using these estimates for volumes and having measured the mean cell cycle times for the majority of cells that are being produced during the embryogenesis within the eggshell, we were able to test the validity of equation (3). Keeping the previously determined values for α and τM fixed, and setting the protein synthesis rate for all cells to the same value (β = 1.14/h), an excellent agreement of the model and the experimental data was observed for the somatic founder lineages during all stages of development (figure 4). Notably, cell cycle durations τ were lower than predicted by equation (2), which leads to the hypothesis that preventing protein synthesis in post-gastrulation stages should result in prolonged cell cycle durations. Indeed, deactivating transcription has been observed to have no effect on cell cycle times before gastrulation but lead to longer cell cycle durations beyond gastrulation [18, 19]. Along the way, our findings also suggest a coordinated onset of protein synthesis throughout the whole somatic cell mass with very similar synthesis rates. Certainly, the latter extrapolation will need additional tests in experiments, which will also reveal potential variations between individual somatic cells.

Figure 4. Volume-dependence of the generation-averaged cell cycle times τ of the first nine generations within the AB lineage (a), and the first six and five generations of the MS- and C-lineages, respectively (b). Experimental data (symbols) were obtained from n = 9 embryos (measurement series No. 3); errorbars indicate standard deviations of the ensemble of analyzed embryos. As seen before, pre-gastrulation data (shaded areas) are well captured by the simple form of the model without protein synthesis (dashed lines, unchanged copy of figure 2(a)), i.e. by equation (2) as the initial regime of equation (3). However, strong deviations from this initial regime are observed beyond the onset of gastrulation. The extended model (equation (3)) also captures this later phase of embryogenesis (full lines) with only a single additional model parameter, namely a uniform protein synthesis rate  for all lineages. Please note that all displayed data were obtained by manual evaluation as described in Materials and Methods. The very good agreement of pre-gastrulation data with the unchanged fit lines (dashed; taken from figure 2(a)) confirms that the different evaluation approach did not introduce artifacts.
Download figure:
Standard image High-resolution imageGoing beyond the generation average, we next inspected the cell-to-cell variations within single generations. In fact, the limiting-component model also allows for some predictions concerning cell cycle durations within one generation: first of all, if there are significant geometrical asymmetries in cell divisions within one lineage, i.e. a mother cell produces two biochemically equal daughters of different volumes, this should influence the daughters' cell cycling. According to equation (3), the smaller daughter cell should then have a prolonged interphase as compared to its sibling. As we have shown before, geometrically asymmetric cell divisions occur both in the MS- and in the C-lineage [11], where cells MSa, MSp, Ca and Cp produce daughters that differ in volume up to 60%. Hence, their daughter cells, i.e. the third generation of both lineages, should have significantly distinct cell cycle durations. Our experimental data confirm this very expectation (figures 5(a), (b)). Cell cycle durations for the MS- and the C-lineage on the single cell level, averaged over an ensemble of embryos, show a pronounced in-generation dependence on cell volumes that is well captured by the scaling predicted in equation (3).

Figure 5. Fluctuations of cell-cycle times within the first four generations of the MS-lineage (a), and within the first three generations of the C-lineage (b), shown as color-coded symbols, are due to geometrically asymmetric divisions in generations MS(2) and C(2) [11]. These lead to a significant spread of cell-cycle durations that is well captured by equation (3) (full lines, same parameter values as used before). Data were obtained from n = 11 embryos (measurement series No. 1); error bars indicate standard deviations of the ensemble of embryos. (c) The AB-lineage features mostly symmetric divisions, hence fluctuations in the partitioning of the limiting component can be expected to be the main source of variation for cell-cycle durations (see also main text). Indeed, the experimentally determined coefficient of variation (equation (4)) for the pre-grastrulation generations 3–5 in the AB lineage (symbols) confirm the anticipated scaling  (full line). Beyond gastrulation, i.e. starting from generation 6, a significant increase in Cg is observed that is most likely due to the influence of protein synthesis. Error bars indicate standard deviations of the ensemble of embryos.
Download figure:
Standard image High-resolution image
In the absence of geometrically asymmetric divisions, equation (3) predicts the same mean lifetimes for all cells within one generation. However, fluctuations in the stochastic partitioning of the limiting component will still be able to induce variations of cell cycle durations in this case. If the mother cell has N copies of the limiting component, then either of the equally sized daughter cells should inherit on average N/2 copies. Being a stochastic process, the standard deviation of this partitioning process will scale as  for sufficiently large N, i.e. the relative error of partitioning is
  . Since the limiting component eventually determines the cell cycle time via N ∼ V (see derivation of equation (3)), we can expect relative fluctuations of cell cycle times within one generation to increase for smaller cells. Hence, cell cycle times should scatter stronger in later phases of embryogenesis.
The AB-lineage is a superb system to check this prediction, since it mostly features symmetric divisions [11]. As a measure for the relative cell cycle fluctuations within a generation, we considered the mean coefficient of variation, defined as

Here, τg,i denotes the cell cycle duration of the ith cell in generation g of a chosen lineage ( ), and σ(τg) is the standard deviation of these
  cells;
  and
and  denote averaging over all cells in generation g and over the ensemble of embryos, respectively. Following the above reasoning, we expect
  with Vg the mean cell volume of generation g.
Asking for high-quality tracking data and sufficient in-generation cells, we calculated Cg for generations 3–6 of the AB-lineage, consisting of four to 32 cells. When plotting the respective values of Cg versus the generation mean of cell volumes, a clear trend  is seen for generations 3–5 (figure 5(c)), i.e. prior to gastrulation. Deviations towards higher values of Cg for generation 6 are also expected since these cells already started protein synthesis which adds active, cell-specific fluctuations that enhance the variability.
Taken together, we have shown here that a simple and generic limiting-component model, irrespective of the detailed molecular interpretation, provides a very good quantitative description of the experimentally observed anti-correlation of cell cycle times and cell volumes throughout all phases of the embryogenesis of C. elegans. The model not only captures the mean scaling but also encompasses fluctuations within a cell lineage.
Based on our findings, we conclude that C. elegans, unlike higher animals, does not have to rely on cell–cell communication to orchestrate the proper timing of cell divisions during embryogenesis. In particular, relying on simple physico-chemical measures for deciding autonomously on the start of mitosis appears sufficient to arrive at a well-balanced cell arrangement: Using cell-cycle times that are anti-correlated with cell volumes leads, together with biochemically and geometrically asymmetric divisions, to equally sized cells at the onset of gastrulation. Avoiding grossly varying cell size is beneficial for exploiting mechanical cues for the cell arrangement (see [9, 10] for a detailed discussion), i.e. small cells do not get trapped in blind spots around very large cells, hence providing a good starting point for the active inwards migration of cells during gastrulation. The embryo of this simple organism therefore seems to run on a physics-based autopilot, using simple physico-chemical measures for organizing embryogenesis, whereas higher animals rather seem to rely on elaborate biochemical feedback loops to ensure proper development.
Acknowledgments
Financial support from German Research Foundation Grants WE4335/3-1 and WE4335/3-2, and by the VolkswagenStiftung (Az. 92738) are gratefully acknowledged. Worm strains were provided by the Caenorhabditis Genetics Center, which is funded by the NIH Office of Research Infrastructure Programs (P40 OD010440). MW and SK also acknowledge support by the Elite Network of Bavaria (Study Program Biological Physics).