


Abstract
Despite considerable advances in understanding the molecular nature of cancer, many biophysical aspects of malignant development are still unclear. Here we study physical alterations of the surface of human cervical epithelial cells during stepwise in vitro development of cancer (from normal to immortal (premalignant), to malignant). We use atomic force microscopy to demonstrate that development of cancer is associated with emergence of simple fractal geometry on the cell surface. Contrary to the previously expected correlation between cancer and fractals, we find that fractal geometry occurs only at a limited period of development when immortal cells become cancerous; further cancer progression demonstrates deviation from fractal. Because of the connection between fractal behaviour and chaos (or far from equilibrium behaviour), these results suggest that chaotic behaviour coincides with the cancer transformation of the immortalization stage of cancer development, whereas further cancer progression recovers determinism of processes responsible for cell surface formation.
Export citation and abstract BibTeX RIS

Content from this work may be used under the terms of the Creative Commons Attribution 3.0 licence. Any further distribution of this work must maintain attribution to the author(s) and the title of the work, journal citation and DOI.
1. Introduction
Despite many decades of 'war on cancer' and success in treatment of several cancers, the war is far from being victorious. Finding specific cancer genes was the major direction of the attack for many decades. However, a sharp increase in the complexity and variability of genetic signatures of activated/mutated genes recently observed even in the same cancers at different malignant stages has considerably slowed the advancement in this direction [1]. Thus, stronger than ever, there is a need for new conceptual paradigms about the nature of cancer.
When talking about the nature of cancer, it is plausible to consider two different views: cancer is a deterministic switch (not excluding high heterogeneity typical for cancer [2]) no matter how it is induced, (biochemically, physically, or genetically) or cancer is a chaotic imbalance of biochemical reactions, a sort of side effect of cellular complexity, which was overseen by evolution. In this work we show some evidence that the picture seems to be more complicated. To show it, we study emergence of possible fractal geometry on the cell surface at different stages of progression towards cancer. Fractal [3, 4] is one of the intriguing patterns in nature observed as 'self-similar' irregular curves or shapes that repeat their pattern when zoomed in or out. As was found, fractal patterns are formed under far-from-equilibrium conditions [5], or emerge from chaos [6]. Examples of fractal patterns range from the large-scale structure of the Universe [7] to the geometry of some biological tissues [8].
The idea of a possible connection between cancer and fractals has been suggested in a number of works [9–11]. It was proposed that imbalance of various biochemical reactions, which is typically associated with cancer, could result in chaos, and the subsequent appearance of fractal geometry. It was shown that tumor vasculature and antiangiogenesis demonstrated explicit fractal behavior [10, 12]. Cancer-specific fractal behavior of tumors at the macroscale was recently found when analyzing the tumor perimeters [8, 13]. Similar analysis at the micro- and submicron scales done in both neoplastic and normal cells demonstrated that fractal dimensions can be different for cancer and normal cells [14–18]. In particular, the analysis of fractal dimension of the adhesion maps imaged with atomic force microscopy (AFM) showed a strong segregation between malignant and normal human cervical epithelial cells [18]. However, nobody has systematically studied how accurate the approximation of the cell surface as fractal was in those works (fractal dimension can be assigned to any surface, not necessary true fractals). In other words, the study of the emergence of fractal geometry in itself on the cell surface has not been studied.
Here we investigate the emergence of fractal geometry on the surface of human cervical epithelial cells during their progression towards cancer: from normal, through immortal (premalignant), to cancerous stages. In addition, we carefully recorded the number of population doubling for all cells starting from their extraction from tissue (all cells were primary cells extracted from human normal or tumour tissues; premalignant cells were immortalized normal cells). This is done to monitor progression towards malignancy within each cell group. The cervical cell model was chosen because of the existence of a well-developed model for cell progression towards cancer, and due to a practical need: the improvement in early detection of cancer, which is based on the imaging of individual cells, can substantially decrease morbidity and mortality [19–21].
While cancer development in vivo can be different from the development in vitro, the use of the cell model allows us to control the cell phenotype, which is impractical when doing measurements in vivo. Here we assume that the properties of 'normality', immortality, and malignancy can be well-defined in both in vitro and in vivo (though this assumption may seem to be well adopted these days, it has yet to be proven in the future). To exclude a coincidental result, we use six different cell strains and twelve cell lines.
As a result of this work, we show evidence that the simple fractal geometry on the cell surface (and conceivably, chaos) is reached only at a particular stage when premalignant (immortal) cells are transformed into cancerous. Before and after that, the cells demonstrate a substantial deviation from simple fractal (cannot be treated as fractals). Specifically, we observed a strong correlation between multi-fractality, a parameter we introduced to characterize the deviation from fractal, and the stage of progression to cancer. Multi-fractality is zero (simple or ideal fractal) at the stage of when immortal cells turn into cancerous (between immortal cells of large number of divisions and cancer cells of small number of divisions). The multi-fractality of cancer cells deviates from zero with the increase of the number of divisions of cancer cells. We can speculate that these results vote in favour of the switch to cancer as a chaotic imbalance of biochemical reaction shaping the cell surface. However, further malignant development recovers the balance (though different from the one of normal cells), and votes in favour of deterministic cancer development (at least the part responsible for formation of the cell surface).
2. Methods and materials
2.1. Cell culture
Primary cell cultures of human cervical epithelial cells were prepared directly from human cervical tissues collected from the transformation zone of the cervix. The cell isolation was performed by a two-stage enzymatic digestion using dispase to remove the epithelium and then trypsin to disperse the individual epithelial cells [22]. All tissues were obtained from the Cooperative Human Tissue Network (informed consent was obtained from patients according to their published guidelines [23]). All experiments were performed in accordance with relevant guidelines and regulations. All experimental protocols used in this work were exempted from the regular Institution Review Board (IRB) review by the IRB committee of Clarkson University. Each tissue was digested for 16 h at 4 °C in dispase. Then, the layer of epithelial cells was removed from the underlying connective tissue by gentle scraping. The sheet of epithelial cells was cut into ∼1 mm2 pieces and digested in 0.25% trypsin at 37 °C for 10 min. Trypsin was neutralized by adding 10% fetal bovine serum. The cells were collected by low speed centrifugation. Cultures consisting of ≥95% epithelial cells were maintained in keratinocyte serum-free medium (KSFM, Invitrogen, Carlsbad, CA) which prevents outgrowth of fibroblasts and other stromal cells. Six cancer lines were derived in this way from six cancer patients, and six normal cell stains from six healthy individuals.
Six immortalized (pre-malignant) cell lines were prepared separately in two steps: transfection of normal cervical cells with the complete HPV-16 genome, and subsequent immortalization of the transfected cells. HPV-16 genome was introduced into cultured cervical cells by transfection with plasmid DNA containing the complete HPV-16 genome in combination with the neomycin resistance gene [24]. Subsequently, the medium was changed and cells grew for 24 h before cultures were split 1:3. After 24 h, transfected cells were selected by growth for 2 days in KSFM containing 200 ug ml−1 G418 and used immediately. Only immortalized cells survived after 60-150 population doublings (PDs). Normal cervical cells were used between 20 to 40 PDs, and cancer cell lines were used at 40 to 290 PDs. The slightly higher number of PDs for (pre)cancer cell lines avoids potential confusion because any normal cells, which may contaminate the premalignant and cancer culture dishes, would die out by that number of PDs. Normal HCX-160, 265, 277, 278, 369, 372 strains, precancerous CX-16-2, 16-4, 16-11, 16-12, 16-14, 16-15 and cancerous CXT-2, 3, 5, 6,7, 8 cell lines were analyzed in this work.
2.2. Cell fixation and drying for AFM study
To increase lateral resolution of the AFM images, and to mimic the processing of cells in the screening liquid cytology tests, cells were fixed and dried before the imaging with AFM. To avoid drying artifacts, freeze-drying was used. Specifically, all cells were cultured in 60 mm tissue culture dishes. The cells were analysed when the cells reached <50% confluency. The cells were then washed twice with phosphate buffered solution (PBS), and then treated with 4 ml of Karnovsky's fixative overnight at 4 °C. After that treatment, the cells were washed twice with 4 ml of PBS at an interval of 2 h to remove excess Karnovsky's fixative and kept overnight at 4 °C in water. Finally, the cells were washed with 5 ml of DI water twice before freeze-drying. (The cell samples thus prepared can be preserved for several weeks with DI water at 4 °C before freeze-drying them.) After fixing, water was removed by freeze-drying (using Labconco Lyph-Lock 12 freeze dryer). After freeze-drying, cells were preserved in a dessicator. The cells were imaged under AFM directly in culture dishes after not more than 30 min after removing from the dessicator. The dried samples can be preserved at least for several weeks in a desiccator.
2.3. Atomic force microscopy
Nanoscope™ Dimension 3100 (Bruker/Veeco, Inc., Santa Barbara, CA) atomic force microscope controlled by Nanoscope V controller were used in the present study. AFM cantilever holders for operation in air were employed. To collect the maps of cell adhesion, the HarmoniX mode of AFM operation was utilized. Bruker/Veeco cantilevers for imaging in air were used. HarmoniX standard cantilevers were used.
2.4. Electron microscopy
FEI Phenom SEM was used in this study. For the SEM imaging, the cells in a culture dish were washed twice with PBS, and then treated with 4 ml of Karnovsky's fixative overnight at 4 °C. After that treatment, the cells were washed twice with 4 ml of PBS at an interval of 2 h to remove excess Karnovsky's fixative and kept overnight at 4 °C in water. Finally, the cells were washed with 5 ml of DI water twice before freeze-drying. Freeze-drying was in a Labconco Lyph-Lock 12 freeze dryer. Osmium salt and/or gold coating were used to enhance contrast.
2.5. Fractal analysis
Fractal analysis of AFM images/maps was done with the help of the Fourier analysis. This procedure is equivalent to the standard self-correlation function analysis [25]. Specifically, 2D Fourier magnitude  of the AFM images can be found as follows:

where z(x,y) is the value of the image at point/pixel (x,y), Nx, Ny are the number of pixels in the x, y directions. The magnitude was then written in polar coordinates and averaged over the polar angles:

A is a function of reciprocal space Q (inverse lateral size of the geometrical features on the AFM image, L). Linear behavior of A(Q) in the log-log scale (or  is a defining feature of fractals. An important parameter of fractals is the fractal dimensionality α, which can be defined as α = 2 − b. Such a definition of the fractal dimension gives α = 2 for flat and α = 3 for infinitely rough surfaces. To calculate the Fourier spectra of the AFM images, Scanning Probe Image Processor (SPIP) software (Image Metrology A/S, Denmark) was utilized. The fractal dimensionality was found by fitting the obtained spectra with
  function by using Origin 9.0 software (OriginLabs, Inc.).
It should be noted that, strictly speaking, it is impossible to obtain the exact fractal behavior from the maps observed for any realistic surface. According to the classical definition of fractal, the power dependence of the magnitude which defines the fractal should be observed in the entire geometrical (infinite) scale of Q. However, this is impractical because of natural limitations [26] due to the finite size of data and finite digitalization/ pixelization of any image. It implies that the fractal geometry cannot be even considered for the size of geometrical features L (=Q−1) that are either greater than the size of the recorded image or smaller than the size of each pixel. For example, if the analyzed AFM images of 5 × 5 μm2 are recorded with 256 × 256 pixels, the fractal behavior can be analyzed for L ranging between ∼5 μm and 20 nm (∼5 μm/256). So, for fractal behavior discussed in this work, we define it within these limits. One can argue that this might be insufficient to declare fractal behavior. To make our statement rigorous, we just say that we analyzed the fractal behavior (scaling self-affinity) within a limited geometrical scale.
3. Results
3.1. Imaging the cell surface
We study the fractal geometry of images/maps obtained by means of atomic force microscopy (AFM). Following methods described in [18], we use the maps of physical adhesion between the AFM probe and cell surface to study the fractal geometry. As was demonstrated in [18], the maps of adhesion gave the highest spatial resolution over the cell surface. Secondly, fractal properties of the maps of adhesion are very robust with respect to the variation in the AFM scanning parameters, see below. Finally, the analysis of the AFM height images did not show any statistically significant segregation between normal and cancer cells.
For comparison, figure 1 demonstrates both AFM adhesion and the scanning electron microscopy (SEM) images of cells. SEM is a more traditional method of studying the cell surface compared to AFM. Therefore, it is instructional to compare SEM and AFM techniques to understand the uniqueness and advantages of AFM. AFM demonstrates a higher 3D resolution compared to SEM. Secondly, as we demonstrate later (figure 6), the maps of adhesion allow detection of the local surface curvature of the order of the molecular scale, ∼1 nm. This is impractical to attain with SEM of the cell surface due to low electron contrast. Therefore, hereafter we utilize AFM working in the adhesion mode to analyze the change of the cell surface during progression towards cancer. It is worth mentioning here that the analysis of the AFM height images did not show any statistically significant change in the fractal behavior because of presumably poor resolution, see figure 6 for detail.
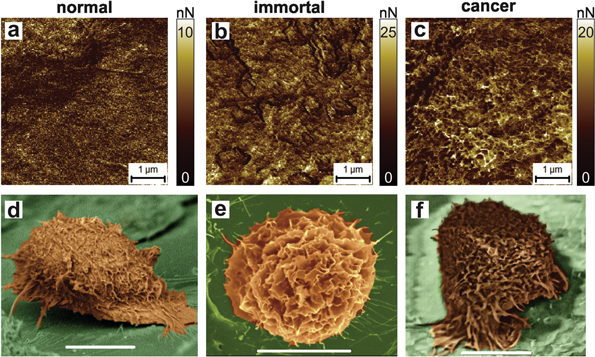
Figure 1. AFM maps of adhesion of the AFM probe to the cell surface of (a) normal, (b) immortal (premalignant), and (c) cancer cells. SEM images of (d) normal, (e) immortal, and (f) cancer cells.
Download figure:
Standard image High-resolution image3.2. Concept of multi-fractality
Analysing the adhesion maps of individual cells (as described in the Method section), we find that some pre-malignant and cancerous cells demonstrate simple fractal behaviour. The rest of the cells can only be approximated at best as multi-fractal [26, 27]. This is explained in figure 2 in which the magnitude of the adhesion map is plotted versus the reciprocal space. A straight line in the log-log scale of figure 2 is a definitive characteristic of fractal. However, one can see from figure 2 that the magnitude can be approximated as a straight line in the log-log scale on the whole range of scales Q (reciprocal of the range L = 5 μm–20 nm) for only some immortal and malignant cells. For other pre-malignant, most of the malignant, and all normal cells, the magnitude A(Q) plotted in log-log scale can be well-approximated as a broken straight line with the break point at Q ∼ 5 μm−1 (L ∼ 200 nm). Such an object, multifractal is described with two fractal dimensions.
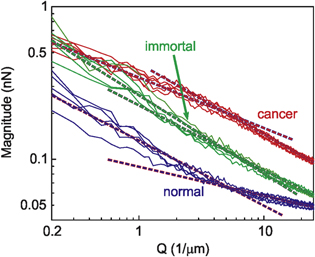
Figure 2. Representative magnitude dependences A(Q) for normal, pre-malignant, and malignant cells.
Download figure:
Standard image High-resolution imageHere we introduce a parameter, which we suggest calling 'multi-fractality', which describes the deviation of the observed geometry from a simple fractal. It is equal to the difference between two fractal dimensions below and above a break point. Figure 2 demonstrates that the break point for the presented data can be taken at L ∼ 200 nm (Q ∼ 5 μm−1). In other words, the multi-fractality is defined as the change of the fractal dimension when defined above and below Q = 5 μm−1. The multi-fractality is zero for the ideal (simple) fractal.
It should be noted that the value of magnitude A for the larger geometrical scale is rather noisy. This noise comes from a relatively small number of points available in the AFM maps to calculate A(Q) at those scales. Comparatively, the scales below 200 nm (or Q > 5 μm−1) give relatively low noise to the magnitude A. The fractal dimension of the large scale does not carry any signal statistically discriminating normal, pre-malignant, and malignant cells. Therefore, to exclude this noise, we will use the average fractal dimension for the larger geometrical scale when calculating multi-fractality.
3.3. Stability of multi-fractality parameter for different scanning conditions
3.3.1. Different scanning/peak force
The same parts of cancer cell were scanned with different scanning (peak) force. Figure S1 shows the multi-fractality, which was calculated from maps collected using peak forces of 20–105 nN. (Note that the starting peak force of 20 nN is the force when HarmoniX force curve can be resolved.) One can see in figure 3 that the multi-fractality is practically independent of the scanning force. The standard deviation of calculated multi-fractality is just 0.01. It should be noted that there may be scanning artifacts when approaching the saturation (maximum) scanning force. Such artifacts could appear due to nonlinearity of the AFM probe motion or inelastic interaction with the cell surface. Therefore, all measurements reported in this work were done in the linear regime with forces 30–70 nN (marked by the dashed lines in figure 3). This broad range can easily be located by any AFM user.
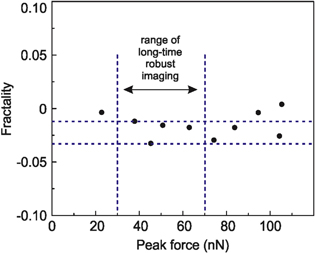
Figure 3. The multi-fractality of adhesion maps of a cancer cell calculated on the same surface imaged with different peak forces.
Download figure:
Standard image High-resolution image3.3.2. Simulation of dependence on AFM probe radius
To check the influence of the AFM probe radius on the multi-fractality of the adhesion maps, we model the adhesion for different probe radii. The adhesion force can be estimated as:

where Rt is the probe radius, Rf is the radius of curvature of the surface at the contact point, W(d) is the adhesion energy per unit area between a flat contact of two materials of the probe and surface.
Equation (3) is derived based on the assumption that the adhesion force is simply defined by the surface geometry if we exclude the viscoelastic response of the surface. The amount of viscoelastic response indeed seems to be negligible. This conclusion can be made because the viscoelastic response depends on the load force, whereas we do not observe such dependence (see, figure 3). Next, we assume that the chemical interaction of the cell surface and probe does not depend on the location on the surface. This is justified by the fact that W(d) is defined by mostly the van der Walls force (we do not observe specific protein-probe interactions which are revealed in a specific stretching behavior of the retraction AFM force curves [28]) and the capillary force. Van der Waals force remains virtually the same over the cell surface. While adsorbed water definitely plays an important role in the observed adhesion, the multi-fractality did not change noticeably when imaging was done in summer time (relative humidity ∼60%) and winter time (∼30%). This assumption gives a possibility to estimate the change of the multi-fractality for different probe radii.
W(d) was estimated on a flat cell area (when Rf tends to infinity) as ∼1.8 N m−1. With the known W(d) and Rt (10 nm), the distribution of Rf was calculated for a chosen reference image, which had the multi-fractality of −0.13. Based on the observed distribution Rf and known W(d), one can now calculate the adhesion map for different AFM probe radii Rt. All modeled images were processed though SPIP software, and the multi-fractality was plotted as a function of a tip radius multiplier coefficient Rt/10 nm, figure 4. The multi-fractality of the initial image is marked with a grey horizontal line. One can see that multi-fractality of the modeled images is virtually constant for a wide range of the probe radii.
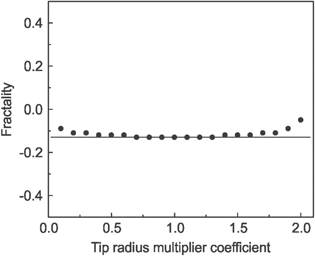
Figure 4. Dependence of the multi-fractality on the coefficient Rt/10 nm, where Rt is the AFM probe radius.
Download figure:
Standard image High-resolution image3.3.3. On possible contamination of AFM probe
To check the dependence of the multi-fractality on possible contamination with AFM probe, we will simulate the change of adhesion by using equation (3). The contamination can result in a change of the radius of the probe, and/or nature of the probe-surface interaction. The change of the probe radius was already analyzed above. The change of nature of the probe-surface interaction can be described by the change in the adhesion energy, W(d), which is a multiplication factor in equation (3). It is known [4] that multiplying each point of a fractal by the same number does not change the fractal dimensionality and therefore multi-fractality. Thus, the only danger to update incorrect multi-fractality of an image is the situation when the contamination of the probe happens during the collecting of that specific image. Images collected before that or after should be virtually independent of such contamination (unless contamination increases the probe size geometrically by more than a factor of two, see figure 4. Such an increase, however, can easily be detected by the blurring of the image.).
3.3.4. Stability of multi-fractality with respect to image digital resolution.
Here we check how the multi-fractality of the adhesion maps is stable with respect to the imaging taking with different digital (pixel) resolution. We measured the same cell with different resolution (which can be changed through the AFM software). The reason for imaging with a resolution lesser than maximum is the imaging time. It takes almost twenty minutes to record the image with the resolution described in this work. Imaging with the maximum resolution may take almost 10 times longer, which makes it less interesting from a practical point of view. Thus, testing the stability of the multi-fractality, we can also find the minimal resolution that allows reliable separation of normal and cancer cells.
The adhesion maps of the same place on a cancer cell were recorded with resolution of 3.9, 7.8 and 19 nm/pixel (this resolution was used to obtain the reported results). For the two former maps, the image size was 2 μm, whereas it was 10 μm for the 19 nm/pixel map. To find the multi-fractality, the images were processed through SPIP software using the described procedure. Figure 5 shows the spectral magnitudes of the Fourier spectra in log-log scale as a function of reciprocal space Q for all three resolutions. One can see that within the Q range of 5–25 1/μm (marked by vertical lines), which were used for the calculation, the curve slopes are virtually the same. The maximum reciprocal length Q at which cancer and normal cells can be distinguished (Fourier spectra slopes are different) is about 15 1/μm, which corresponds to a resolution of about 33 nm/pixel. Scanning with such resolution will be faster than the scanning used in this work. While it may be useful for the future clinical trials, the resolution used in this work was higher for the sake of broader research interest.
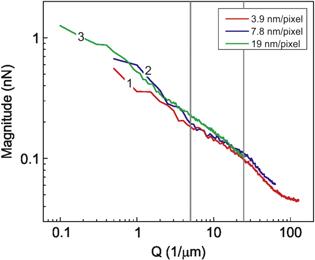
Figure 5. Magnitudes of the Fourier spectra as a function of reciprocal space for images with three different resolutions are shown. Curve (1) –3.9 nm/pixel, (2) –7.8 nm/pixel and (3) –19 nm/pixel.
Download figure:
Standard image High-resolution image3.3.5. Size of geometrical features contributing to the maps of adhesion
Here we demonstrate that difference in multi-fractality can be seen in the maps of adhesion (but not in the height images) because the adhesion maps are effectively probing local geometry, the curvature of the cell surface at each pixel. The most abundant curvature is of the order of 1 nm, see the insert of figure 6(b). The radii are obtained by processing the adhesion maps through equation (3). One can derive the radius of curvature of the surface features at each point of the image,

For comparison, the same figure shows the histogram of the radii derived from the height information recorded in parallel, figure 6(a). One can see that it is impossible to record the radii information in the height mode that would be comparable to the radii derived from the adhesion maps. The most abundant (mean) radius resolved in the adhesion map is 1 nm versus 200–300 nm in the height mode.
3.4. Results for multi-fractality of human cervical epithelial cells at different stages of progression towards cancer
To test the statistical behaviour of multi-fractality, we analysed a representative number of cells from several human subjects. Figure 7(a) shows histograms of distribution of multi-fractality calculated for 540 cervical epithelial cells collected from 6 healthy individuals (normal cells), immortalized cells (derived from normal cells of 6 healthy individuals), and 6 cancer patients (cancer cells). One can see a strong correlation between multi-fractality and the cancer progression stage. Positive multi-fractality of normal cells decreases through the stage of immortalization, and changes to negative for cancer cells. One can see that no normal cells reached the level zero of 'ideal fractal' whereas immortalized and cancer cells do. At the same time, one can see that the majority of the cancer cells deviate from the ideal fractal behaviour, and the deviation is opposite to that of the normal cells. Figure 7(b) demonstrates a box-graph of multi-fractality for the normal, immortal, and cancer cells presented in figure 7(a). One can see a clear statistically significant trend (p < 0.0001), the decrease of multi-fractality with the development towards cancer.
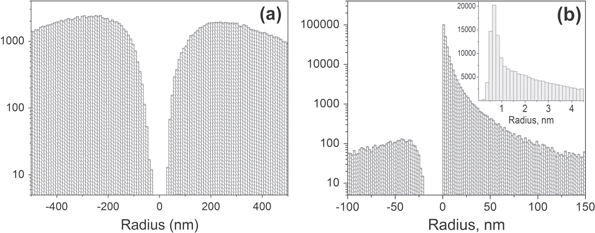
Figure 6. Representative distributions of radii of curvature of features of the cell surface derived from (a) height, and (b) maps of adhesion channel. The height and adhesion images are recorded over the same area simultaneously.
Download figure:
Standard image High-resolution image
Figure 7. (a) Histograms of distribution of multi-fractality calculated for 540 cervical epithelial cells collected from 6 cancer patients (cancer cells), 6 healthy individuals (normal cells), and immortalized cells (derived from normal cells of 6 healthy individuals). (b) box-graph of multi-fractality. The median is shown as a bar in the box middle. The mean value is shown with the dot inside the box. The box size is 75/25% percentile. The 'error' bars are 5–95% percentiles.
Download figure:
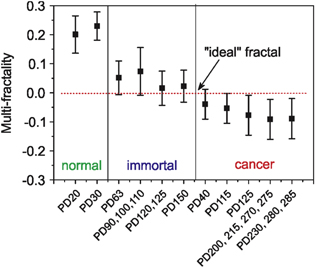
Standard image High-resolution imageIt is known that the risk of cancer typically increases with age. Similarly, malignant phenotype of immortal (precancerous) cells increases with the number of cell divisions (the number of passages in vitro) [29]. Cancerous cells become more aggressive with cancer progression. Therefore, we analyze the change of multi-fractality for a different number of passages (more precisely, population doublings) of cells. Figure 8 shows the dependence of multi-fractality on the number of population doublings (PD) of cells starting from their extraction from tissues. Average values and one-standard deviations are shown. Some cells with close PDs are grouped to make the advance in PD and the total number of cells in each point more uniform. Zero line corresponding to an ideal fractal is also shown. One can see that the multi-fractality crosses zero mostly for immortal cells with high PD and cancer cells with low PD.
Figure 8. Dependence of multi-fractality on the number of population doublings (PD) of cells starting from their extraction from tissues. Average and one standard deviation values are shown.
Download figure:
Standard image High-resolution image
4. Discussion
Here we analyse the changes of fractal (self-affinity) behaviour of the cell surface when cells change from normal to immortal (premalignant), and further to malignant stages. We introduce a new parameter multi-fractality, the difference between fractal dimensionalities in multi-fractal (multi-fractality is zero for a simple fractal). A novel AFM modality, HarmoniX, was used to image the cell surface.
To exclude coincidental correlation between multi-fractality and cell progression towards cancer, we carried out an accurate investigation of possible errors in measurement of the multi-fractality of the cell surface imaged with AFM. We studied possible variations of the multi-fractality when changing the conditions of AFM imaging. The results are summarized below.
4.1. Dependence on the force of scanning (peak force)
Here we studied the dependence of multi-fractality as the function of the peak force. The scan force is to be chosen by the AFM operator. Therefore, independence of our results of this parameter is important to check. We do see such impendence in a broad range of scan forces. It was checked as follows. For example, while working in HarmoniX and using standard HarmoniX AFM cantilevers, one can get reliable imaging starting from the peak force of ∼20 nN and until the force reaches ∼105 nN. A range of 30–70 nN is the force needed for a robust imaging for the time needed to get several scans of the cell surface. We observed variation of multi-fractality within the range of 0.02 when changing the peak force within the range of long-time robust imaging (30–70 nN). A typical dependence of multi-fractality on the peak force is shown in figure 3. One can see that the variation of multi-fractality is negligible compared to the standard deviation shown in figure 8.
4.2. Probe radius
Variation of the radius of curvature of commercially available AFM probes is typically within 5–20 nm. If we assume no specific chemical interactions between the AFM probe and the cell surface (it can be seen/verified by the lack of specific force signatures [28], which was not observed here), the adhesion force could be simulated as a contact of two spherical surfaces [30], as described by equation (4). Using this approximation, we can recover the distribution of effective radii at each pixel of the cell surface. Changing the radius of the AFM probe, one can now recover a new map of adhesion collected with the new probe. Performing fractal analysis of those new surfaces, we found that the multi-fractality changes within 1% when an initial probe diameter of 10 nm changes within the range of 4–18 nm. Thus, we expect no substantial variation of the multi-fractality for a variety of commercial AFM probes. It should be noted that the probe radius can be verified by inverse imaging of a calibrated grid, or tip-check samples [31].
4.3. Possible probe contaminations
As one can judge from the weak dependence of the probe radius, small contaminations on the AFM probe that do not change the probe radius substantially are not dangerous for robust measurements of multi-fractality. In the present measurements, no statistically detectable change of multi-fractality was observed when imaging at least 30 cells. (The probes used can still be cleaned with water plasma cleaners and reused.) All large contaminations are easily detectable by a sudden change of the image. The imaging protocol used here allows avoiding such artifacts. Specifically, we image larger than needed areas of 10 × 10 um2, and analyze the areas of smaller size that do not have clear artifacts (see the Method section for more detail).
4.4. The speed of scanning
This is easily controlled through the AFM software. We observed no dependence of multi-fractality on the speed of scanning until visible deterioration of the recorded image.
4.5. Digital resolution
This one is also software controlled. It could be advantageous to find the minimum pixel resolution suitable for robust recovery of the fractal dimension because this would correspond to the faster scanning, image recording. For example, we estimated that for reliable calculation of the multi-fractality value on the cell surface, we need a resolution of at least 20 nm/pixel.
4.6. The role of humidity (capillary forces)
Although humidity can be controlled during the AFM scanning, the role of humidity can be evaluated. As was shown and tested in [18], the fractal dimension of cells, and consequently, multi-fractality, is rather stable up to the relative humidity of 60–70%. The imaging here was done below that level.
Figure 7 shows the statistical behaviour of the multi-fractality for the cells of study. One can see from figure 7(b) that positive multi-fractality of normal cells drops through the stage of immortalization, and changes to negative for cancer cells. One can see from figure 7(a) that no normal cells crossed zero multi-fractality. At the same time, many of the immortal and some of the cancerous cells have multi-fractality within the vicinity of zero. It should be noted that cells, which we call cancerous, were extracted directly from cervical tumours. Tumours can contain multiple cell phenotypes. By preparation, we excluded somatic and normal epithelial cells. However, it is plausible to expect that a population of precancerous cells is still there. It might be plausible to speculate that there is a double peak in the cancer histogram of figure 7(a) that might correspond to malignant and precancerous cell populations.
Figure 7(b) shows the averaged trend of the change of multi-fractality during progression towards cancer. Just by simple interpolation (drawing a straight line) between the mean values of multi-fractality, one can see that the ideal fractal (zero multi-fractality) is reached between the stages of immortalization and malignancy. To test this hypothesis in a more quantitative way, we analyzed multi-fractality not only as a function of phenotype but also its dependence on the population doubling (PD) of cells studied from the moment of their extraction from tissue. It was possible because we prepared the cell lines and strains.
A careful analysis of various AFM scanning parameters was done. One can see from the results that the errors in definition of multi-fractality due to various scanning variations are within single percents. This excludes coincidental correlation between the multi-fractality and cancer development reported here.
Figure 8 demonstrates the cell multi-fractality (the same as presented in figure 7) ordered by the different PDs. One can see from figure 8 that zero multi-fractality is indeed reached at the point when immortal cells turn into cancerous, specifically at the transition between immortal cells of high PD and cancerous cells with low PD. Since risk of cancer development typically increases with age, the number of PD (cell age in vitro) correlates with the cancer progression in precancerous (immortal) cells [29]. The dysplastic phenotype was shown to increase with the number of passages [32]. Cancerous cells become more aggressive with cancer progression. Therefore, this result supports the conclusion that zero multi-fractality is reached at the moment precancerous cells (immortal cells with high PD) just turn into cancerous (of low PDs). However, the deviation from simple fractal increases with the increase of PD.
Before interpreting the above results, it is useful to analyze bio-physical and -chemical reasons of the observed changes in multi-fractality. As was suggested in the literature [10, 12], generally speaking, imbalance of various biochemical reactions, which is typically associated with cancer, could result in chaos and the appearance of fractal geometry of cancer. However, a specific path is yet to be found. Since the AFM measures the physical interaction between the cell surface and AFM probe, one has to expect physical changes of the surfaces of cells during progression towards cancer. Such surface difference was reported when measuring forces and adhesion on viable epithelial cervical cells [33–36]. It was shown that the difference could be attributed to the variations in pericellular coating, or cellular brush. The cellular brush, which is measured by AFM, consists of microvilli, membrane 'wrinkles' (microridges), glycocalyx, etc. To amplify, we are speaking not about chemical changes in the brush but rather geometrical alteration of the cell surface.
Because AFM measures the physical adhesion of the AFM probe to the cell surface, the difference reported here should come from the difference in the organization of the pericellular brush at the nanometer level. This should then come from the difference in intrinsic membrane roughness (cortical layer of cytoskeleton), microvilli, and/or glycocalyx brush on the cell surface. The reported results allow estimation that the difference should be seen at the scales less than 200 nm (and most probably down to 1 nm, see figure 6 showing the main contribution to the adhesion maps coming from the local curvatures of the order of 1 nm). It will be a task for the future to find the specific pathway influencing the changes in the pericellular brush at that scale.
As we mentioned in the introduction, it was found that the fractal patterns are typically formed under far-from-equilibrium conditions, or emerge from chaos. Thus, the results reported here could be interpreted in favour of chaotic or far-from-equilibrium imbalance during transformation of precancerous cells towards cancer. However, the results vote against cancer itself as a chaotic or far-from-equilibrium imbalance in cells, because the multi-fractality substantially deviates from zero with cancer progression (increasing with the increase of the population doublings of malignant cells). This result will be useful for the development of models describing cancer development and progression. It may also bring a new means of attack on cancer, for example, by searching the points of instability [5] that influence chaotic development the most. Biologists could start identifying those instabilities in the pathways connected to formation of the pericellular coating. Besides the fundamental interest, the obtained results could be used to measure the degree of possible progression towards cancer.
Acknowledgments
We gratefully acknowledge partial funding for this work by Tufts Collaborates! Grant an NSF CMMI-1435655 (IS), and the National Cancer Institute 1R15CA173703-01 (CW). Veeco Award 'HarmoniX Innovation' and the Faculty Research Award (Tufts University) are gratefully acknowledged by IS.
Disclosure of potential conflicts of interest
The authors declare no potential conflicts of interest.
Author Contributions
IS conceived and designed the experiments and did data analysis; MED and NVG performed AFM measurements and did the data analysis; IS and NVG performed EM measurements; NVG and CDW prepared cells for analysis; IS wrote the paper.