


Abstract
A diffraction mechanism is proposed for the capture, multiple bouncing and final escape of a fast ion (keV) impinging on the surface of a polarizable material at grazing incidence. Capture and escape are effected by elastic quantum diffraction consisting of the exchange of a parallel surface wave vector G = 2π/a between the ion parallel momentum and the surface periodic potential of period a. Diffraction-assisted capture becomes possible for glancing angles Φ smaller than a critical value given by Φc2 ≈ 2λ/a–|Vim|/E, where E is the kinetic energy of the ion, λ = h/Mv its de Broglie wavelength and Vim its average electronic image potential at the distance from the surface where diffraction takes place. For Φ < Φc, the ion can fall into a selected capture state in the quasi-continuous spectrum of its image potential and execute one or several ricochets before being released by the time reversed diffraction process. The capture, ricochet and escape are accompanied by a large, periodic energy loss of several tens of eV in the forward motion caused by the coherent emission of a giant number of quanta ħω of Fuchs–Kliewer surface phonons characteristic of the polar material. An analytical calculation of the energy loss spectrum, based on the proposed diffraction process and using a model ion–phonon coupling developed earlier (Lucas et al 2013 J. Phys.: Condens. Matter 25 355009), is presented, which fully explains the experimental spectrum of Villette et al (2000 Phys. Rev. Lett. 85 3137) for Ne+ ions ricocheting on a LiF(001) surface.
Export citation and abstract BibTeX RIS

Content from this work may be used under the terms of the Creative Commons Attribution 3.0 licence. Any further distribution of this work must maintain attribution to the author(s) and the title of the work, journal citation and DOI.
1. Introduction
The stopping power of condensed matter for energetic charged particles has exercised the greatest minds, Rutherford, Bohr, Bethe, Fermi and many others, in the first half of the 20th Century. Later on and up until now, due to the rise of nuclear and material physics, the subject has remained of intense interest in many pure and applied sciences, such as elemental analysis, radiation damage, ion implantation, radiation dosimetry, health physics, lepton and hadron therapy, etc [1, 2].
Of particular interest for understanding the fundamental interaction of energetic ions with condensed matter was the discovery of the 'channeling' phenomenon [3], the deep penetration of fast ions travelling through the solid at glancing angles between two adjacent atomic planes. Channeling has greatly helped in sorting out the various bulk stopping mechanisms, nuclear, phononic, electronic, radiative, etc. More recently, such understanding could further benefit from the gentler method of 'surface channeling' [4], i.e. specular reflection of ions or neutral atoms from flat surfaces at grazing incidences. By measuring the energy loss, the angular distributions, the charged and neutral fractions, etc of the particles reflected from the surface, a great deal could be learned on the type, strength, and range of ion–solid interactions. A general description of the experimental method is given by Winter et al [4], to whom we refer for a review of the recent literature for both ions and neutral atoms.
When approaching the surface of a target from the vacuum side at a glancing angle, energetic charged particles, while immune to bulk stopping mechanisms, still have to travel within range of the electric field associated with the surface waves of target polarization. The excitation of the latter causes energy loss to the former, a phenomenon which could be called 'surface stopping power'. For ion velocity not small compared to the Bohr velocity e2/ħ, all materials show an electronic surface stopping power due to the excitation of high frequency (ultraviolet) collective polarization waves such as surface plasmons of metals or surface collective excitons of insulators. For ion velocity small compared to e2/ħ, the electronic surface waves respond adiabatically and cause no energy loss to charged particles. Yet a polar material such as LiF still shows, at glancing incidence, a large phononic surface stopping power [5] due to the excitation by the ions of very many quanta of optical surface vibrations, as demonstrated by Villette et al [6].
In the course of surface channeling studies with energetic charged particles, the phenomenon of skipping or ricochet motion was discovered in several surface channeling systems [7–10]. The phenomenon is usually manifested by the occurrence of a discrete periodicity in the ion energy loss spectrum. Ricocheting requires the ion to become temporarily trapped into a bound surface state before being released, the discreteness of the loss spectrum reflecting an integer number of ricochets along the surface. A review is provided by the recent work of Villette et al [2], who have studied the ricocheting of keV Ne+ ions on a LiF(001) surface. For this system, where the target is a wide gap ionic insulator and the 'energetic' ions are of relatively slow velocity, the large energy loss is indeed due to the phononic mechanism [2].
In the present paper, we propose a novel interpretation of the skipping spectra observed by Villette et al [2], which includes several physical effects that have been overlooked in previous works [2, 7–10]. We shall first introduce (section 2) the major features of the spectra measured for the Ne+/LiF(001) system [2]. Then we shall introduce and develop (section 3) a non-thermal mechanism of capture and release based on quantum diffraction of the ion by the atomic corrugation of the surface potential. It will be shown that, in spite of the tiny de Broglie wavelength of the energetic ion, its diffraction, when taking place at grazing incidence, can lead to'quantum ricochets', i.e. selective adsorption into, and desorption out of, a bound state of the ion in its electronic image potential in the polar substrate. In sections 4–6 we shall work out an analytical theory of energy loss adapted to the proposed capture–release diffraction mechanism and using an interaction Hamiltonian [1] coupling the ion specifically to the so-called Fuchs–Kliewer (FK) optical surface phonons of LiF. Finally in section 7 we shall present the results of our theory and make a detailed comparison with the observed spectra.
2. Description of the process
We shall consider scattering of energetic ions impinging on a polar surface at grazing incidence.The particular experimental data under consideration here are those of Villette et al reproduced in figure 1 [2], relative to a 1 keV Ne+ beam incident on LiF(001), parallel to a 〈100〉 row, at 0.95° grazing angle. The ions are reflected either as Ne+ or as neutral atoms Ne0, and lose energy via interaction with surface optical phonons. The energy loss spectrum of Ne+ consists of a broad parent peak at an average loss of I0 = 29 eV, followed by a set of three or four weaker, echo-like, still broader peaks In equally spaced by ΔI = 48 ± 1 eV of additional energy loss. The neutral Ne0 spectrum is similar to that of Ne+ but is about three times weaker in intensity, and is shifted unevenly downwards in energy loss by about 11.5–15 eV.

Figure 1. Energy loss spectrum of Ne+ and Ne0 for 1 keV Ne+ incident on the (001) LiF surface at 0.95° grazing angle. The Ne+ peaks labeled I0–I3 are regularly separated by ΔI = 48 ± 1 eV, starting from the parent peak I0 at 29 eV. The shift In – Jn between the Ne+ and Ne0 spectra is not uniform: the constant separation of 15 eV between the echo peaks is noticeably larger than the separation of 11.5 eV between the parent peaks. Adapted with permission from Villette et al 2000 Phys. Rev. Lett. 85 3137, courtesy of H Khemliche. Copyright 2000 by the American Physical Society.
Download figure:
Standard image High-resolution imageThe dominant, so-called parent peaks I0 and J0 in figure 1 are similar to those reported earlier by Borisov et al [11], which have been interpreted in [1] and [11]. The new data of figure 1, showing periodic echoes in addition to the parent peaks, suggest [2] that some of the ions are captured into a surface bound state and ricochet one or several times before escaping. figure 2 sketches a possible trajectory for the formation of the third Ne+ echo peaks I3 at 171 eV energy loss. The Ne0 echoes Jn in figure 1 represent ions neutralized and released at the last ion impact on the surface.

Figure 2. Model ion trajectory for capture, triple bounce in the capture state followed by release in the specular direction. The bounce length LB is approximately constant ignoring the slight ion deceleration along its path due to multiple FK phonon emission.
Download figure:
Standard image High-resolution imageWhile travelling outside of, and nearly parallel to, the surface plane, the ions interact inelastically almost exclusively with the FK surface phonons [1] which are macroscopic optical lattice vibrations whose electric field can reach far outside the target. Large energy losses of several tens of eV imply that hundreds or even thousands of phonon quanta are emitted by the particles while travelling near the surface plane. The process of such copious emission of FK phonons will be studied in the present paper using the ion–FK interaction Hamiltonian developed in [1]. Here however, we wish first to reconsider the mechanism of ion capture–release involving a surface bound state. Although the concept of skipping motion was introduced a long time ago [7] and studied in several works [2, 8–10], the process does not seem to have been completely elucidated. Our immediate aim will be to suggest a novel elastic diffraction mechanism, which has not been envisaged so far in the present context of ion surface channeling.
3. Diffraction assisted capture and escape.
Villette et al [2] have proposed that ion capture into a bound state takes place via scattering by thermally excited phonons, short range collisions on defects such as terrace edges, etc, causing 'angular straggling', i.e. broadening of the angular distribution of the ion beam upon hitting the surface. Such straggling can deflect a fraction of the Ne+ beam in a direction of reduced glancing angle on the surface from which the ions cannot escape their own attractive image potential. In this interpretation, the process of Ne+ final escape from the bound state would similarly originate from scattering off surface defects and surface ripples created by thermally excited acoustic waves. Computer simulations of ion trajectories on such a disordered surface and attendant energy losses are purported [2] to explain the observed data of figure 1, although not without the help of an ad hoc factor in the energy loss scale. It might be possible to confirm or rule out such thermally assisted capture–release by experimentally testing whether ricocheting persists when lowering the temperature. Unfortunately, this test could not be performed as the surface had to be maintained at an elevated temperature to avoid surface charging by the incident Ne+ beam [2] 6 .
3.1. Grazing incidence diffraction
Here we propose a novel mechanism for both capture and escape based on quantum mechanical diffraction of the ion, involving no thermal effects, and capable of taking place on a perfect, atomically smooth surface. Of course, diffraction is omnipresent in slow atom scattering, e.g. in HAS (helium atom scattering), as well as in electron scattering at all energies, such as LEED (low energy electron diffraction), RHEED (reflection high energy electron diffraction), or TEM (transmission electron microscopy), but diffraction appears to have been overlooked in the context of surface channeling of energetic ions, although the concept has been developed in recent works for fast neutral atoms [13]. Perhaps, as pointed out by Rousseau et al [12], the minuscule de Broglie wavelength (≪⃒1 pm) of a keV ion or atom has hindered the realization that at grazing incidence diffraction can lead to selective adsorption of even a heavy, energetic particle such as Ne+.
We shall shortly present the proper kinematic argument, but it might be useful to start with figure 3, which explains the elementary mechanism of Bragg reflection of a plane wave by an atomic array of period d, at oblique incidence Φ.

Figure 3. Oblique incidence wave diffraction on a 1D lattice of period d. The thick black segments indicate the difference in path lengths between two adjacent incident and reflected rays.
Download figure:
Standard image High-resolution imageDiffraction at emerging angle Ψ occurs when the difference of path lengths between two adjacent reflected rays is an integer multiple n of the wavelength:

At grazing incidence this condition is written

Specular reflection (Ψ = Φ) corresponds to n = 0. Selective beam adsorption will occur for Ψ = 0, i.e. at incidence Φ such that

This shows that, even for λ/d = 10−4, adsorption can take place at incidences of the order of 1°.
Applying this idea to the present problem, diffraction of Ne+ can deflect the particle in and out of a bound state EB of the ion in its image potential Vim(z) (see figure 4) by exchange of a parallel crystal momentum ħG with the periodic surface lattice. In the capture process the ion is slightly accelerated in its forward, parallel motion by acquiring the extra momentum ħG and the increase of parallel kinetic energy is subtracted from the energy of the perpendicular motion. The vertical momentum need not be conserved at the surface of the target, which, by recoiling, acts as a momentum sink.

Figure 4. Schematic image potential showing the energetics of the Ne+ ion capture in its electronic image potential Vim by the exchange of a lattice momentum ħG parallel to the surface. The spectrum of shallow bound states (see the appendix) is quasi-continuous. Tosc indicates the duration of one full vertical oscillation between the classical turning point z0 and z1. The bounce length is LB = Losc = Toscv.
Download figure:
Standard image High-resolution imageTo work out the kinematics of the process, one must take account of the increase of perpendicular energy just prior to impact due to the ion acceleration in its average electronic (adiabatic) image potential |Vim|. From energy conservation we can write

The final perpendicular energy EB after diffraction is given by

where v is the ion velocity parallel to the surface and where

Φim is the incidence angle at the height z where diffraction takes place, most likely at the average distance of closest approach z0 where the surface potential corrugation is maximum. The G 2 term in (5) can be neglected since G ≪⃒ k||. The average image potential can be modeled by
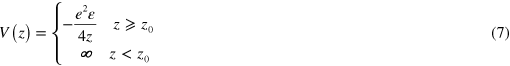
where  = (e − 1)/(e + 1) ≈ 1/3 is the electronic response function of the substrate (e = 2 for LiF) and z is the distance from the surface plane. For capture to occur one must have V0 < EB < 0, where V0 = −e2/4z0 = −0.63 eV is the bottom of the image potential of the ion at the distance of closest approach to the surface estimated as z0 = 1.8 Å in [1] (figure 4). This gives

where  , with a = 4.02 Å the LiF lattice constant and n any positive integer. At sufficiently small Φim, equation (5) may however be fulfilled only for the smallest
  , i.e., n = 1, which is the case considered here. Condition (8) actually conforms to the didactic calculation in equation (3) for n = 1. Other angular thresholds may occur for n > 1, but the matrix elements for diffraction by the surface corrugated potential are likely to decrease rapidly with increasing n (calculation of the periodic surface potential and of the dynamics of ion scattering by this potential will be considered in a future publication). Using numerical values appropriate to the experiment of figure 1, i.e. 1 keV Ne+ at 0.95° incidence [2], one obtains ħvG = 0.9755 eV and a shallow bound state energy EB = −0.07 eV is found. This argument shows that the diffraction mechanism is allowed and can produce the capture and the following bouncing motion for this incidence angle. The spectrum of bound states of the heavy particle Ne+ being quasi-continuous (see the appendix), the capture is non-resonant. The quantized length LB = Losc is then the fixed parallel length travelled by the ion while it executes one full vertical oscillation between the classical turning points z0 and z1 of the image potential at the selected, constant energy EB (figure 4). After executing a number of ricochets (figure 2), the captured ion can be released at the next surface encounter in the initial specular direction by the reverse elastic diffraction process. The probability of escape at each impact is the same as the capture probability, by virtue of time reversal symmetry.
In the absence of thermal effects, the quantization of Losc is a consequence of the quantization of the crystal momentum ħG , which selects the bound state energy EB in (5) in a precise manner.
3.2. Time of flight Tosc and bounce length Losc in the capture state EB
The value of the time of flight Tosc and bounce length Losc can be obtained by solving Newton's equation for the (perpendicular) motion of the ion in its image potential (7). This is done in section 6. The oscillation time Tosc and hence the bounce length are found to be
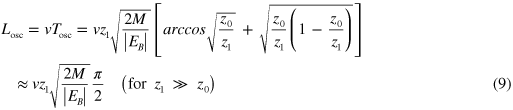
where

is the upper turning point of the arc trajectory (figure 4). Inserting the values of z0 and EB we find z1 ≈ 16.2 Å, Tosc = 6.08 ps and Losc ≈ 6080 Å, about 1500 lattice parameters. It will be shown in sections 5 and 6 that this result allows quite accurate prediction of the observed constant separation of about 48 eV between the echo peaks in figure 1. The mechanism of diffraction-assisted capture and release is therefore consistent with these basic experimental data.
The diffraction mechanism proposed here can be experimentally tested in a number of ways. Most convincing would be to see ricocheting persist at low temperature 6. Another test would be to check for the existence of a discrete sequence of critical incidence angles Φc( G ) for a given incident energy at which the normal kinetic energy falls at the vacuum level for that particular G -vector. Since above each of these angles there should be no skipping observed for the corresponding G -vector, a sequence of spikes should occur in the final skipping intensity as a function of Φim, provided there is enough sensitivity and resolution. A third test would consist in changing G while keeping Φ constant by changing the azimuthal orientation of the single crystal surface, which should modify EB and the observed energy loss at each ricochet.
4. Brief sketch of the semi-classical theory
In [1] we discussed the spectrum of the specularly reflected particles, i.e. the parent peaks I0 and J0 observed by Borisov et al [11] in an experiment quite similar to the present one [2] (figure 1), in terms of multiple excitations of the so-called Fuchs–Kliewer (FK) surface phonons. The frequency of the FK phonons of long wavelength
Q
, is given by the solution of (ω) + 1 = 0, where (ω) is the dielectric function, and is ω = 1014 s−1 (ħω ≈ 70 meV) for LiF [14, 15]. To determine the energy loss we used the semi-classical method in which the classical ion describes the trajectory
R
(t) of the specular reflected motion unperturbed by an energy loss which remains small relative to the initial energy. Its interaction with the FK phonons then amounts to a time-dependent perturbation to which the phonon modes respond as quantum harmonic oscillators driven by a classical time-dependent force. This is an exactly soluble problem in quantum mechanics: each mode
Q
is 'prepared' into a coherent state |α〉, also called the Glauber state [15], This is defined as follows. Let A designate the destruction operator of one mode quantum:
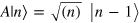
where |n〉 is an energy eigenstate. Then the coherent state |α〉 is defined as an eigenstate of A:

The complex eigenvalue α is called the (time-evolving) coherent amplitude of the mode. α is additive in the sense that the coherent amplitudes generated by two successive portions of the ion path add up. At any moment of the ion flight, the eigenstate |α〉 is a linear combination of energy eigenstates |n〉 with probability coefficients following a Poissonian distribution [1, 16–18]. By energy conservation, the energy loss spectrum of the particles measured by the spectrometer must coincide with the Poissonian energy excitation spectrum of the FK field left behind [19].
The semi-classical approach remains fully justified here for interpreting the parent peaks [1] and, say, the first echo peaks in figure 1 for which the energy losses are less than 10% of the incident energy. For higher order echoes, where up to 20% of the ion energy is lost, the method applies only approximately, since the ion slowing down is not taken into account in the phonon response. The semi-classical approach could be improved by using a trajectory decelerated self-consistently with the average energy loss, since what the phonon field really responds to is the actual time dependence of the ion path. However, in the present paper, for simplicity, we shall ignore this complication.
The general theory is rather cumbersome but takes a simple form when one assumes that the FK phonons are dispersionless, i.e. the FK frequencies ω( Q ) are independent of Q , which is the case in the present context where the relevant wave vectors are of the order of | Q | = ω/v ≈ 0.0031 Å−1, i.e. near the surface Brillouin zone center. The normalized spectrum G(Ε) of energy loss E of the particle can be written

with peak intensities following the Poisson distribution. The strength s is given by an integration over the Brillouin zone B

where α(Q) = I( Q ) is the Glauber amplitude of the FK phonon mode Q . It has the general form


z(t) in (14) is the vertical component of the ion position R(t). The coupling function C(
Q
) has been discussed in [1]. The various symbols in (15) have the following meaning [1]: A is the surface unit cell area;
 (z) ≈ 0.35 is an effective dielectric response function of the FK phonons of LiF; z0 is the Ne+ average closest distance of approach to the surface and zim is the position of the ionic image plane. s gives the average energy loss in units of ℏω

When neutralization takes place, the Ne0–FK interaction is turned off suddenly on the time scale of one phonon period. Upon electron transfer, a charge defect or 'hole' F0 suddenly appears on the surface, which couples to the screening field of the total surface polarization, including a contribution from the FK field [1]. The transferred electron carries with itself the effect of this relaxation of the static hole, causing a further important energy loss to the outgoing Ne0 particle [1].
In the present work the semi-classical approach can easily be adapted by using the appropriate trajectory R (t) in (14) to describe either the specular reflected path (parent peaks, as in [1]) or one of the paths in the captured state with one or several ricochets (echo peaks).
5. Coherent amplitudes and incoherent energy losses
5.1. The Ne+ spectrum
Before we apply the semi-classical theory to the present situation, we first analyze the experimental data of figure 1 using only general physical arguments. For the sake of maximum simplicity let us assume here that the surface FK wake field [19] can be represented by one single, effective oscillator of frequency ω. In reality, at grazing incidence, the relevant FK modes making up the wake field form a 2D continuum of wave vector Q satisfying the surfing condition ω − Q · v = 0. This condition expresses the fact that only the modes of phase velocity equal to the ion velocity are resonantly excited. However it will be found in section 6 that the physical arguments which we are about to develop apply independently to each of the Q -modes.
Referring to figure 5, let us then call α = ia (a positive) the amplitude of the Glauber state into which this effective FK oscillator is driven by the incoming Ne+ ion during its initial approach to the surface (for grazing incidence, all amplitudes are pure imaginary; see (31) and (34)). By time reversal symmetry the amplitude for the specularly reflected path is −α* = α (see equation (14)), giving a total (additive) amplitude of 2α and hence an energy loss for the Ne+ parent peak


Figure 5. Schematic representation of the ricochet trajectories for the Ne+ ion. The mean energy losses (in units of ℏω) of the reflected Ne+ are designated by S0 (specular, parent peak), S1 (first echo peak), S2 (second echo peak), etc in terms of the coherent amplitudes α and β of the Glauber states of the FK phonons created at the successive impacts. Notice that while travelling in the bound state the bouncing Ne+ suffers an additional energy loss of 4b2 ℏω at each successive impact.
Download figure:
Standard image High-resolution imageNotice that here the excitation amplitudes created by the incoming and reflected paths add up coherently and therefore the associated energy loss is four times (not twice) the energy loss of either the incident or the reflected paths alone. This constructive interference effect is a property of the phonon coherent state, which also holds in the classical mechanics of the forced oscillator: at resonance, doubling the applied external force quadruples the energy transfer.
Similarly, call β = ib (b positive) the coherent amplitude of the Glauber state into which the FK field mode is further driven by the Ne+ ion in its ascending path in the capture bound state (figure 5). From the additivity property of the coherent amplitudes, the total amplitude for the first capture impact is then α + β and the corresponding mean energy loss is (a + b)2 ℏω.
Turning now to the second impact, it is essential to observe that, because the time of flight Tosc of one bounce lasts about 6 ps (see section 3), by the time the Ne+ ion returns to the surface for the second impact the FK mode excited at the first one will have decayed back to its ground state. This is because the phonon damping constant in ω + iγ is typically γ ≈ 0.05ω, i.e. the phonon lifetime of the order of 1.2 ps is short compared to Tosc. We can therefore assume that, at each new approach to the surface, the trapped Ne+ meets the phonon field anew in its ground state and that the amplitudes of the events occurring at the successive impacts do not add up coherently. In other words, at each impact the coherent amplitudes add up coherently, while from one impact to the next the energy losses rather than their amplitudes are additive. Now, by the property of time reversal symmetry, the additional mean energy loss of Ne+ released into the specular direction at the second impact is identical to the loss at the initial capture impact. Hence the first echo peak, as indicated in figure 5, should occur at

Solving (17) and (18) for a and b, one finds

and

Next, referring to figure 5, we see that, while travelling in the capture state, the Ne+ creates a FK amplitude of 2β and hence suffers an additional mean energy loss ΔI = 4b2 ℏω to the FK field every time it ricochets from the surface. Using (20) for b one finds

The spectacular numerical fact here is that, by using the observed separation I1−I0 = 47 eV in (18) between the first two peaks, the model automatically generates a numerical value of ΔI which is very close to the observed periodic repetition throughout the entire spectrum. Our reckoning of the quantum mechanical additivity of coherent amplitudes at each individual impact and of the lack of such additivity between the successive ricochets is therefore vindicated. Indeed, the model provides an explanation for the unique periodicity in the echo spectrum of figure 1 where the mth echo peak occurs at the mean energy loss

For future reference we note that the observed ratio between the periodic loss ΔI and the parent peak loss I0 is

The ratio ΔI/I0 is what determines the relative scale of the mean periodic losses observed in figure 1. The physical meaning of this number (fortuitously close to the golden ratio!) is simply that the interaction time of the ion when impacting the surface in the trapped state is longer than the interaction time of the first specular impact (see [20] for a quantitative estimation of the interaction time in specular reflection). Section 6 will show that the model Hamiltonian developed in [1] does lead to the empirical values of the individual excitation amplitudes α and β in (19) and (20). Therefore, both the relative energy scale (β/α)2 in (23) and the absolute energy scale |α|2 in (17) of the Ne+ experimental spectrum are accounted for by the present theory.
5.2. The Ne0 spectrum.
The heuristic evaluation developed above is further validated by the following consideration of the relative peak positions In and Jn of the Ne+ and Ne0 spectra shown in figure 1. It was shown in [1] that the average energy loss of the Ne0 parent peak J0 has several components:

Here I0/4 = a2 ℏω = 7.25 eV is the energy loss of the Ne+ on the incident portion of its path (see figure 5), i.e., as emphasized above, one-quarter of the parent peak loss in (17). ΔE = ΔEhole + ΔEAuger = 10.5 eV, where ΔEhole = 6.5 eV is the screening energy of the fixed 'hole' F0 [1] and ΔEAuger = 4 eV is the Auger energy defect [1, 2] (i.e. the difference between the energy necessary to create a LiF exciton at 12 eV above the valence band and the 8 eV energy liberated from a valence band electron falling into the Ne0 ground state). Hence the parent peak separation in figure 1 amounts to

which is close to the observed separation of 11.5 eV. This is not surprising given that in [1] ΔEhole = 6.5 eV was adjusted to obtain the shift of 12 eV discussed there for interpreting the experiment of Borisov et al [11].
More significant is the position of the first Ne0 echo peak J1 given by (see figure 5)

The term I1/2 = (a + b)2ℏω = 38 eV is the energy loss of Ne+ upon entering the bound state at the first capture impact (figure 5); from the fact that processes at successive impact do not interfere, this term is just one-half of the I1 peak loss in (18). The term b2ℏω = ΔI/4 = 12 eV is the additional energy loss of the Ne+ ion on its descending path towards the second impact just prior to neutralization, again one-quarter of the total 48 eV loss in (21). Hence the separation of the two first order echo peaks in figure 1 is

This is clearly different from the parent peak separation and spectacularly close to the observed echo separation of 15 eV. Moreover, since all higher order pairs of echo peaks (In , Jn ) derive from the first order pair (I1 , J1 ) by adding ΔI = 4b2 ℏω = 48 eV to both terms (see figure 5), the separation ΔIn = In − Jn will remain constant at about 15 eV throughout the spectrum, as indeed shown in figure 1. Therefore, the relative unequal shift (In − Jn )/(I0 − J0) ≈ 1.3 is also accounted for by our model.
In conclusion, both crucial ratios ΔI/I0 and (In − Jn )/(I0 − J0), which together determine the relative energy loss scale of the experiment in figure 1, are correctly reproduced by our toy model, in which (i) the FK phonon field responds quantum mechanically to every particle impact (where coherent amplitudes add up) and (ii) there is independence between the inelastic events occurring at successive impacts (where square amplitudes or energy loss add up). Notice that the interpretation of the spectra developed above implies no special assumption on the nature of the capture–release mechanism and demands only time reversal symmetry.
6. Application of the semi-classical theory
6.1. Formalism
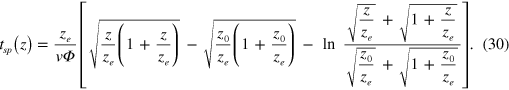
In view of obtaining explicit theoretical expressions for the amplitudes α and β we now need to specify the analytical form of the various trajectories. Referring to figure 6(a), the exact Ne+ incident or outgoing trajectory can be deduced starting from the equation for energy conservation in the perpendicular motion

where v⊥0 = vΦ is the incident perpendicular velocity and where we have introduced a length ze

Figure 6. (a) Models for the specular trajectory: the bold, curved path is the real, image trajectory, while the broken, black lines are straight line approximations (see text). (b) Models for one ricochet: the bold arc is the calculated, image trajectory, while the broken black lines are straight approximations for half the arc (see text). The mean, straight paths are shown in red. The angles are greatly exaggerated for clarity and the axes in (b) are not to scale (z1 = 16.2 Å and Losc = 6080 Å). Note that the cusps at the origin in both (a) and (b) are unphysical and should be thought of as smooth, bowl-shape trajectories extending over a few lattice parameters. Download figure:

From this, we obtain the coherent amplitude of the FK phonon of wave vector Q excited during the specular path
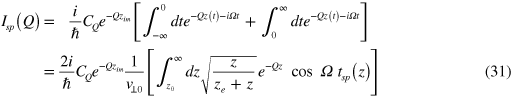
where Ω = ω − Q · v is the Doppler-shifted frequency and where the integral over t has been converted into an integral over z using (28). As stated above, the total amplitude is purely imaginary, like its two equal incident and outgoing components. Isp( Q ) can be calculated numerically by inserting the explicit z dependence of tsp from (30) into the z integral (31). The total strength in (13) would then be calculated via a further 2D integral over Q . However, below, we shall have recourse to a physical approximation to the integral (31), which allows us to dispense with such cumbersome multiple integration and which makes the result much more transparent both physically and algebraically (see [20] for an alternative, accurate method of evaluation).
Similarly, the exact form of the arc trajectory of a ricochet (figure 6(b)) can be deduced from the equation of perpendicular motion

By integration (z0 ≦̸ z ≦̸ z1 )

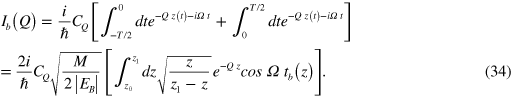
This exact trajectory is plotted in figure 6(b). For z = z1, (33) gives half the oscillating time Tosc (9) of section 3. The FK amplitude is now given by the pure imaginary function of Q
Again, the z integral can be calculated numerically by inserting (33) into (34), but we shall dispense with this below. Later, we shall need the takeoff (or landing) angle φ of the ricochet (figures 5 and 6):

6.2. Upper and lower bounds of the energy losses
Rather than perform the integrals in (31) and (34) by blind numerical force, we shall obtain upper and lower bounds for each of them, which will then allow us to proceed analytically up to the end.
Referring to figure 6(a), we note that the exact, image-curved trajectory is bounded by two fictitious straight trajectories (broken lines labelled Φ and Φim). The lower one, of (experimental) incidence angle Φ, is the specular path in the absence of image attraction, while the upper one, of incidence angle Φim, is tangent to the real image trajectory at the impact point z0. If we substitute one or the other of these two approximations for the real path z(t) into (31), we either overestimate or underestimate the interaction time [20] with the FK phonons and we therefore expect to generate an upper bound Isp(Φ) or a lower bound Isp(Φim), respectively. Using straight trajectories makes the integral in (31) elementary. The result is (as in [1])

where Ψ is either Φ or Φim.
The total strength of the Poisson distribution of the specular, parent peak S0 = 4a2 = I0/ℏω is obtained from integrating (36) over Q (see [1] for details of the calculations). The strength is found to be
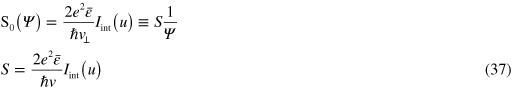
where the quadrature


Figure 7. The integral I(u) defined in (38). The red coordinates u = 0.56, Iint = 0.61 (corresponding to  = 2.8 Å) give the values appropriate for the experiment in [2] under discussion in this paper.
Download figure:
Standard image High-resolution imageFinally. the true strength S0 is bracketed by the two bounds

Turning now to the ricochet trajectory of figure 6(b), we similarly approximate the real path by one or the other of the straight, broken paths (labelled φ and φ1) chosen to encompass the arc. The upper line (takeoff angle φ) will give a lower bound to the FK amplitude Ib(φ), while the lower line (takeoff angle φ1) will give an upper bound Ib(φ1). These approximations again make the integral in (34) elementary. The result is, up to negligible terms proportional to exp(−Qz1),

where ψ is either φ or φ1. Neglecting the upper limit, exp(−Qz1) amounts to taking z1 = ∞, which explains why (40) and (36) have identical forms. The end result for the FK excitation strength Sb = 4b2 caused by one single ricochet is therefore bounded by

where S is given in equation (37).
6.3. Predicting the 48 ± 1 eV echo period
We are now prepared to make the crucial comparison between the theoretical predictions and the observed data of figure 1. Since the predicted strengths in (39) and (41) are bracketed by two incidence or two takeoff angles there must exist two intermediate angles, which we can call Ψ and ψ respectively, for which the strengths (39) and (41) coincide with the exact values. We shall make the reasonable assumption that these intermediate angles can be approximated by the arithmetic means (see figure 6 where the mean paths are shown in red)
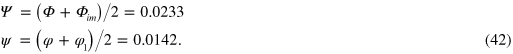
The numerical values of the various angles (in rad) are as follows: Φ = 0.0166 (experimental incidence 0.95°), Φim = √(Φ2 + |Vim|/E) = 0.03 (image potential 0.63 eV), φ = 0.023 66 (takeoff angle for EB = −0.07 eV, see (35)) and φ1 = 2(z1 − z0)/Losc = 0.0047 (z1 = 16.2 Å, z0 = 1.8 Å and Losc = 6080 nm). The mean angles, indicated in (42), are then Ψ = 0.0233 and ψ = 0.0142. Notice that, apart from the incident angle Φ, all other angles are fixed by the bounce state energy EB, itself a consequence of the kinematics of the proposed diffraction mechanism of capture. The ratio between the two strengths Sb/S0 is given by

The numerical value obtained here for |EB| = 0.07 eV is astonishingly close to the empirical scale ratio in (23). This spectacular agreement alone strongly supports our diffraction mechanism of capture and release. The theoretical ratio Ψ/ψ is plotted in figure 8 as a function of binding energy EB. One observes that in the immediate neighborhood of |EB| = 0.1 eV the energy loss per ricochet is insensitive to |EB| in a narrow range. This however ceases to hold for deeper bound states, for which the energy loss rapidly increases with |EB| (figure 8). For example, at |EB| = 0.25 eV, the echo period would be 51.3 eV instead of 48, which is way outside the uncertainty on peak position in figure 1.

Figure 8 (a) The bounce length Losc, calculated from (9), as a function of bound state energy EB. Losc behaves like (EB)−3/2. (b) The ratio, calculated from equation (43), between the energy loss ΔI ♯ 1/ψ separating the echo peaks and the parent peak energy loss I0 ♯ 1/Ψ. The red broken lines refer to the experimental parameters of figure 1. Notice the insensitivity of Ψ/ψ to EB in the neighborhood 0.06 < EB < 0.12, contrasting with the sensitivity of the oscillation Losc in that region.
Download figure:
Standard image High-resolution imageLast and importantly, let us verify that the present theory correctly predicts the absolute energy loss scale fixed by the parent peak position at 29 eV (such scale agreement apparently could not be achieved in the simulations of Villette et al [2] based on thermal capture). Using the value of Ψ = 0.0233 in (42) and of the integral Iint = 0.61 indicated in figure 7 (corresponding to u = 0.54, i.e. the parameters = 0.35, z0 = 1.8 Å and zim = 1.0 Å), the theoretical expression of equation (37) gives S0 = 401 and hence the predicted Ne+ parent peak position S0ħω = 28 eV, which is quite close to the observed value of 29 eV. As announced in section 4, the empirical values of both the coherent amplitudes α and β deduced from the experimental spectrum are therefore correctly given by our energy loss theory.
Successful predictions of other characteristics of the experimental ricochet spectrum will be made below and in section 7, which will further support the validity of the model.
6.4. Anomalously low angle reflection of neutrals Ne0
One experimental observation in the paper by Villette et al [2] is the occurrence of a group of neutral particles Ne0 in the primary reflected flux from 0.7 to 1.3° grazing exit angles (see figure 2 in [2]). Such low angles are smaller than the main Ne0 reflected beam angle expected around 1.8°. This latter value is the normal behavior, pointed out in [2], given that (i) the Ne+ impacts the surface at an image-augmented incidence of Φim = 1.72° and (ii) the image interaction is turned off for outgoing Ne0, which therefore emerge at 1.72° [2]. We propose that the apparent low exit angle anomaly is a possible manifestation of the diffraction of Ne+ occurring at the original impact, as illustrated in figure 9, where the low-angle neutral flux is designated Ne0DN.

Figure 9. Schematic representation of the various scattering directions of the emerging particles upon Ne+ impact on the surface. The symbols R, N, D and D−1 stand for reflected, neutralized, diffracted and reverse diffracted, respectively (see text). The neutral beams Ne0DN, Ne0RN, ... should emerge at the ricochet takeoff angle φ, lower than the specular angle Φim.
Download figure:
Standard image High-resolution imageThe diffracted neutral beam Ne0DN emerges at the low takeoff angle φ at the first impact and at each of the successive ricochets at LB, 2LB etc Naturally all the exit directions are expected to be somewhat dispersed around the discrete values considered here if 'angular straggling' on surface phonons and defects does take place [2].
7. Multiple bounces
7.1. Peak positions
Consider now a skipping trajectory making m bounces of the same length LB (figure 2) before escaping in the specular direction. The average energy loss after the mth bounce is now given by (22), i.e. by the Poissonian strength

Note that with the average energy losses Sm ħω all being several tens of eV, all Poissonian strengths Sm in (44) are very large (several hundred). Now we can replace a (normalized) Poisson distribution of large strength s ≫⃒ 1 by a single (normalized) Gaussian centered at sħω, using

Substituting for s the various average strengths (44) gives the successive Gaussian peak positions at Em = Sm ħω.
7.2. Peak intensities
Knowing the peak positions, we can now write a compact formula for the complete Ne+ spectrum I(E) explicitly, taking account of the cumulative losses along the ion path:

The first term represents the Ne+ parent peak I0 and the m > 0 terms are the echo peaks Im . P gives the overall intensity of the Ne+ echo phenomenon relative to that of the parent peak. Each echo involves both the capture and the release scattering, so P depends, among other factors (such as escaping neutralization), on the square of the Ne+ probability of diffraction by the corrugated surface potential. The parameter p in (46) is the relative probability for the next bouncing to occur without diffraction or neutralization. The calculation from first principles of P, p, the neutralization probability pn and likely interference effects between them is a complex quantum mechanical problem of combined scattering and charge transfer in the periodic image and Madelung surface potential. Clearly this problem lies outside the scope of the present work. However, ignoring interferences, P, p and pn can be evaluated from figure 1: P = 0.080 is given by the observed ratio P/√(1 + Φr) = Ι1/I0 = 1/20 of the first echo to the parent peak heights, p = 0.25 is obtained from the ratio I2 /I1 = 1/6 of the second echo to the first and pn ≈ 1/3 is the ratio between the Ne+ and Ne0 parent peak heights. The non-uniform shifts I0 – J0 ≈ 11.5 eV and I1 – J1 ≈ 15 eV between the Ne+ and Ne0 spectra (figure 1) have been explained in section 5, so we need not write down a separate spectrum for the Ne0 particles. The Δm in (46) are Gaussian width parameters that we now explain.
7.3. Peak widths
Finally we discuss the widths of the successive peaks in the spectrum of Ne+ (those of Ne0 are comparable). The quantum mechanical width of the Gaussian in (45) is proportional to √s, so one expects the mth peak of the Ne+ spectrum in (46) to have a width proportional to √Sm . These peak positions and quantum widths are shown as broken red curves in figure 10. Clearly the quantum uncertainty on the excited number of FK phonons falls short of explaining the observed widths. However, it has been shown in [1] that the observed width γ0 (FWHM) of the parent peak is much larger than the expected quantum width 2(2 ln 2 S0)1/2ħω ≈ 3.47 eV (with S0 ≈ 416, i.e. I0 = 29 eV). This arises from a variety of effects such as inhomogeneous broadening, FK phonon resonance width, instrumental energy and angular resolutions [1]. In the work of Villette et al [2], the broad parent peak width is 12 eV (figure 10). If we call Δpar the broadening of the parent peak one has γpar = 2[2 ln 2(S0 + Δpar)]1/2ħω ≈ 2(2 ln 2Δpar)1/2ħω ≈ 12 eV, with Δpar ≈ 5151 ≫⃒ S 0 . Then the width γm of the mth peak reduces to


Figure 10. Comparison between the experimental Ne+ spectrum (black triangles) [2] and the calculated spectrum. The full black curve running through the observed peaks show the result of the present theory, equations (46) and (47), including the broadening of the parent peak I0 set to the observed value of 12 eV. The broken red curves give the spectrum with just the quantum widths of the Poissonian distributions (FWHM of 3.47 eV for the parent peak).
Download figure:
Standard image High-resolution image
The Δm are those appearing in (46). The widths calculated from (47) are then γpar = 12 eV (measured), γ1 = 20 eV, γ2 = 25 eV, γ3 = 30 eV, etc, in perfect agreement with the increasing widths (FWHMs) shown in figure 10.
The theoretical Ne+ energy loss spectrum as calculated from (46) and (47) is shown in figure 10 on the same log scale as the experimental data points. Most satisfactory is that the scale of energy losses based on diffraction capture coincides with the experimental energy scale. The present model fully accounts for the spectrum. Only the calculated fourth echo has a deficit in intensity as compared to the (somewhat diffused) experimental peak. This could be related to the slowing down of the ions which, this far into the skipping motion, have lost about 20% of their kinetic energy to FK phonon excitations. Such slowing down is likely to affect the probability parameters P and p, which were assumed unchanged in the present model.
8. Conclusions
We have proposed a novel capture–release mechanism based on selective adsorption by quantum diffraction for the skipping motion of an energetic Ne+ ion scattered by a LiF(001) surface at grazing incidence. The ricocheting is accompanied by large energy losses of scattered Ne+ and Ne0 particles due to the excitation of a giant number of FK phonons of LiF. The relative positions of the parent peaks and of the echo peaks in the observed oscillatory energy loss spectra [2] fully support the proposed capture–release mode and the absolute energy loss scale set by the parent peaks is correctly predicted by calculations based on the semi-classical theory of energy losses [1] without recourse to any thermally assisted process.
It appears that the skipping phenomenon observed in [2] is a beautiful case of complementary classical and quantum behaviors of the scattering partners: the Ne+ ion behaves quantum mechanically as far as its capture–release process is concerned while it acts as a classical particle in driving the FK wake field, whereas the FK phonons respond quantum mechanically at each impact but incoherently from one impact to the next.
Inelastic thermal effects at each Ne+ collision with the surface may in principle cause additional losses and broadening, e.g. via an uncertainty on the bound state energy EB, the beam angular spreading, etc However, the fact that complete agreement between theory and experiment could be achieved here without taking such effects into account indicates that they may play a smaller than expected role in the problem. All in all, as recent work on the scattering of energetic neutral atom reminded us again, [6], [12] at the low grazing angles of the experiment, all short range collisions of Ne+ with the rows of surface atoms are expected to be progressive, correlated, small angle forward elastic scattering resulting in overall specular reflection.
Ricocheting of energetic ions has been reported for several systems [2, 7–10] and should be a general phenomenon taking place at the surface of any polar material, at least in a suitable range of incidence angles and at energies for which the substrate can exert an adiabatic, attractive force capable of capturing the charged particle. Skipping at high energy and angular resolutions appears to offer an alternative way to probe both the short and long range interactions between particles and surfaces of polarizable materials.
Acknowledgements
Three of us (AAL, GB and MS) are grateful to the Donostia International Physics Center for hosting this research for various periods of time. One of us (AAL) is grateful to H Khemliche for providing the original data of figure 1 and for several fruitful discussions in the course of this research. This work is dedicated to the memory of our friend and distinguished colleague, Jean-Pol Vigneron.
Appendix
Appendix. Ion energy levels in the image potential
Here we shall derive the energy levels of the Ne+ ion of mass M = 36 000 me in the image potential (7) modeled by (see figure 4 where the steep rise of Vim is replaced by a hard wall)
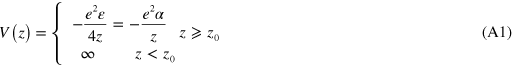
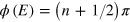
where = 1/3 and α = 1/12. For a heavy ion with very short de Broglie wavelength it is appropriate to use the WKB approximation [21–23], so the bound state energy levels are given by
where

and the turning points are z0 and z1 = 1.133 Å/EB (eV) = 6.2 Å.
From (A2) we obtain the implicit equation

where β = M/m, V = V(z) and

If we expand f for small E/V0 = z0/z1, we find


Therefore the lowest bound state n = 0 is at E = −0.61 eV, slightly above V0 = −0.63 eV. We shall be interested in the higher levels n + a ≫⃒ 1 and their spacing

At low binding energies

This gives the level spacing in the meV range, e.g.
n = 0 12 meV
n = 109 (E = −0.1 eV) 5.2 meV
n = 145 (E = −0.07 eV) 0.6 meV.
This means that for low binding energies the ion levels form a continuum.