


Abstract
We have fabricated new perovskite multiferroic PbFe Sb
Sb O3 with a high degree (up to 0.9) of chemical ordering and unexpectedly high-temperature magnetic relaxor properties, which can barely be described within concepts of conventional spin glass physics. Notably, we found that the field-temperature phase diagram of this material, in the extremely wide temperature interval, contains the de Almeida–Thouless-type critical line, which has been the subject of long debates regarding its possible experimental realization. We explain our findings by the creation, at high temperatures of not less than 250 K, of giant superspins (SSs), owing, curiously enough, to the antiferromagnetic superexchange interaction. We show that these SSs are capable of strong high-temperature magnetic relaxation in the relaxor phase, down to about 150 K, where they transform into a SS glass phase. On further cooling, the material experiences another striking transition, this time, into an ordinary (single-spin) antiferromagnetic phase. We comprehensively analyze the above complex physical picture in terms of three complimentary theoretical approaches. Namely, the ab initio calculations elucidate the microscopic mechanism of giant SS formation, the high-temperature expansion accounts for the morphology of these clusters, and the random field approach provides the description of disorder-related characteristics.
Export citation and abstract BibTeX RIS

Content from this work may be used under the terms of the Creative Commons Attribution 3.0 licence. Any further distribution of this work must maintain attribution to the author(s) and the title of the work, journal citation and DOI.
1. Introduction
The dilution of magnetic systems with non-magnetic elements in solid magnets [1, 2] or in fluids [3, 4] as well as the embedding of magnetic nanoparticles in an otherwise non-magnetic matrix [5–8] are known to lead to a very interesting phenomenon known as superparamagnetism. Superparamagnetism is a state formed by frustrated superspins (SSs) composed of individual but strongly correlated atomic spins. This state is similar to that of the ordinary paramagnet, where the atomic magnetic moments are independently thermally excited and do not organize any cooperative order parameter.
Apart from purely fundamental interest, superparamagnetism is very important for magnetic memory storage devices [9] as well as in numerous biomedical applications such as cancer treatment and drug delivery in the human body [7]. Superparamagnetic materials can also be applied for magnetic resonance imaging improvements [10], in magnetocaloric effect-mediated fridges [8] and in many other devices (see [1] for a recent comprehensive review of superparamagnetism in solids).
The first studies of superparamagnets were performed by Neel [5] and then Brown [11]. They studied the ensemble of monodomain ferromagnetic particles, which are so small that their total magnetic moments fluctuate thermally like individual Heisenberg spins. These fluctuations suppress the average magnetic SS moments, making the system formally paramagnetic. These authors found that one of the main features of small-particle superparamagnets is anomalous magnetic relaxation or, in other words, strong frequency dispersion of magnetic permeability. We will focus on this property in the present study.
To emphasize the difference from ordinary superparamagnets, we will consider a diluted bulk system PbFe Nb
Nb O3 (PFN), which has recently attracted much attention [12–18]. In this material, the magnetic moments of Fe3+ are diluted by Nb5+, which is non-magnetic: the Fe and Nb ions are distributed randomly in the same pseudocubic lattice. In spite of this strong dilution, PFN becomes antiferromagnetic (AFM) below about 150 K, and then, on further cooling, at about 10–20 K, transforms into magnetic glass [15, 16, 19, 20]. However, owing to the relaxation inherent in magnetic glasses, PFN exhibits weak frequency dispersion of magnetic susceptibility at 10–20 K [19, 20]. Note that somewhat stronger dispersion, although still at temperatures below 25 K, has been observed in PFN diluted with non-magnetic PbMg
 W
W O3 [21].
Similar glassy effects were found in ferroelectrics [22]: for example, there are many systems with so-called quenched random fields, breaking the ferroelectric domains and making the ferroelectrics behave as dipole glasses [23–25]. These glasses show some dispersion of dielectric permittivity. However, it is known that, besides the glassy ferroelectric phases, there exist others, called ferroelectric relaxors, having different behavior from that observed in pure dipole glasses. Lead magnesium niobate (PMN), Pb(Mg Nb2/3)O3, is the most studied canonical example of a ferroelectric relaxor [26, 27]. It possesses extremely wide (actually, logarithmically wide) frequency dispersion of dielectric permittivity and, notably, its maximum ac dielectric permittivity can exceed 20 000 at low frequencies, while it can be around 175 at high frequencies [28]. It is believed that PMN contains local polar nanoregions, due to the specific arrangement of Mg and Nb ions in the lattice [29], and these regions have (possibly giant) electric dipole moments [30], reorienting between different directions. It is interesting that, historically, one of the first models describing the dielectric properties of PMN was simply a superparaelectric model [31], which to some extent is analogous with a superparamagnet. In comparison with diluted magnets or superparamagnets, ferroelectric relaxors are very different. The known diluted magnets behave more like magnetic glasses, though exhibiting some glass-like dispersion of magnetic susceptibility, while the dielectric relaxation in the ferroelectric relaxors is very much stronger and occurs at significantly higher temperatures.
The above discussion raises several questions of general physical interest. The first question is whether the single-phase crystalline magnetic material behaves as a disordered SS glass system or like ferroelectric relaxors, similar to PMN. By this, we mean, first of all, whether magnetic crystals (or bulk materials) can have logarithmically wide frequency dispersion of magnetic susceptibility, and, secondly, whether this can happen at high temperatures. Our next question concerns the microscopic origin of the SSs in such relaxors. Namely, what mechanism binds single atomic spins in a nanoregion into a collective superspin? Last but not least, what is the magnetic ground state of such relaxors; namely, is it glassy or not? Additionally, it is of interest to explore the field-temperature phase diagram of such uncommon systems.
In the present study, we shall answer the aforementioned questions. In particular, we will show that the desired high-temperature magnetic relaxors can be obtained, but in a fabrication scenario different from those discussed above. Specifically, instead of employing the two known fabrication methods of diluting the magnetic substances and creating small-size magnetic inclusions in a non-magnetic matrix, we originally employed another one; namely changing the chemical ordering degree of the magnetic and non-magnetic elements in the complex compound. We have exploited this possibility by applying high-pressure synthesis to prepare samples of PbFe Sb
Sb O3 (PFS), a double perovskite, possessing a high degree (estimated as 0.8–0.9) of rock-salt chemical order of the Fe3+ and Sb5+ ions in the pseudocubic lattice [32]. This high degree of ordering, on the one hand, prevents the percolation of the Fe magnetic moment over the lattice, but, on the other hand, this order is not perfect and results in the emergence of dynamic magnetic nanoregions with large frustrated magnetic SSs. Their origin is elucidated by ab initio calculations.
2. Experiment
PFS ceramic samples were prepared in two stages [32]. First, we synthesized the stoichiometric composition of Pb2FeSbO6 from the initial PbO, Fe2O3 and Sb2O5 oxides at 1020–1030 K for 4 hours. The resulting compound had a pyrochlore crystal structure. The second stage of this synthesis was performed at a hydrostatic pressure of 6 GPa and temperature of 1400–1500 K for 5 min. The product of the second high-pressure synthesis was dense coarse crystalline (the crystallite size varied from 1 to 5 μm with a mean size of approximately 2 μm) polycrystals of PFS with an almost perfect perovskite lattice and without any visible parasitic phases. Room-temperature x-ray diffraction patterns of PFS correspond to a cubic symmetry (space group Fm  [32]) and exhibit superstructure lines attributed to a double perovskite unit cell caused by chemical 1:1 ordering of Fe3+ and Sb5+ ions. The mean value of the chemical ordering degree was estimated as 0.8 to 0.9. According to our experimental and theoretical analysis, this chemical ordering does not change on heating, up to temperatures of 800–900 K. All structural transformations observed by x-ray diffraction experiments in PFS were thoroughly analyzed and assigned [32]. For example, the Bragg peak broadening observed in the 240–250 K temperature interval was fitted by a cubic-to-tetragonal phase transformation model.
The magnetic measurements were carried out using the SQUID magnetometers MPMS-5S and MPMS-XL (Quantum Design) under several important protocols including field cooling (FC) and zero-field cooling (ZFC) in the dc regime. The ac magnetic susceptibility was measured by employing the driving magnetic field of H = 3.9 Oe. Dielectric susceptibility measurements were carried out using a Novocontrol Alpha-A impedance analyzer. Electron paramagnetic resonance (EPR) measurements were performed at 9.407 GHz in a temperature range from 4 to 300 K, by employing the Bruker E580 spectrometer and Oxford Instrument cryostat.
3. Results
3.1. Dielectric data and ac magnetic susceptibility
Figure 1 presents the temperature dependence of the dielectric permittivity and ac magnetic susceptibilitiy measured at different frequencies. Dielectric permittivity shows one distinct peak at 188–190 K along with a second smaller feature at higher temperature (figure 1(a)). The temperature position of the former peak is slightly frequency-dependent and is related to a paraelectric–ferroelectric phase transition. The ferroelectric origin of this peak is confirmed by dielectric hysteresis loops exhibiting typical ferroelectric behavior with saturation polarization up to 5–6 μC cm−2 (see inset in figure 1(b)). Remanent polarization appears below the dielectric peak temperature. Note that, as already mentioned above, x-ray diffraction studies of PFS showed that this material experiences a structural transformation to the tetragonal I4/m phase in the range 210–220 K [32]. However, the latter result contradicts our present data as I4/m is a non-polar phase, whereas we found that the low-temperature phase is polar. At the same time, the dielectric anomaly that we observed in PFS can be preliminarily explained by a cubic-to-tetragonal phase transition, while the actual symmetry of this tetragonal phase still needs to be determined.
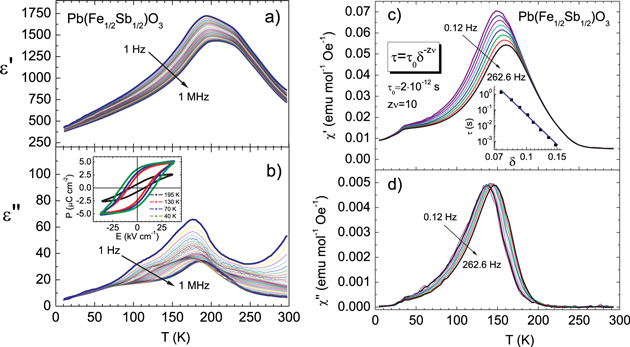
Figure 1. Dielectric and magnetic responses of PFS. Left panels: temperature dependence of the real (a) and imaginary (b) parts of the dielectric permittivity. Inset in panel (b) shows ferroelectric hysteresis loops measured at 50 Hz and at temperatures shown in the legend. Right panels: temperature dependence of the real (c) and imaginary (d) parts of ac magnetic susceptibility. The inset in panel (c) shows a double logarithmic plot of relaxation time τ versus reduced temperature  (solid line), where Tm is the temperature of the
  maximum and Tg is the freezing temperature, which we found from the fit (see text).
Download figure:
Standard image High-resolution imageThe data in figures 1(c) and (d) show huge peaks in both real,  , and imaginary,
  ", parts of the ac magnetic susceptibility at
  150–160 K, which strongly shifts to lower temperatures as the frequency decreases. This behavior is similar to that of ac PMN dielectric permittivity [28]. Such unusually large high-temperature magnetic dispersion requires detailed discussion.
Besides the main peak, the magnetic susceptibility has a second magnetic anomaly at 30–32 K (see figures 1(c) and (d)), and we found it to be field- and frequency-independent. Therefore, this peak in the magnetic susceptibility seems to correspond to a normal phase transition. Below, we will show that it is of AFM nature. This means that PFS belongs to the multiferroic family. Although the multiferroic behavior of PFS is also very interesting, hereafter we will focus only on the magnetic relaxation properties.
The unusually strong frequency dispersion of the magnetic susceptibility discovered experimentally in PFS suggests that its spins are involved in thermally activated relaxation processes. The main characteristic of this relaxation, the mean relaxation time  , can be obtained from the standard relation between
  , the temperature of magnetic susceptibility maximum Tm and the glassy phase transition temperature Tg [33]:

where  is the reduced temperature,
  is the critical exponent of the correlation length and z is the dynamic exponent. From the fit of equation (1) to the experimentally measured relaxation time (see inset in figure 1(c)) we obtained physically reasonable values:
  s, Tg = 140 K and the critical exponent
  . A tentative fit of the Arrhenius law for
  to the experiment (also known as the Neel–Brown law obtained for weakly interacting SS magnetic moments [5, 11]) led to unphysical values of
  and
and  . However, we obtain reasonable agreement with the experiment by employing the Vogel–Fulcher law [34] which is common for the description of spin glass dynamics:

Here T0 is a characteristic temperature, which is close to the paramagnet–glass phase transition temperature determined as the temperature of the ZFC dc susceptibility maximum. Our experimental data were satisfactorily fitted by equation (2) with the following parameters:  ,
,  and
and  .
.
3.2. Magnetization
We now turn to dc measurements. The results of our measurements of the ZFC and FC dc magnetic susceptibilities of PFS are reported in figure 2(a). One can see that the magnetic susceptibility strongly depends on the temperature and applied field. Moreover, on cooling, it exhibits an abrupt increase at approximately 250 K and then, in the temperature region between 100 and 150 K, the ZFC magnetic susceptibility (dashed lines) shows a pronounced maximum. Below this maximum, we observe that FC and ZFC magnetic susceptibilities are very different, which indicates the appearance of the irreversibility, a peculiar feature of glasses; see, e.g. [33]. Finally, another smaller maximum is observed at 30–32 K in both ZFC magnetic susceptibility,  , and FC magnetic susceptibility,
  . We notice a dramatic difference in our results for PFS from those obtained for PFN (see the lowest group of curves in figure 2(a)). One can see that all curves corresponding to different fields, 20
  5000 Oe, for PFN, merge into one master curve which means that its susceptibility is almost field-independent, except for the 10–12 K region at the spin–glass phase transition (see also [19]), and the magnitude of this susceptibility is rather low. Contrary to this, the magnetic susceptibility of PFS, at low fields, is large and has significant magnetic field dependence.
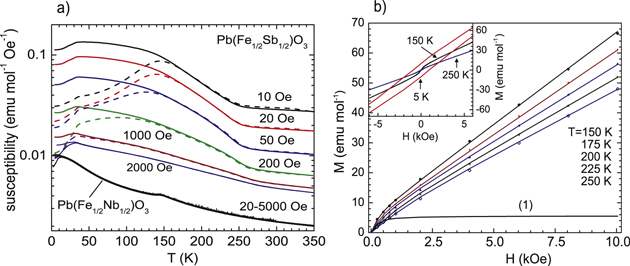
Figure 2. dc magnetic susceptibility and field dependence of magnetization of PFS. (a) Temperature dependence of the ZFC (dashed lines) and FC (solid lines) magnetic susceptibility of PFS in the logarithmic scale, at the applied fields from 10 to 2000 Oe. For comparison, the lowest group of lines in figure 2(a) shows the FC (these lines saturate at low temperatures) and ZFC (these lines barely depend on the field and have a maximum at approximately 12 K) susceptibility of PFN subject to the applied fields from 20 to 5000 Oe. (b) Field dependence of magnetization for PFS at different temperatures (150–250 K). The inset shows the hysteresis curves at 250, 150 and 5 K. Solid lines in the main panel are calculated curves. The solid line (1) shows the SS contribution to magnetization at T = 150 K.
Download figure:
Standard image High-resolution imageAll these data show the existence in PFS of thermally activated frustrated SSs, inherent to superparamagnets. Note that the superparamagnetic phase can actually be considered as the so-called Griffiths or paraglass phase, which can emerge in disordered magnets [35] or ferroelectrics [36]. In this phase, the weakly interacting SSs (which appear in finite magnetic regions as clusters) generate effects akin to those in ferroelectric relaxors (like strong frequency dispersion of magnetic susceptibility).
Let us discuss the field dependence of PFS magnetization presented in figure 2(b) for several selected temperatures. To understand these data, we approximated them by the sum of two Langevin functions L(x):

The first term in equation (3) describes the paramagnetic contribution of Fe3+ ions with the magnetic moment  . The second term is the contribution of SSs, which we believe to be responsible for the activation of the strong relaxation processes (see below). Here, m is the SS magnetic moment. The weights
  and
and  of the individual and SS contributions are temperature-independent in the considered temperature region. We fitted function (3) to the experimental data shown in figure 2(b) and obtained, at 150–175 K, the SS magnetic moment
  . Thus, the SSs are extremely large, while, as we observed, their weight does not exceed 5.5 emu/mol at 175 K. This feature is a difference between magnetic and ferroelectric relaxors. Indeed, only a large magnetic moment m of SSs can have the product mH of the order of thermal energy kBT that makes this SS particularly distinct from single Fe magnetic moments, for which μFeH is much smaller than kBT. Below, we will describe some microscopic mechanisms supporting the emergence of such SSs in PFS due to special local chemical ordering of Fe ions.
The SS magnetic moment m was found to decrease on heating from 175 to 250 K, but it does not vanish completely even at room temperature. This magnetic moment also varies from sample to sample due to the influence of synthesis conditions on the chemical ordering of Fe and Sb ions.
Note also that the SSʼs contribution to the magnetization depends on temperature at low fields only. This is because the high field completely aligns the magnetic moments of SSs, making their thermal motion impossible. This is seen in figure 2(b) (main panel), which exhibits a nonlinearity of magnetization owing to the SSs at low fields only. Consequently, magnetic susceptibility  has a strong low-field contribution of the SSs. Below, we will illustrate this fact theoretically.
3.3. EPR data
To elucidate the question of how the atomic spins in the above magnetic relaxor form the SSs, we need to investigate the microscopic structure of PFS. Having this goal in mind, we measured the EPR spectrum. These measurements were performed at 9.407 GHz and in a temperature range from 4 to 300 K. We obtain that, at T  250 K, the EPR spectrum of PFS contains only one resonance line, which has a Lorenzian shape (figure 3). We attribute this to the paramagnetic resonance of individual Fe3+ (
 ) ions. As the temperature decreases below 250 K, another line shows up at low fields. This line shifts towards lower resonance fields (in accordance with 8
). Fortunately, its intensity, as a function of temperature, correlates well with the magnitude of the low-field dc ZFC susceptibility (see the inset in figure 3). Thus, it is reasonable to ascribe this low-field line to the magnetic resonance of SSs, which starts to increase in size and number below 250 K.
) ions. As the temperature decreases below 250 K, another line shows up at low fields. This line shifts towards lower resonance fields (in accordance with 8
). Fortunately, its intensity, as a function of temperature, correlates well with the magnitude of the low-field dc ZFC susceptibility (see the inset in figure 3). Thus, it is reasonable to ascribe this low-field line to the magnetic resonance of SSs, which starts to increase in size and number below 250 K.

Figure 3. EPR spectra of PFS measured at T = 260–150 K. The inset shows the normalized intensity of the low-field line attributed to the SS magnetic resonance (points) compared with the ZFC susceptibility (solid line).
Download figure:
Standard image High-resolution imageIt is interesting that the first EPR line, obtained at 3.34 kOe, which we attributed to the Fe3+ individual ions, broadens critically and disappears completely on cooling at  K. This fact can be explained by a spontaneous antiparallel alignment of the Fe3+ spins below this temperature. This suggestion agrees with the independence of the magnetic susceptibilities peak at 30 K on the magnetic field magnitude and frequency (figures 1 and 2).
3.4. H-T phase diagram
One can see from figure 2(a) that both the peak temperature Tm(H) of the ZFC susceptibility and the irreversibility onset temperature (i.e. the temperature around the ZFC susceptibility maximum Tm(H), where FC and ZFC susceptibilities begin to be significantly different) strongly decrease on the field increase. Surprisingly, our data can be well fitted with a so-called de Almeida–Thouless (AT)-type formula [37] of the H-T phase diagram: ![$H({{T}_{{\rm SG}}})=A{{\left[ 1-\frac{{{T}_{{\rm SG}}}(H)}{{{T}_{{\rm SG}}}(0)} \right]}^{3/2}}$](https://content.cld.iop.org/journals/1367-2630/16/11/113041/revision1/njp503556ieqn45.gif) , where we assumed that TSG(H) is equal to the SS glass transition temperature defined by the onset of strong irreversibility in the temperature variation of magnetization as suggested, for example, in [33]. Initially [37], the AT line was introduced theoretically for systems such as ergodic spin glass, as the line of stability of the replica symmetric solution, in the framework of the Sherrington–Kirkpatric model with an infinite range of random interactions between the constituting spins in a spin glass. Further Monte Carlo simulations [38] showed that this line also occurs in vector spin glasses, which is the case for our system.
, where we assumed that TSG(H) is equal to the SS glass transition temperature defined by the onset of strong irreversibility in the temperature variation of magnetization as suggested, for example, in [33]. Initially [37], the AT line was introduced theoretically for systems such as ergodic spin glass, as the line of stability of the replica symmetric solution, in the framework of the Sherrington–Kirkpatric model with an infinite range of random interactions between the constituting spins in a spin glass. Further Monte Carlo simulations [38] showed that this line also occurs in vector spin glasses, which is the case for our system.
In order to eliminate possible ambiguity in the determination of TSG(H), we analyze the temperature derivative of the magnetization,  , for both ZFC and FC data. TSG(H) was determined as the temperature where the derivative
  starts to deviate markedly from that of MFC(T). The fit of the above AT-type formula to our experimental data is shown in figure 4 by the solid line. One can see that this fit is nearly perfect and signifies the stability of the superparamagnetic phase above the phase boundary line, which, at low fields, has some features of ferroelectric relaxors and can thus be referred to as the magnetic relaxor phase. This essentially differs from that in PFN, where a similar AT-type formula was used to describe the stability of the AFM phase against the spin-glass state, which appears as a re-entrant phase at
  [19].
[19].
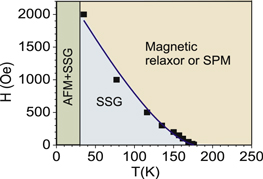
Figure 4. Temperature-field phase diagram of PFS at small magnetic fields. The diagram shows the phase boundary line between the superparamagnetic (SPM) and superspin glass (SSG) states described by an AT-type formula (solid line). Note that this H–T phase diagram describes the magnetic properties of PFS only at magnetic fields H  2000 Oe. In stronger magnetic fields H
  2000 Oe, PFS behaves like a normal paramagnet down to TN = 30 K where it transforms into an AFM with admixture of the SS glass state.
Download figure:
Standard image High-resolution imageThe H–T phase diagram presented in figure 4 shows a remarkable transformation, on cooling, of the superparamagnetic phase into the SS glass phase. On further cooling, the majority of the Fe3+ spins, uncoupled into SSs, undergo AFM long-range ordering with the Neel temperature TN = 30 K. Obviously, the state at  can be considered as a mixed AFM–SS glass state.
4. Theoretical modeling
4.1. Random field model of the SS relaxation
Here we calculate the complex magnetic susceptibility (in the sense of the Casimir–du Pré approximation [39]) 
 , where M* is magnetization and H0 is the external magnetic field, by means of deriving an original phenomenology valid for the new class of materials, magnetic relaxors. Note that, in its turn, the magnetization can be expressed via the reduced (normalized) dynamical magnetization
 , where M0 is the saturated magnetization (see [40] and references therein). This magnetization is dynamical, i.e. dependent on the frequency
  of the external magnetic field, revealing the existence of relaxing constituents (here we consider the SSs arising from extended AS defects, which form chemically disordered regions in PFS, see below) with different relaxation times τ in the system. In fact, the distribution of the relaxation times is a consequence of the randomness of the positions and fields at different SSs [41]. This implies that, to describe our experiment adequately, we need to employ a random field approach.
The idea of the random field model [42] is to express the distribution function of the relaxation times τ via the random fields H acting among the SSs, due to the spatial (different sizes of SS clusters as well as presence or absence of a cluster at a certain spatial point) and thermal (different orientation of the magnetic moment in an SS cluster) disorder. In principle, the distribution function of these random fields,  , can be expressed via m* self-consistently in a manner that m* can be presented as the average, with this distribution function9
, of a single Ising-like SS magnetic moment μ (see [40] and references therein):
, can be expressed via m* self-consistently in a manner that m* can be presented as the average, with this distribution function9
, of a single Ising-like SS magnetic moment μ (see [40] and references therein):
It can be shown [40] that the magnetic dipole interaction between SS clusters generates the Lorentzian distribution function of random magnetic fields
where n = N/V is the SS concentration and  ,
,  , τ is a single SS relaxation time, which has the Arrhenius form [41] (note that this Arhenius form for the individual relaxing constituents does not prevent the emergence of the cooperative Vogel–Fulcher effect in the set of the relaxors, as we will show below)

with Eact being the activation energy or energy barrier between different SS cluster orientations. Substituting these equations into equation (4) and dividing the result by H0, we obtain the desired complex susceptibility.
In figure 5, we fit the high-temperature 'glassy' maximum of the real part of the theoretical susceptibility to the experimental curves taken from figure 1(c). The parameters of the best fit are:  = 15 and
  . Also, similar to equation (3), we take the magnetic moment
 for the high-temperature peak. This corresponds to the SS concentration
  . It can be seen that the theoretical curves coincide pretty well with the experimental ones for
  , i.e. near the maximum
  and at the high-temperature 'tail' at
  . The latter tail corresponds to the situation where the interaction between SSs is weaker than their thermal energy so that its details are unimportant. In that case, the decay of magnetic susceptibility is close to the Curie law (generally speaking, the so-called high-temperature expansion is valid; see below), which is well captured by our random field method. The good coincidence between theory and experiment at
  is related to the fact that in this temperature range the strongest interaction between SS clusters is the magnetic dipole interaction, which we take into account. At
  120 K the theoretical curves decay rapidly as, most probably, SSs of smaller size come into play with stronger short-range exchange interaction between them. At lower temperatures this interaction finally overpowers the relativistic magnetic dipole interaction, giving rise to AFM order at
  K.
K.
The above means that to achieve the quantitative agreement in the entire temperature range, we need to consider the hierarchy of interactions: the short-range exchange interaction between spins in SSs along with the magnetic dipole and other relativistic interactions between SSs. The next step is to consider the vector (i.e. not Ising) spin model as well as to take into account the real symmetry of an elementary cell of the substance under consideration. Such a procedure requires extensive numerical calculations and will be published elsewhere.
We note here that the above random field method also permits us to describe the less-pronounced low-temperature AFM peak in the  . This is because for a high concentration of spins (our estimations show that for the AFM case
  so that
  ) the distribution function of random fields becomes much narrower, giving a
  -function [41], so that our random field method only yields the well-known mean field result. We stress that the μ and n values were obtained from the fit of the formulas derived to the susceptibility maxima temperatures. Note that the large concentration value in the low-temperature ordered phase simply reflects the fact that the spins contributing to the AFM phase are not clusters (in contrast to the SSs) but rather atomic Fe spins. Consideration of the above hierarchy of interactions would permit automatic switching between the concentrations of single spins and SSs, thus describing the experiment quantitatively for all temperatures.
We emphasize again that the very large SS magnetic moment in PFS is a consequence of specialities of magnetic relaxors compared to ferroelectric ones. Indeed, it is hard to imagine such a large ferroelectric reorientable cluster as it would have comparatively large activation energy. In magnets, in spite of the large size of the SS, the potential barrier can still be small (compared to ferroelectric relaxors), as these barriers are due to relativistic interactions, which are much smaller than exchange interactions. This fact also facilitates the dynamics of large SSs, whereas smaller SSs will probably either be destroyed by thermal fluctuations, or be seen at much lower temperatures like those in PFN [19].
The static,  , or quasistatic,
  , versions of our random field equation (4) permit us to describe the temperature variation of the M(H) curve. Indeed, at high temperatures, where
 , the slope of the magnetization curve M(H) is small and uniform; i.e. there is only one slope. However, at temperatures below
  , the slope near H = 0 becomes steeper. The presence of this steep part near H = 0 is actually what has been observed and depicted in the inset in figure 2(b).
4.2. High-temperature expansion
Another way to model the partial disorder in the distribution of Fe and Sb ions within the B-sublattice of the perovskite structure is to consider a periodic lattice with a large supercell having different ion distributions within it. This approach is suitable for numerical calculations, based on the n-th order expansions of the system thermodynamic characteristics (such as magnetic susceptibility and specific heat) in a small parameter proportional to the inverse temperature  , named high-temperature expansions (HTE).
Six possible types of chemical order PFB0 ... PFB5 exist for a  supercell; see figure 3 of [43]. For PFS, the ideal rock-salt structure (PFB0, see figure 6) has the minimal energy. Two other structures are close in energy: the layered PFB5 structure (alternating Fe and Sb planes), and the ferrimagnetic PFB2 structure. Here, we also consider a system with a connected sublattice of anti-site (AS) defects; i.e. an extended defect such as a stacking fault or dislocation. A
  supercell for the AS structure is shown in figure 6.

Figure 6. Upper panel: Supercells for the ideal rock-salt structure PFB0, planar PFB5 and ferrimagnetic PFB2 structures. Only B-sublattice ions Fe (empty, with arrows showing the spin direction) and Sb (filled circles) are shown. Oxygen and Pb ions (not shown) occupy mid-points of the edges and centers of cubic primitive cells, respectively. Lower panel: temperature dependence of magnetic susceptibility for several spin structures calculated as [5,5] Padé approximants of the tenth-order HTE. The second-neighbor interaction is  . 1- FCC lattice (PFB0), 2-(3-) planar PFB5 (ferrimagnetic PFB2) structures, 4- extended anti-site defect structure, AS, is shown on the right side of the figure.
Download figure:
Standard image High-resolution imageUsing the program package presented in [44] for the tenth-order HTE, we have calculated the temperature dependence of the magnetic susceptibility  for the spin-S Heisenberg models corresponding to PFB0, PFB2, PFB5, and to the doubled-in-size AS structure described in the right panel of figure 6 (
 ). The program calculates the exact coefficients of the HTE and Padé approximants (ratios of two polynomials of mth and nth order, Pm(T) and Pn(T), respectively)
 ![$\chi (T)\approx [m,n]={{P}_{m}}(T)/{{P}_{n}}(T)$](https://content.cld.iop.org/journals/1367-2630/16/11/113041/revision1/njp503556ieqn86.gif) . These approximants allow us to extend the region of validity of the HTE down to
. These approximants allow us to extend the region of validity of the HTE down to  , where Jm is the maximal exchange value in the system [44]. We take into account the nearest and next-to-nearest neighbor exchange interactions J1 and J2, and, besides this,
  (interaction between Fe ions in different planes of the PFB5 structure). The results presented in the left panel of figure 6 show the calculated temperature dependence of the magnetic susceptibility for the configurations considered above, within the approach developed in [44]. One can see that the magnetic response of the layered PFB5 structure is strongly suppressed by the large nearest-neighbor AFM interaction, but the same interaction J1 leads to the huge and even divergent magnetic response in the idealized ferrimagnetic PFB2 configuration, and the latter is also true in the extended AS structure (see also [45, 46]).
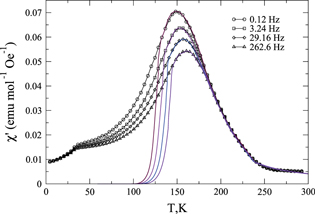
Figure 5. The fit of the high-temperature maximum of the real part of complex magnetic permittivity of PFS. Experimental data (symbols) are taken from figure 1(c). The frequencies are shown in the legend. The parameters of fit are reported in the text.
Download figure:
Standard image High-resolution imageThe ordering temperature Tfe may be found from the condition  , and we have obtained that, if
  then
then  4 and 2.5, for PBF2 and AS structures, respectively. The frustrating interaction J2 diminishes the ordering temperature of the PFB2 structure with respect to the non-frustrated value
  for
for  (see [46] for more details of this approach). Below, we estimate the exchange constants J1 and J2 from the first-principles calculations.
4.3. First-principles calculations
To study possible chemical ordering in PFS, we performed first-principles calculations in the framework of density-functional (DFT) theory [47] within the LDA+U method [48] by employing the Vienna ab initio simulation package (VASP) [49]. The on-site repulsion parameter  4 eV was employed for Fe ions (the influence of the variation of this parameter was studied earlier [43]). In the present study we use the projected augmented wave (PAW) method with four types of functionals: GGA, LDA, PBE and PBEsol, as it has been implemented in VASP [49]. Forty-ion
  supercells without any symmetry restriction and with translations in the [200], [020] and [002] directions were used. The k-grid was an automatic
  Monkhorst–Pack mesh. We used an energy cutoff at 500 eV and looked for the ground state collinear magnetic structure by energy minimization until the precision
  was achieved.
Among the possible different atomic configurations, here we consider three structures with the lowest energy, as shown in the top and right panel of figure 6). The first one has rock-salt order of antimony and iron, PFB0 (hereafter we employ the abbreviations from [43]); the second, PFB2, has a ferrimagnetic structure; and the last one, PFB5, has a planar arrangement of iron and antimony ions. Only the ferrimagnetic PFB2 structure has a non-zero ground-state total spin moment of the unit cell. The other two configurations do not possess a finite magnetic moment: configuration PFB0 has I-type AFM, and configuration PFB5 possesses G-type AFM in the iron plane.
The energies of the PFB2 and PFB5 configurations, calculated with the use of several DFT functionals, are reported in table 1, with respect to the energy of the PFB0 configuration. One can see that in PFS (in contrast to PFN [43], where the planar structure dominates) the rock-salt structure is the ground state, independently of the DFT functional form. However, in PFS, the ferrimagnetic PFB2 and planar PFB5 structures compete with each other as first, low-energy, structurally excited states. Thus, according to these results, both such chemical configurations can be observed as extended defects, like a stacking fault or a dislocation, on the background of the rock-salt structure, but this type of order cannot be the ground state of the crystal.
Table 1. Energy of different chemical configurations in PFS, in meV per five-ion-primitive cell. The energy of the rock-salt structure is taken as the origin.
| Type | GGA | LDA | PBE | PBEsol |
|---|---|---|---|---|
| I-type PFB0 | 0 | 0 | 0 | 0 |
| Ferrimagnetic PFB2 | 52 | 36 | 53 | 52 |
| Planar PFB5 | 55 | 37 | 56 | 50 |
Similar calculations have been performed for the two times larger  supercell using the PAW-LDA functional. Figure 7 presents a sketch of the configuration considered, obtained from the ground-state rock-salt PFB0 structure by swapping the nearest-neighbor Fe and Sb ions in different atomic chains directed along one of the main crystallographic axes. Below, we will call this structure an extended AS defect (figure 6). The energy of this structure, obtained with respect to the energy of the PFB0 configuration, is positive and higher than the energies given in table 1 (it equals 67 meV per five-ion primitive unit cell). Thus, the calculations performed on smaller supercells provide the excited (defect) states with smaller energies.
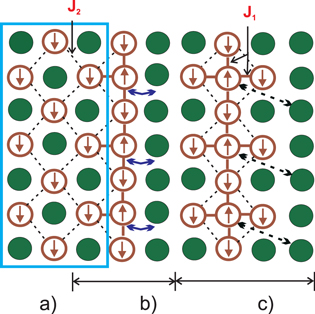
Figure 7. A sketch of the superspin origin in PFS. The light blue rectangle in (a) shows the initial atomic composition, or a two-dimensional analog of the rock-salt structure, which is a checkerboard arrangement of magnetic Fe (empty circles with arrows showing the spin direction) and non-magnetic Sb (filled circles) ions, interacting with a small second-neighbor superexchange J2 (diagonal bonds shown by thin dashed lines). The swaps of nearest neighbors in this initial arrangement (horizontal dark blue arrows in structure (b)) result in a connected structure of anti-site defects (b). The swaps of more distant Fe and Sb ions shown by the dashed diagonal arrows in structure (c) lead to the formation of PFB2-like structure (c). After a swap, new nearest-neighbor bonds (vertical and horizontal thick lines with interaction J1) appear between the defect and regular Fe ions. The interaction  rotates the surrounding spins opposite to the defect ion spin. In both cases a fragment of a ferrimagnetic structure is formed.
Download figure:
Standard image High-resolution imageWe believe that the ferrimagnetic extended defect structure of the PFB2 configuration of PFS is responsible for the unusual high-temperature magnetic relaxor properties observed in PFS. According to our experimental results, such a structure can contain a maximum of 10 000 Bohr magnetons, while the weight of these SSs was found to be rather small. This is in line with the fact that such chemical configurations do not constitute the ground state of PFS although they contribute significantly to the magnetic response.
4.4. Estimation of Heisenberg exchange constants
We show here that the magnetic structure of PFS can be successfully modeled by the Heisenberg model containing only two exchange interaction parameters: J1 is the first-nearest-neighbor and J2 is the second-to-nearest-neighbor interaction parameter [45]. In the present study, we have calculated these magnitudes for the PFB2 configuration of PFS in the framework of the full-potential local-orbital (FPLO) code [50] and by employing the atomic limit LSDA+U functional, as implemented in FPLO [51]. For that we use the experimental value [32] of the lattice parameter, a = 3.991 81 Å.
We derive the following analytical expressions (see table 2 of [45]):


where  is the total energy (per supercell) of the ferrimagnetic ground state,
  is the energy of a state that is obtained by one spin-flip of the two-fold coordinated Fe ion,
  is the energy of the ferromagnetic state and
  is the spin of the Fe3+ ion.
Our calculations give  73 K and
  13 K, for U = 6 eV.10
It is interesting that the magnitude of the J1 parameter obtained for PFS is close to the value obtained previously for PFN:
13 K, for U = 6 eV.10
It is interesting that the magnitude of the J1 parameter obtained for PFS is close to the value obtained previously for PFN:  [45]. In contrast to this fact, the second-to-nearest-neighbor interaction parameter, J2, is more affected by the type of non-magnetic cation: in PFS, it is substantially larger than in PFN (in PFN,
  [45]). This large difference might be caused by the substantially different electronic structures of Sb5+, which is not a d-metal ion, and Nb5+ cations, which are
  -metal ions.
5. Discussion
Next, we discuss specific microscopic reasons for the creation of the giant SS magnetic moments. Our first principles calculations predict the PFS ground state to be of rock salt symmetry, PFB0, while the ferrimagnetic PFB2 structure has close energy. This extended defect possesses a large magnetic moment, as illustrated in figure 7 for the simplified example of a planar structure, which can be easily extended to the realistic example of the PFB2 3D ferrimagnetic structure. Indeed, the local swaps of the magnetic and non-magnetic ions shown in figure 7 transform the initial checkerboard AFM structure into a ferrimagnetic one, without violation of stoichiometry on the scale of several lattice constants. Any finite fragment of this ferrimagnetic structure behaves like a large single SS.
As shown in [46], a fragment of a ferrimagnetic structure will behave like a single large SS at temperatures  , Tfe being the ordering temperature of the macroscopic ferrimagnetic structure. At these low temperatures, the individual Fe spins in the fragment are all aligned along the SS direction, and the value of the SS is proportional to the volume of the fragment. At intermediate temperatures
  , the individual spins fluctuate around the SS direction, and the SS value diminishes. The magnetic response of the system still exceeds the response of independent spins so that in this sense we may speak about a supermagnetism at
  . The SSs interact via long superexchange paths and via magnetic dipole–dipole interaction. These interactions result in the SS glass behavior. At high temperatures
  , the correlation between individual spins vanishes and the ordinary paramagnetic state is reached.
Note that the relaxation ability of the SSs is controlled by the energy barrier in the ferrimagnetic cluster, which has a relativistic origin. We recollect that these barriers in PFS, determined experimentally, are around 400–500 K, and these extremely large magnitudes are probably one of the specific features of the new class of materials discovered in the present study.
Let us discuss the nature of the low-temperature anomaly in the magnetic properties of PFS. As mentioned above, the main characteristic of the PFS structure is the rock-salt one, where the Fe ions form a face-centered cubic (FCC) lattice, and these Fe ions interact with each other via the exchange constant J2. A similar situation occurs in SrFe Sb
Sb O3, where the low-temperature magnetic order is of I-type [52]. Note that, according to [53], the Neel temperature in the FCC spin lattice is equal to [46]
  . The substitution of the result of first-principles calculations gives
  77 K, which is of the correct order of magnitude but about twice as large as the experimental value. The discrepancy may be related to the influence of the frustrating next-to-nearest neighbor interactions in the FCC lattice (via the Fe–O–Sb–O–Fe straight path), which is not included in our model.
We finally make a point of the possible special role of Pb ions in the enhancement of superparamagnetism in PFS. Indeed, similar to the case of other Pb-containing double perovskites (such as PbFe Nb
Nb O3 and PbFe
 Ta
Ta O3), PFS exhibits both magnetic and ferroelectric properties with sizeable remanent polarization. On the other hand, a similar system, lead-free SrFe
 Sb
Sb O3, which is also predominantly chemically ordered, shows neither ferroelectric nor superparamagnetic or magnetic relaxor properties [52]. On the basis of these data, one may conclude that PFS may be a substance with an interplay of quite unusual and interesting magnetic and ferroelectric properties which should be studied further. In particular, the ferroelectric phase transition can exert some changes in the magnetic subsystem via the modification of the magnitudes of the exchange interaction parameters between Fe3+ spins (due to the tetragonal distortions, for example). Interestingly, the SS glass transition temperature correlates well with that of the ferroelectric phase transition, but we do not know if this is a coincidence or a consequence of the coupling between the electric, structural and magnetic degrees of freedom. This question is to be clarified in the future.
6. Conclusions
In conclusion, our experimental findings show that the novel multiferroic material, PFS, prepared by high-pressure synthesis and leading to a high degree of rock-salt chemical ordering of magnetic and non-magnetic ions, realizes an unusual and novel state of single-phase magnetic matter with a hierarchy of interactions. This hierarchy means that, while the SS clusters are formed by nearest-neighbor superexchange between atomic spins, the observed outstanding collective properties, such as the frequency dispersion of magnetic susceptibility, are related to the cooperative dynamic properties of SSs, which are relatively large objects. We found that below 150 K these SSs form a glassy phase, while at higher temperatures (around 250 K), the SSs organize a new highly dynamic magnetic relaxor phase. However, we argue that below 30 K the superexchange makes the system antiferromagnetic.
It is surprising that this unusual behavior of PFS is supplemented by the high-temperature AT-type line in the H–T plot. We show that our experimental points follow the standard analytical AT-type relation [37] perfectly in an extremely wide temperature interval of 30–150 K. This unusual behavior may be a fingerprint of the ferrimagnetic relaxors and should be studied later on if other magnetic relaxors can be synthesized using the idea of our project.
We make a comprehensive analysis of our experimental findings in terms of several complimentary theoretical approaches. Namely, the physical mechanism of SS creation is considered by means of microscopic ab initio and high-temperature expansion calculations, while the collective macroscopic properties of the SS ensemble (such as the outstandingly strong frequency dispersion of the complex magnetic susceptibility) have been analyzed in terms of the mesoscopic random field approach.
One more physical message of the present paper is that the SSs exist in PFS in the paramagnetic matrix of the single-phase material, where all exchange interactions of the Fe3+ ions are AFM. Notably, such SSs are formed as local ferrimagnetic regions carrying a finite (giant) local magnetic moment. In this respect, the discovered SS magnetic relaxor phase can be considered as a perfect analog of the relaxor state in the still unusual ferroelectric relaxors, like Pb(Mg Nb
Nb )O3, where polar nanoregions are also created as local clusters with special ordering of the Mg2+ and Nb5+ ions. However, it is clear that, along with this visible proximity, there are differences owing to the fact that the electric polarization is a polar vector, while magnetization is an axial one. Even more surprising is the fact that the number of individual magnetic Fe3+ ions involved in a single magnetic SS is huge, but only such giant magnetic clusters can contribute a valuable portion into high-temperature magnetic susceptibility, contrary to the case of ferroelectric relaxors, where the typical size of the polar nanoregion is much smaller [27]. This difference suggests that the new family of materials, magnetic relaxors, might possess extraordinary properties not accessible by ferroelectric relaxors.
Acknowledgments
The authors acknowledge financial support from the GACR (project 13-11473S), North Atlantic Treaty Organization (Belgium) SFP-984735, the Russian Foundation for Basic Research (projects 12-08-00887_a, 14-02-90024 Bel_a and 14-02-90438), Belarus Republican Foundation for Basic Research (project T14R-019) and NASc of Ukraine (project 07-02-14). The authors thank A Stepanov (Universite Aix-Marseille III) for the critical reading of the manuscript.
Footnotes
- 8
The shift of the resonance field with respect to the paramagnetic one
 Oe ( is the gyromagnetic ratio of the Fe3+ ions) can be understood if we recollect that the resonance condition for Fe3+ spins depends on the internal, rather than the external magnetic field. The former field in the SS magnetic regions differs from the external one, taking place in a paramagnetic lattice, due to the non-zero local magnetization and magnetic anisotropy.
 - 9
It can be shown that employing Langevin functions for classical spins does not alter the picture qualitatively as compared to the quantum Heisenberg approach.
- 10
Note that the parameter U has different meaning in different implementations of LSDA+U approach, and that U-values may be taken differently in VASP and FPLO implementations. For FPLO we have chosen the same value that was used in reference [45].

