


Abstract
Upon temperature changes, we observe a systematic shift of creep compliance curves J(t) for single living breast epithelial cells. We use a dual-beam laser trap (optical stretcher) to induce temperature jumps within milliseconds, while simultaneously measuring the mechanical response of whole cells to optical force. The cellular mechanical response was found to differ between sudden temperature changes compared to slow, long-term changes implying adaptation of cytoskeletal structure. Interpreting optically induced cell deformation as a thermorheological experiment allows us to consistently explain data on the basis of time–temperature superposition, well known from classical polymer physics. Measured time shift factors give access to the activation energy of the viscous flow of MCF-10A breast cells, which was determined to be ≈80 kJ mol−1. The presented measurements highlight the fundamental role that temperature plays for the deformability of cellular matter. We propose thermorheology as a powerful concept to assess the inherent material properties of living cells and to investigate cell regulatory responses upon environmental changes.
Export citation and abstract BibTeX RIS

Content from this work may be used under the terms of the Creative Commons Attribution 3.0 licence. Any further distribution of this work must maintain attribution to the author(s) and the title of the work, journal citation and DOI.
1. Introduction
Temperature plays a fundamental role in rheology. Based on the empirical observation that material functions (e.g. creep compliance) show similar shapes when measured at different temperatures, the concept of time–temperature superposition (TTS) has been widely used to study the rheological behavior of polymers for about 70 years [1, 2]. Material functions recorded at different temperatures can be rescaled to overlap, resulting in a single master curve. The said curve is frequently used to extend the experimentally accessible time or frequency range, whereas the scaling factors provide an insight into underlying molecular dynamics. TTS is expected to fail when relaxation times of structurally relevant constituents show different temperature dependences or when load bearing structures are thermally unstable within the investigated temperature range. While thermorheological measurements have been successfully used to characterize synthetic polymers, biopolymer systems as found in living cells lack systematic characterization. Only for isolated subsystems in vitro a distinct temperature dependence of mechanical properties has been shown for single microtubules [3], actin filament solutions [4] and in cross-linked actin/α-actinin gels [5, 6]. Semmrich et al [4] recently found TTS to be applicable to rheological data of semidilute F-actin solutions, raising the question whether similar behavior could be found for F-actin networks or even whole living cells.
It is widely accepted that living cells obtain mechanical stability from a complex network of filamentous proteins, linkers and molecular motors, the cytoskeleton. In contrast to dead matter, the active biopolymer scaffold found in living cells inherently exhibits complex dynamics on the molecular level as cytoskeletal structures constantly assemble and disassemble [7]. Further, self-organized processes regulate the cytoskeletal meshwork temporally and spatially to account for cell function (e.g. migration or mitosis [8, 9]) or in response to environmental conditions (e.g. drug treatment or substrate stiffness [10, 11]). A vital goal of biophysical research is to understand how mechanical functionality emerges from microscopic interactions, forming mesoscale structures that equip a cell with its astonishing features. A common approach is rheological studies on living cells since the mechanical properties have been identified to be crucial for many cell functions ranging from stem cell differentiation [12] to cancer progression [13]. It is an everyday experience that material properties are temperature dependent, i.e. a value for Young's modulus or viscosity is valid only for a given temperature. Surprisingly, however, during the last 50 years only a few studies have focused on how cell rheology is affected by temperature [14–19].
In living cells, virtually all structurally important parameters such as binding rates of crosslinkers [5], molecular motor activity [20, 21] or polymerization velocity of actin filaments [22] are known to be temperature sensitive and thus temperature directly affects molecular architecture and mechanical properties. While a change in temperature will instantaneously affect the flow behavior of the cytosol and cytoskeleton (e.g. via Brownian motion), a certain delay can be expected until changed cytoskeletal dynamics (e.g. changed binding rates, gene encoding efficiency or polymerization velocities) result in altered material properties on a whole cell level. Additionally, to maintain homeostasis upon a change of environmental conditions multiple cell regulatory interventions might be triggered (e.g. expression of heat-shock or cold-shock proteins), potentially further affecting cytoskeletal structure [23]. Previous studies on cell mechanics were performed at fixed temperatures or temperature was varied on long timescales only, where delayed structural and regulatory processes inside the cell are able to contribute to observed mechanical alterations. In contrast, we utilize laser-induced heating to deposit thermal energy in living cells on a millisecond timescale. To separate prompt from delayed responses, we compare cell deformation measured immediately upon a change of temperature to deformation with sufficient time for adaptation.
To probe the response of living cells to mechanical load, we use a microfluidic optical stretcher (μOS), a laser trap that utilizes optical forces to deform single suspended cells [24, 25, 26]. Initially, we demonstrate that optical stretching actually has to be understood as a thermorheological measurement as—due to the measurement principle—force application is coupled with optical heating. Surprisingly, we find that TTS can explain the observed shift of the creep compliance curves upon sudden temperature changes. Subsequently, by slightly modifying the experimental setup, we are able to decouple optical heating from optically induced forces to verify findings from the first experiment and to investigate the reversibility of thermal effects. Finally, we demonstrate that for high temperatures as well as for temperature changes applied on long timescales not only the time axis (x-axis) but also the compliance (y-axis) has to be scaled for creating a master curve.
2. Methods and materials
2.1. Thermo-optical stretcher setup
In its standard configuration (as described in Lincoln et al [26]), the μOS is a dual-beam laser trap as shown in figure 1. A square glass capillary (80 μm inner diameter, 40 μm wall thickness, ST8508, VitroCom, USA) is mounted perpendicular to two optical fibers (colored in yellow in figure 1) which are axially aligned facing each other at a distance of 200 μm. To avoid reflection and diffraction effects, the glass capillary and the optical fibers were submersed in index matching gel.
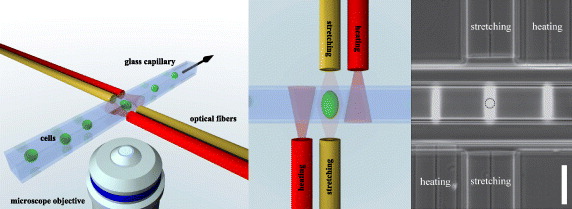
Figure 1. Modified optical stretcher setup: compared to the standard setup where a squared glass capillary is placed between two axially aligned optical fibers (yellow), forming the optical trap, the modified optical stretcher setup is extended by two heating fibers (red). Laser light, emitted from the heating fibers, does not interact with cells trapped by the standard fibers. However, by absorption of the laser light, the temperature in the measurement region can be controlled on a millisecond timescale. By applying a hydrodynamic flow in the capillary, single suspended cells can be delivered to the measurement region where cells are trapped and subsequently deformed by optical forces. Right: phase contrast image of the modified microfluidic optical stretcher setup (bar 80 μm). Bright stripes are laser light emitted by the laser fibers and scattered by small particles flowing inside the glass capillary. The dashed circle depicts the size and position of a standard cell during measurement.
Download figure:
Standard image High-resolution imageThrough the capillary, suspended cells can be transported to the trapping region where deformation is caused by optically induced surface stress σ(t) [24]. Cells, first trapped at low laser power, show creep behavior when exposed to a stepwise increased laser power Pstretch (video S1, available from stacks.iop.org/NJP/15/045026/mmedia). The relative deformation of the cell  (t) is quantified using image analysis techniques (see section 2.2). Assuming linear viscoelastic behavior, the observed deformation directly translates into a creep compliance J(t) via

Herein, the optically induced stress σ0(t) depends linearly on the applied laser power Pstretch [24, 25]. In our setup, cells were delivered out of a reservoir to the measurement region via a pressure-driven pump system connected to the capillary. The whole measurement procedure including the pump system, laser and temperature control was automatically executed by custom-made LabVIEW software (National Instruments, Austin, TX). As previously shown by several authors [27–29], optical stretching is unavoidably accompanied by a laser-induced temperature rise of cell medium and cells on a timescale of several milliseconds. Its impact on cell deformability, however, has not been investigated yet but will be clarified throughout this work.
To study temperature-dependent cell rheology on short and long timescales, we extended the standard setup by two slight modifications. Firstly, to control the temperature of the whole setup (including the cell container), we designed a custom-made aluminum sample holder, steadily flushed by temperate water from a thermostat (F10, Julabo, Germany). The thermostat was looped back by an external thermosensor positioned close to the measurement region, guaranteeing a stable setup temperature during experiments and stable temperature changes within approximately 20 min (shown in figure 6(D)). Secondly, to realize temperature jumps within a millisecond range we added two optical fibers positioned at a distance of 110 μm to the trapping region (colored in red in figure 1). When these fibers emit laser light of 1064 nm, the cell medium around the measurement region is quickly heated up, without direct exposition of trapped cells to laser light. As the expected temperature rise in the measurement region strongly depends on the distance of the laser fibers, we aimed at minimizing this distance by etching the heating laser fibers (standard HI-1060 single mode fibers) from 125 μm down to a diameter of 80 μm using hydrofluoric acid.
To calibrate the temperature rise in the measurement region for both stretch and heating laser emission, we used a temperature sensitive fluorescent dye, similar to the procedure described in [27]. In brief, as the temperature indicator we chose the fluorescent dye Rhodamine B (Sigma-Aldrich, St. Louis, Missouri), since it has high temperature sensitivity in the range of 0–120 °C [30]. To obtain temperature information for a large field of view, we used an Axioobserver.Z1 in combination with a 10 × objective (Carl Zeiss, Jena, Germany). The dye solution was prepared from Rhodamine B (0.1 mM) in carbonate buffer (20 mM), loaded into the μOS setup and calibrated by measuring the fluorescence intensity at different setup temperatures. For determining the laser-induced temperature rise inside the glass capillary, we took the average of six independent measurements performed at six different setup temperatures between 15 and 40 °C, to make sure that neither the setup temperature nor other nonlinearities of the Rhodamine B dye significantly affected our results. For the heating lasers, we measured an increase of temperature of ΔTh = 7 °C W−1 (per fiber) in the measurement region and for the stretch lasers an increase of ΔTs = 26 °C W−1 (per fiber) (figure 2). Note that all values of laser powers presented throughout the paper are reported per fiber of either stretch or heat laser pair.
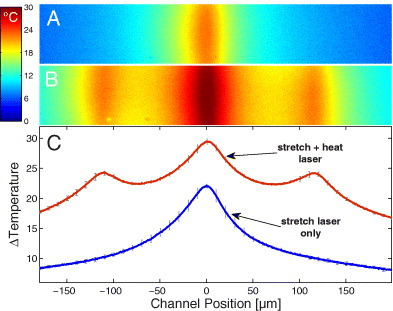
Figure 2. Spatial temperature distribution in the capillary of the modified optical stretcher. (A) Color-coded temperature distribution in the microfluidic channel for a stretch laser emission of 800 mW per fiber and no heating laser emission. (B) Temperature distribution during a stretch laser emission of 800 mW and a heating laser emission of 1000 mW (both per fiber). (C) Line average of the measured distributions of panels (A) (lower curve) and (B) (upper curve). When heat lasers are activated the temperature in the trapping region increases by ∼7 K W−1 of heating laser power in each fiber (channel position = 0).
Download figure:
Standard image High-resolution image2.2. Image and data processing
The extraction of quantitative values from single-cell experiments comprises the digital processing of image stacks, recorded at 30 frames per second by video phase contrast microscopy. An edge detection algorithm, as proposed by Lincoln et al [26], was implemented in MATLAB (The Mathworks, USA), detecting the outer edge of every measured cell with subpixel accuracy. Subsequently, we applied a shape-tracking algorithm on obtained contour data to minimize the influence of small rotations around the optical axis of the microscope. The rotation corrected data were then used to determine the deformation along the laser beam. In supplementary video S1 (available from stacks.iop.org/NJP/15/045026/mmedia), an image sequence recorded during a stretch experiment is shown, together with the applied laser pattern and the detected cell deformation. To demonstrate the working principle of the rotation correction, a cell showing a clear rotation is presented in video S1. Our shape-tracking algorithm is able to account for cells showing small rotations around the optical axis of the microscope (see the green bar in video S1). However, rotations around any other axis (e.g. the axis of the laser beam) principally hinder accurate detection of the optically induced deformation, thus those cells were excluded from further evaluation. The cell deformations were quantified in terms of relative deformation, calculated as (t) = (L∥(t) − L∥(0))/L∥(0), where (t) is the relative deformation, L∥(t) is the measured length of the cell along the laser axis at time t and L∥(0) is the length of the cell before starting the stretch experiment.
2.3. Time–temperature superposition and activation energy
Phenomenologically motivated and supported by basic polymer models (Rouse, Zimm, William, Landel, Ferry), the influence of temperature on the rheology of a broad class of polymers can be described by TTS, for creep experiments given by

Creep compliance curves Ji measured at an arbitrary temperature Ti can be shifted to overlap with a measurement J taken at a reference temperature Tref by scaling time with a time shift factor aTi and the whole creep function by a modulus shift factor bTi [31]. For simple, thermally stable polymeric systems, bTi is expected to be not or only slightly temperature dependent, while the influence of temperature is mainly expressed by a rescaling of the time axis via aTi. In the literature therefore, materials following equation (2) are often called thermorheologically simple if all Ji(t) superimpose just by applying a temperature-dependent time shift factor aTi [32].
Considering viscous flow as a thermally activated process, the temperature dependence of aTi is of special interest to polymer physics as it provides information on the activation energy of molecular movement [32]. In the simplest case, aTi shows an Arrhenius dependency [31]

where EA is the (constant) activation energy and R is the universal gas constant. However, for glassy materials (which cells are frequently speculated to be [33–35]) in the vicinity of the glass transition temperature Tg, aTi is normally observed to not obey Arrhenius behavior as activation energy becomes a function of temperature [31, 32]. Then, the temperature dependence of aTi above Tg is often successfully described by the William–Landel–Ferry (WLF) equation

where C1 and C2 are empirical factors [2].
We implemented a custom-made algorithm to construct a master curve from mean creep compliance curves, measured at different temperatures. After selecting a reference curve, all the other curves were scaled according to equation (2), while scaling factors aTi and bTi were systematically varied to minimize the error of the overlap. To account for the stochastic nature of cell-rheological data, the procedure was repeated for various binning values, reference temperatures and random subsets of cells to construct the mean curves while the reported values for aTi, bTi and EA (equation (3)) were found to be restored in most cases. Due to the lack of a clear curvature in the data when plotting aTi over Teff (e.g. in figure 7(A)), fitting values for equation (4) (the WLF equation) were found to be sensitive to statistical variation. However, the ratio between the constants C2 and C1 was widely conserved and found to be close to a value of 10.
2.4. Cell preparation
MCF-10A cells (CRL-10317), a non-tumorigenic epithelial cell line, were obtained from American Type Culture Collection (ATCC, Manassas, VA). MCF-10A were maintained in a 1:1 mixture of Dulbecco's modified Eagle's medium and Ham's F12 medium, supplemented with 5% horse serum, 20 ng ml−1 epidermal growth factor, 10 μg ml−1 insulin, 100 ng ml−1 cholera toxin, 500 ng ml−1 hydrocortisone and 100 U ml−1 penicillin/streptomycin. Prior to measurements, cells cultured in 25 cm2 flasks were detached by application of 1 ml 0.025% trypsin–EDTA solution, resuspended in 3 ml of culture medium and centrifuged at 100g for 4 min. Finally, single cells were resuspended in culture medium to a concentration of about 5 × 10⁵ cells ml−1 and loaded into the μOS.
3. Results
3.1. Optical stretching is a thermorheological experiment
In the μOS (and in any other optical trap) a higher laser power produces higher optical forces, while—due to light absorption in aqueous medium—simultaneously raising the temperature in the trapping region. When assuming small deformations ((t)∝σ0), then creep compliance J(t) is independent of the applied force (equation (1)). Consequently, instantaneous effects of temperature changes on optically induced cell deformability can be investigated experimentally by comparing creep compliance curves, obtained for different stretch laser powers.
In a standard μOS setup, creep experiments were sequentially performed on single cells with a random stretch laser power Pstretch for each experiment (figure 3(C)). This ensures that the final average curves for different laser powers (figure 3(A)) comprise cells that were measured at various time points of the whole experiment. Hence, possible long-term dependences of cell deformability, for example as reported in [33], should cancel out.
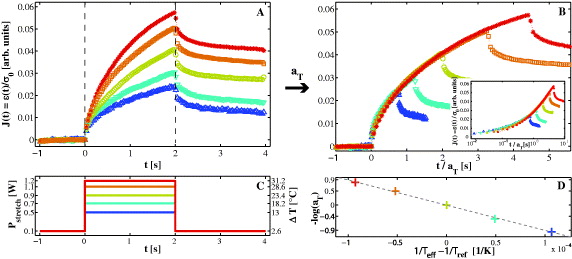
Figure 3. At a setup temperature of Tsetup = 15 °C, creep curves of living cells were sequentially probed with varying peak values for the stretch laser power Pstretch. (A) Mean creep curves J(t) of 137 cells, binned by applied stretch laser power. (B) Same creep compliance curves as shown in (A), individually scaled with a time shift factor aTi to overlap with the measurement at Tref = 38.4 °C (green circles). (C) Applied stretch patterns, randomly chosen for each individual cell. (D) Arrhenius plot of time shift factors aTi. The gray dashed line represents a fit of equation (3) to the data. For scaling factors and visualization of shifting see table A.1 and video S2 (available from stacks.iop.org/NJP/15/045026/mmedia).
Download figure:
Standard image High-resolution imageIn figure 3(A), average creep curves of 137 cells are displayed, binned by applied laser power Pstretch. Creep curves for different stresses (σ0∝Pstretch) do not overlap as would be expected for a temperature-independent viscoelastic linear material, but rather show significant bigger compliance for higher laser powers. We state that the apparent drop of stiffness as seen in figure 3(A) is caused by laser-induced heating during the step stress experiment. This hypothesis is supported by the observation that creep compliance curves for different laser powers overlap surprisingly well by scaling exclusively with aTi (figure 3(B)).
In this experiment, each laser power Pstretch can be translated to an effective temperature Teff via Teff = Tsetup + PstretchΔTs, including the setup temperature Tsetup (constantly held at 15 °C throughout the whole measurement) and a laser-induced heating of ΔTs = 26 °C W−1 determined by calibration (see section 2.1). The time shift factors aTi used in figure 3(B) to scale the creep curves are plotted in figure 3(D) in an Arrhenius plot.
Hitherto no appropriate value for the activation energy EA or the glass transition temperature Tg has been proposed for whole living cells. From our experimental data it cannot be decided whether the observed dependency displayed in figure 3(D) follows Arrhenius behavior (equation (3)) or rather represents a flat version of the WLF equation (equation (4)). When assuming Arrhenius behavior, the activation energy for the viscous flow of living suspended MCF-10A cells turns out to be EA ≈ 74 kJ mol−1. In contrast, the equivalent activation energy of pure water at T = 37 °C is much lower with EwaterA ≈ 17 kJ mol−1 [36]. Thus, it is unlikely that we measure the temperature dependence of the free surrounding aqueous medium only. It would be interesting to compare EA to values for the activation energy of reconstituted cell bio-polymers; however, to our knowledge there are no such values available in the literature up to now. Values of standard polymer melts like polystyrene are unintuitive as comparison since they are measured at temperatures of hundreds of celsius (e.g. polystyrene EA = 59 kJ mol−1 [37]). Due to the aforementioned coupling of heat and force in the optical stretcher, we had to make an assumption on how the creep compliance scales with the applied force, i.e. we assumed the simplest case of linear viscoelasticity. However, it is important to note that we do not state that cellular material is fully linear viscoelastic but rather that laser-induced heating can mostly explain the apparent increase of compliance for higher laser powers, shown in figure 3(A). In the next section, we modify our experimental setup rendering the need for assuming linear behavior superfluous.
3.2. Temperature instantaneously affects cell deformability
The observed systematic shift of J(t) (figure 3(A)) can be explained as temperature induced but could also arise from a nonlinear response to applied stress, e.g. shear thinning. In order to exclude nonlinear viscoelastic effects, it is necessary to measure cells with the same stress σ0(t) but at different temperatures Teff.
To realize an experiment where the applied stress can be kept constant while temperature changes can be independently applied on a short timescale, we further exploit the effect of laser-induced heating. We designed a modified μOS setup, extended by two optical fibers (colored in red in figure 1), further denoted as heating fibers. By laser emission of the heating fibers, trapped cells can be heated on a millisecond timescale without being directly illuminated. The applied stress σ0, exclusively determined by emission of the stretch fibers, however can be kept constant. Hence, heat generation and force application are partially decoupled in the modified μOS setup.
We measured cells with a fixed stretch laser power of Pstretch = 700 mW per fiber (figure 4(A)). One second before the stretch started, we activated the heating laser to randomly emit a power of Pheat between 0 and 1700 mW per fiber, causing a sudden change of temperature in the measurement region (figure 4(B)). Similar to the situation above, an effective temperature can be calculated for each single experiment via Teff = Tsetup + PstretchΔTs + PheatΔTh, including the temperature rise caused by emission of the heating fibers. A calibration measurement (figure 2) revealed a local temperature increase of ΔTh ≈ 7 °C W−1 (per fiber) in the measurement region (see methods and figure 2).

Figure 4. At a setup temperature of Tsetup = 18.4 °C, 207 cells were stretched with the same stretch laser pattern Pstretch shown in (A). (B) For each single cell, a random heating laser pattern Pheat was chosen, leading to an instantaneous increase of temperature ΔT in the measurement region. (C) Mean creep curves J(t), binned by applied heat laser power and scaled by aTi to overlap. The optically induced stress was the same for all measured cells, while the individual temperature Teff differed for each stretch experiment (inset: Arrhenius plot of time shift factors aTi. The gray dashed line represents a fit of equation (3) to the data). For scaling factors and visualization of shifting see table A.2 and video S3 (available from stacks.iop.org/NJP/15/045026/mmedia).
Download figure:
Standard image High-resolution imageCreep compliance curves of cells do not overlap when measured with the same stress σ0(t) but different heating laser values Pheat. This confirms our hypothesis that cell deformability is strongly temperature dependent as effects of different forces can now be excluded. In figure 4(C), we demonstrate that measured curves again superimpose by only varying time shift factors aTi while bTi can be set to a constant value. Similar to the experiment with different stretch laser powers (figure 3), cells exhibit thermorheologically simple behavior. Fitting equation (3) (Arrhenius) leads to an activation energy of EA ≈ 75 kJ mol−1, a similar value as measured before in section 3.1.
With this experiment, we can reasonably argue that temperature instantaneously affects the deformability of single suspended cells. As nonlinear viscoelastic effects can now be excluded, laser-induced heating is identified as the dominant factor, responsible for the apparent drop of stiffness with increasing stretch laser power (figure 3(A)).
3.3. Reversibility
A necessary prerequisite for the applicability of TTS is the reversibility of temperature effects. As shown in the measurements above, creep rates were increased when temperature was raised. Consequently, a reduction of temperature should lead to a reduction of creep rates. At a setup temperature of Tsetup = 23 °C, cells were measured with a constant stretch laser power Pstretch = 600 mW per fiber for 6 s (figure 5(A)). Within these 6 s, we activated the heat lasers for 2 s, emitting a random power Pheat between 0 and 1500 mW per fiber (figure 5(B)).

Figure 5. Temperature variation during the stretch experiments. (A) At a setup temperature of 23 °C, 843 cells were measured for 6 s with a constant stretch power of 600 mW per fiber. (B) During the stretch at t = 2 s, the heat lasers were activated for 2 s with a randomly chosen Pheat, causing a temperature increase of ΔT of the probed cell. (C) Mean creep compliance J(t), binned by the applied heating laser power Pheat. The higher the temperature increase, the higher the increase in deformation rate at t = 2 s. After deactivation of the heat laser at t = 4 s, deformation rates are reduced again.
Download figure:
Standard image High-resolution imageFigure 5(C) shows creep compliance curves for 843 cells, binned by applied heat laser power Pheat. At t = 2 s, creep rates instantaneously increase upon activation of heat lasers. At t = 4 s, heat lasers are switched off and creep rates return back to baseline levels, comparable to cells where no temperature rise has been applied.
This experiment demonstrates that creep rates directly depend on temperature. However, as living cells are active systems and thermally fragile it is clear that reversibility and TTS can only be valid within certain limits. The applicability of TTS naturally cannot be expected a priori for timescales where regulatory processes actively alter the cytoskeleton as well as for temperatures where the structure of load-bearing proteins is irreversibly altered.
3.4. Triggering thermorheological complexity
In previous sections, Tsetup was kept constant while—using laser-induced heating—sudden effects of temperature changes were studied. To assess how cellular material changes with temperature over a longer period, we performed creep experiments at different setup temperatures Tsetup, such that cells had several minutes and hours to adapt to the new ambient temperature before being optically trapped and deformed.
In the beginning, the setup temperature was set to 37 °C and ≈200 cells were measured within approximately 3 h. Subsequently, the setup was cooled down to 25 and 15 °C where measurements were repeated with approximately the same amount of cells and the same range of stretch laser power Pstretch, randomly chosen between 600 and 1300 mW per fiber (figure 6(C)/(D)). Each cooling step required about 20–25 min until the whole setup was thermally equilibrated (gray points in figure 6(D)). Cells measured during temperature transition were excluded from further evaluation.
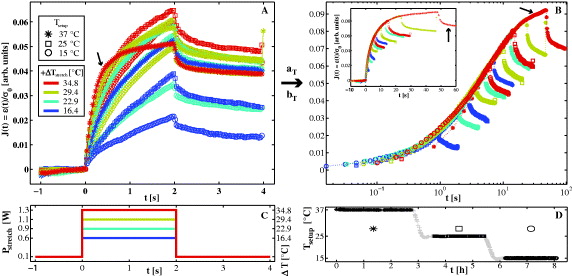
Figure 6. Long-term effects of temperature. (A) Mean creep curves J(t), binned by applied stretch laser power and setup temperature (B) scaled by aTi and bTi to overlap (inset: linear representation). To illustrate the scaling procedure the creep curve for the cells at the highest temperature is marked with an arrow. For a more detailed visualization of shifting see video S4 (available from stacks.iop.org/NJP/15/045026/mmedia). (C) Applied stretch laser pattern Pstretch, randomly chosen for each cell. (D) At three different setup temperatures Tsetup ( : 37 °C; □: 25 °C;
  : 15 °C), cells were measured over a time course of 8 h. Cells measured during cooling (gray crosses) were excluded from evaluation.
Download figure:
Standard image High-resolution imageIn figures 6(A) and (B), we demonstrate that the creep curves can be scaled according to equation (2) to overlap in a single master curve. Used time shift factors aTi and modulus shift factors bTi are plotted in figure 7 and listed in table A.3: in contrast to the previous experiments, the modulus shift factor bTi can no longer be kept constant. Creep curves obtained at Tsetup = 15 °C still behave thermorheologically simple, as the corresponding values for bTi are equal for all stretch laser powers Pstretch (marked as circles in figures 6 and 7). However, curves obtained at Tsetup = 25° have to be rescaled by a different value for bTi to superpose with the measurements at 15 °C. The same holds true for measurements carried out at Tsetup = 37 °C. Despite the fact that several creep curves were obtained at the same effective temperature Teff, a different value for bTi is required to make curves superpose when the setup temperature Tsetup was changed in between. Apparently, the occurrence of thermorheological complexity is associated with the fact that cells had time to adapt to the changed setup temperature. For the same Teff, cells appear stiffer when measured at higher Tsetup.
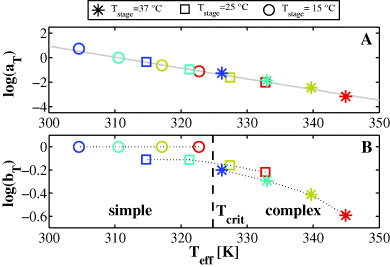
Figure 7. Scaling factors aTi and bTi used in figure 6 ( : 37 °C; □: 25 °C;
  : 15 °C). (A) Plot of time shift factors aTi over effective temperature Teff. The gray dashed line represents a fit of equation (3) to the data (EA = 79 kJ mol−1). (B) Modulus shift factors bTi over Teff. Upon a change of the setup temperature Tsetup (duration ⩾ 20 min) or for Teff > Tcrit, the value for bTi can no longer be kept constant, but must be adjusted for sufficient overlapping of J(t). For the same Teff, cells are stiffer when stored at higher Tsetup. For scaling factors, see table A.3. Colors indicate different stretch laserpowers (compare to figure 6C).
Download figure:
Standard image High-resolution image
As shown in figure 7(B), thermorheologically complex behavior generally occurs for all creep curves measured at effective temperatures Teff higher than a critical temperature Tcrit ≈ 52 °C: a non-constant modulus shift factor bTi is necessary for sufficient superposition of curves, regardless of whether Tsetup was changed in between or not. On long timescales, we proposed cellular adaptation to explain the occurrence of thermorheological complexity. On short timescales, thermal fragility of load bearing structures in the cell appears to be a more plausible explanation for the variation of bTi for Teff > Tcrit.
4. Discussion
We propose TTS (equation (2)), a widely used concept in polymer physics, as the leading term to rationalize the observed temperature dependence of the creep compliance J(t) of cells: for sudden temperature changes that do not exceed a critical temperature Tcrit, we observe thermorheologically simple behavior, meaning that J(t,T) superpose by only scaling with a time shift factor aTi. However, temperature changes on timescales of several minutes and hours or above Tcrit demand for additional scaling with a modulus shift factor bTi.
Considering the complex dynamics of myriads of biochemically and physically diverse constituents, the extension of scaling concepts derived from rather simple synthetic polymers to the rheology of whole living cells is a remarkable and unexpected feature. A major assumption, often denoted as necessary for the applicability of TTS, is that relaxation times of all load-bearing structures exhibit the same temperature dependence [31]. This appears to be rather unlikely seeing that the cytosol comprises an incredible number of structurally different proteins that potentially contribute to the observed deformation upon mechanical load. A possible explanation for the apparent thermal homogeneity of a cell's compound material could be given by the fact that the cytoskeletal network is a tightly crosslinked structure. From miscible polymer blends, it is known that the presence of strong bonding can lead to a coupling of the dynamic responses of the component chains such that dynamic homogeneity and the successful application of TTS would be restored [38]. In turn, this would mean that cytoskeletal drugs targeting the coupling of load bearing structures in the cell should be able to destroy the dynamic coupling. Further, cell types with inherently lower connectivity of cytoskeletal components should violate TTS, as individual relaxation times of load bearing structures and processes must be assumed to depend differently on temperature. The observed simple TTS dependency could be also explained by postulating that optical cell stretching is mainly governed by a single thermally activated process that dominates cellular response. With respect to the often reported glassy character of cellular matter [33–35], one could speculate, for example, about a glass transition of one of the compounds, e.g. the cytosol, dominating the observed cell response by stretching the time scale and thus creating the apparent dynamic homogeneity. Similar to classic polymers, thermorheological measurements on living cells could be a promising approach to discern the role of different compounds and to investigate changes of the cytoskeletal structure.
In the framework of TTS, the time shift factor aTi accounts for the inherent acceleration of molecular dynamics at higher temperatures. For a viscoelastic material, aTi can be associated with a change of the viscosity, while the modulus shift factor bTi accounts for changes of the elastic part of the material [32]. The apparent need for a non-constant bTi or general poor overlapping of shifted curves (thermorheological complexity) can be linked to structural changes on a molecular level [39]. In our measurements, when temperature is changed on short timescales we observe a monotonic decrease of the modulus shift factor bTi only for temperatures higher than Tcrit (figure 7(B)). Below Tcrit, bTi can be set to a constant, meaning that the impact of a rapid temperature change is solely captured by the time shift factor aTi. Thus, our data imply that temperature variations on short timescales mainly affect the viscous part of the viscoelastic cell material, i.e. cells are more fluid at higher temperatures. Rapid temperature changes above Tcrit, however, demand for additional scaling by bTi to achieve overlap of measured curves. It is conceivable that above a threshold temperature structurally important macromolecules significantly alter or even denature as biopolymers in living cells can reasonably be denoted as thermally fragile. We propose that those alterations on a molecular level directly impact creep behavior on a whole cell level, reflected in non-constant values for bTi above Tcrit. Indicated by studies on hyperthermia, where a critical temperature is a function of heating time and temperature history [40, 41], it is likely that our reported Tcrit is valid for the heating time in our experiments only and might change e.g. for longer exposure to elevated temperature.
In the case where cells have sufficient time for adaptation to ambient temperature, we expect slower self-regulated processes such as delayed structural responses [42] or active cell regulation to contribute to alterations of load bearing structures on a whole cell level. We find that temperature changes on long timescales affect both the elastic as well as the viscous part of the viscoelastic cell material. When Tsetup is slowly increased, the modulus shift factor bTi decreases, meaning that cells appear more elastic (i.e. bigger Young's modulus) when stored at higher setup temperatures (figure 7(B)). For the viscous part, again we find that cells continuously become more fluid at higher temperatures regardless of whether temperature changes were applied rapidly or on a long timescale (figure 7(A)).
These counter-acting effects—increase of elasticity and drop of viscosity—are qualitatively in accordance with a recent study [18], where oscillatory atomic force microscopic (AFM) measurements were used to measure storage (G') and loss modulus (G'') of adhered human alveolar epithelial cells. Sunyer et al [18] report a drop of viscosity for a long-term temperature increase of untreated cells (see tables 1 and 2 in [18]). Simultaneously, an increase of elasticity was observed, which was associated with increased activity of myosin motors and thereby generated prestress via traction force microscopy. We therefore assume that molecular-motor generated prestress, but also delayed physical responses, for example arising from a new adjustment of the chemical equilibrium of weak bonds in the cytoskeleton [42], could contribute to the observed variations of bTi below Tcrit for slow temperature changes.
Our observed increase of elasticity for higher setup temperature appears at first glance to be contrary to recently published measurements using force–indentation AFM-measurements. Rico et al [19] report cell softening with increasing temperature on barely attached, monocytic cells with spherical geometry. We note that force–indentation measurements by nature do not directly provide access to G' and G'', but determine the Young's modulus via indentation depth at constant force [19], while a drastic drop of viscosity (such as observed for detached cells in our measurements) can easily overlay a possible increase of elasticity. Also in our measurements cells are more deformable at higher temperatures and could thus be denoted as softer. However, analysis of our measurements in terms of TTS suggests that increased deformability is rather due to a drop of viscosity than to a drop of elasticity. This illustrates a great advantage of thermorheological analysis of complex materials as insights can be gained independently of a viscoelastic model, i.e. without making any assumptions about the explicit functional form of the creep compliance. Since we observe identical behavior for aTi for slow and rapid temperature variations (figure 7(A)), we can assume that the temperature-induced decrease of viscosity is an inherent property of the cell material, while an increase of elasticity appears to be more cell-regulated as it only emerges when cells were allowed to adjust to a new temperature.
It has to be noted that superposition of J(t) does not automatically imply superposition for other, frequency-dependent material functions [43]. Thus, it would be interesting to know whether TTS is also valid for frequency-dependent thermorhelogical measurements on living cells. Those could be realized, for example, by combining laser-induced heating and AFM where oscillatory measurements could be performed while simultaneously switching the temperature. According to TTS, the frequency-dependent response should be shifted instantaneously upon temperature change, while a change in the shape of the relaxation spectrum would arise from different temperature dependences of the components.
While temperature jumps investigated in this study might be considered as out of the typical physiological range, we believe that systematic thermorheological studies can contribute to a better understanding of cells as a living compound material. As a simple estimate the change of the compound shear viscosity η of cells can be derived from the Rouse model as aTi∝η(Ti)/η(Tref) to be of the order of 10% per kelvin around 37 °C. A change in viscosity has direct impacts on cell physics, which is dominated by Brownian motion and activated processes [42]. By directly affecting an important transport mechanism, a changed diffusivity for example can be expected to have an unspecific impact on various cell functions and could play a role in various temperature-sensitive biological functions, ranging from gene expression [44] or cell shape oscillation of cultured cells [45], protein folding [46] and mitosis [47], even up to the temperature-dependent sex determination observed in several species [48, 49].
The presented experiments were performed in a μOS in which—due to the measurement principle—optical force and optically induced heating are inherently coupled. As a simplification, we assumed an instant temperature increase upon a rise of laser power. However, during optical stretching, temperature is a function of time where at the beginning of the step stress, temperature rises steeply [27]. As demonstrated here, temperature instantaneously affects cell deformability such that a significant temperature rise during the first milliseconds of the step-stress experiment is reflected in the observed creep function. Optical stretcher experiments, therefore, actually cannot be treated as isothermal experiments, which has several implications for their interpretation. Firstly, this could explain why results from optical stretcher measurements were reported to deviate from results obtained with other cell rheological techniques where power law behavior (J(t) = Ata) is widely observed [33, 50]. Secondly, Maloney et al [33] recently proposed an offset power law J(t) = Ata + B (for fitting creep curves obtained in a μOS) with an offset parameter B which has not been reported by other groups. The initial rise of temperature during the measurement can naturally explain the necessity for the additional constant B, particularly with regard to the observation that B was found to be ⩽0. Also, the reported discrepancy between cell deformation upon stretching and recovery after stress release [33] can be explained, as laser power, and therefore temperature, is lowered during creep relaxation.
We demonstrated the concept of TTS for living cells, using MCF-10A breast epithelial cells as a model system. We propose thermorheology as a powerful concept for cell-rheological studies, especially since no assumptions about the explicit functional form of the observed material function are necessary. Our measurements demonstrate that the mechanical response of cellular material strongly depends on temperature and differs between temperature changes on long and short timescales. This insight could be important for other studies on cells and cell mechanics, especially for methods based on optical force application.
Acknowledgments
We thank Klaus Kroy for helpful discussions and Steve Pawlizak and Tina Händler for help with 3D rendering. Financial support was provided by the Deutsche Forschungsgemeinschaft within the Graduate School BuildMoNa, the European structural funds ESF and the Sächsiche Aufbau Bank SAB.
Appendix
A.1. Data tables
In tables A.1–A.3, the row with italic values were used as a reference curve for TTS and is the one closest to 37 °C.
Table A.1. Corresponding to figure 3. Arrhenius fit: EA = 74.3 kJ mol−1; WLF fit: C1 = 14.26, C2 = 154.34, C2/C1 = 10.82.
| Pstretch (W) | Tsetup (°C) | Teff (°C) | aT | bT |
|---|---|---|---|---|
| 0.52 | 15 | 28.31 | 2.593 | 1 |
| 0.72 | 15 | 33.62 | 1.634 | 1 |
| 0.90 | 15 | 38.32 | 1.000 | 1 |
| 1.09 | 15 | 43.42 | 0.611 | 1 |
| 1.26 | 15 | 47.57 | 0.449 | 1 |
Table A.2. Corresponding to figure 4. Arrhenius fit: EA = 75.2 kJ mol−1; WLF fit: C1 = 8.31, C2 = 81.16, C2/C1 = 9.77.
| Pstretch (W) | Pheat (W) | Tsetup (°C) | Teff (°C) | aT | bT |
|---|---|---|---|---|---|
| 0.7 | 0.13 | 18.4 | 37.50 | 1.000 | 1 |
| 0.7 | 0.46 | 18.4 | 39.80 | 0.773 | 1 |
| 0.7 | 0.87 | 18.4 | 42.72 | 0.601 | 1 |
| 0.7 | 1.31 | 18.4 | 45.77 | 0.459 | 1 |
| 0.7 | 1.68 | 18.4 | 48.37 | 0.369 | 1 |
Table A.3. Corresponding to figure 6. Arrhenius fit: EA = 79.8 kJ mol−1; WLF fit: C1 = 153.42, C2 = 1711.48, C2/C1 = 11.16.
| Pstretch (W) | Tsetup (°C) | Teff (°C) | aT | bT |
|---|---|---|---|---|
| 0.63 | 15 | 31.41 | 2.106 | 1 |
| 0.88 | 15 | 37.41 | 1.000 | 1 |
| 1.13 | 15 | 43.97 | 0.535 | 1 |
| 1.33 | 15 | 49.59 | 0.327 | 1 |
| 0.63 | 25 | 41.59 | 0.703 | 0.895 |
| 0.88 | 25 | 48.14 | 0.342 | 0.895 |
| 1.13 | 25 | 54.28 | 0.198 | 0.852 |
| 1.33 | 25 | 59.61 | 0.133 | 0.803 |
| 0.63 | 37 | 53.02 | 0.282 | 0.817 |
| 0.88 | 37 | 59.84 | 0.155 | 0.744 |
| 1.13 | 37 | 66.55 | 0.085 | 0.662 |
| 1.33 | 37 | 71.79 | 0.041 | 0.553 |