


Abstract
Multi-dimensional spectroscopies with vacuum ultraviolet (VUV)/x-ray free-electron laser (FEL) sources would open up unique capabilities for dynamic studies of matter at the femtosecond–nanometer time–length scales. Using sequences of ultrafast VUV/x-ray pulses tuned to electron transitions enables element-specific studies of charge and energy flow between constituent atoms, which embody the very essence of chemistry and condensed matter physics. A remarkable step forward towards this goal would be achieved by extending the four wave mixing (FWM) approach at VUV/soft x-ray wavelengths, thanks to the use of fully coherent sources, such as seeded FELs. Here, we demonstrate the feasibility of VUV/soft x-ray FWM at Fermi@Elettra and we discuss its applicability to probe ultrafast intramolecular dynamics, charge injection processes involving metal oxides and electron correlation and magnetism in solid materials. The main advantage in using VUV/soft x-ray wavelengths is in adding element-sensitivity to FWM methods by exploiting the core resonances of selected atoms in the sample.
Export citation and abstract BibTeX RIS

Content from this work may be used under the terms of the Creative Commons Attribution 3.0 licence. Any further distribution of this work must maintain attribution to the author(s) and the title of the work, journal citation and DOI.
GENERAL SCIENTIFIC SUMMARY Introduction and background. Ultrafast non-linear spectroscopy based on the four-wave-mixing (FWM) process is currently used in the optical domain for a vast array of cutting-edge applications, ranging, e.g., from the determination of molecular wavefunctions during chemical reactions to quantum communications. However, the optical wavelengths hinder an atomic spatial resolution and selectivity, which would instead be achieved by exploiting XUV/x-ray photons.
Main results. We report on a prospective study aimed at evaluating the feasibility and scientific applications of XUV/soft x-ray four-wave-mixing based methods. We discuss the development of the FERMI free-electron-laser source in order to obtain a three-colour few-fs emission with the independent control of central wavelength and polarization of the three pulses. We evaluate a possible optical transport system to focus the three pulses at the sample position fulfilling the geometrical constraints inherent to the four-wave-mixing process and, finally, we estimate the amount of the expected non-linear signal. As a result, we conclude that the method is feasible in the photon energy range (30–300 eV) accessed by the FERMI source.
Wider implications. The possibility to exploit the four-wave-mixing process in the XUV/soft x-ray range would add fs-nm time-space resolution and elemental selectivity (through the exploitation of core resonances) to FWM methods. This will enable, for instance, to follow charge and energy transfer processes between constituent elements in molecules. These capabilities can have relevant implications, e.g., for the study of dye-sensitized-solar-cells and biomimic systems.
1. Introduction
The scientific interest in pushing the knowledge of dynamics towards shorter and shorter times and length-scales in chemistry, physics and biology draws on more than a century of comprehension. Femtochemistry [1] is a neologism currently used to describe a vast array of the recent theoretical and experimental activities aimed at investigating matter in the femtosecond (fs) time domain.
More generally, a thorough understanding of the physical and (bio-)chemical dynamical processes requires pushing the spectroscopic probes down to the nanometer–femtosecond space–time resolution. Such an experimental tool would help understanding processes in matter, which will undoubtedly impact the development of future technologies. However, the experimental control and theoretical understanding of processes on such scales is not yet fully possible, due to the limitations of existing experimental methodologies and the lack of comprehensive theoretical and modeling frameworks.
Femtosecond table-top lasers have allowed the development of linear and nonlinear optical methods aimed at probing fast dynamics in real-time. Among the nonlinear approaches [2], the broad variety of four wave mixing (FWM) spectroscopies deliver important information on dynamical processes in a large variety of systems and timescales, ranging, e.g. from sub-picosecond determination of the wavefunction's evolution in chemical reactions [3] to microsecond dynamics of complex bio-systems [4]. FWM capabilities are also exploited in innovative cutting-edge technologies, such as silicon photonics [5], quantum communications [6] or high resolution imaging [7]. Though FWM has substantially contributed to the understanding of a large number of phenomena, the optical wavelengths of table-top lasers (> 250 nm) imposes constraints for accessing the nanometer spatial resolution typical of ultrafast molecular dynamics. Furthermore, the low photon energy (a few eV's) does not allow element-specificity. For these reasons, the past 10–15 years have witnessed the development of (linear) ultrafast optical pump/x-ray probe methods, such as vacuum ultraviolet (VUV) photoelectron spectroscopy [8], x-ray absorption [9] and emission spectroscopy [10], which allow probing the electronic and structural changes in a variety of systems. These techniques are analogues of linear pump–probe methods in the optical domain, but with the advantage of being element-specific. In contrast, nonlinear interactions of VUV/x-rays photons with matter is an almost unexplored area of physics, since at shorter wavelengths nonlinear effects are significantly weaker than in the visible regime and bright enough sources in this spectral range were not available until recently.
Novel and far-reaching opportunities in ultrafast dynamics are being offered by the emerging free-electron lasers (FELs), whose ultra-short/ultra-intense short-wavelength pulses can result in appreciable or even dominating nonlinear interactions with the sample, thus delivering entirely new insight into the phenomena under study. For instance, x-ray pulses delivered by the Linac coherent light source (see https://portal.slac.stanford.edu/sites/lcls_public/Pages/Default.aspx/) were recently used in combination with an IR laser to demonstrate a coherent nonlinear response (namely sum-frequency generation) of diamond at x-ray wavelengths [11]. This pioneering nonlinear experiment was carried out with the assistance of an optical laser; while in the near future, advanced schemes for multi-pulse, multi-color FEL emission can be profitably exploited in nonlinear wave mixing applications [12–15]. Another class of short wavelength ultrafast coherent radiation sources is represented by high-harmonic generation (HHG) devices [16], which are able to provide photon pulses shorter than 1 fs in the 100's of eV photon energy range. Although HHG is presently limited in the maximum energy per pulse, future developments of these sources may enable pulse energies sufficiently large enough for nonlinear applications. In this context, the FERMI@Elettra seeded FEL, recently constructed by Elettra-Sincrotrone Trieste, is able to deliver fully coherent and easily controllable VUV/soft x-ray photon pulses (see www.elettra.trieste.it/lightsources/fermi/fermi.html) [17, 18]. These features are due to the amplification method adopted at FERMI@Elettra, which relies on the high gain harmonic generation process [19, 20]. This process is obtained by seeding the emitting electron bunch with an external laser pulse, controlled in all the relevant photon parameters. This allows one to tune the properties of the FEL photon output by the seed laser, for instance, the FEL wavelength and pulse duration. Furthermore, the coherence properties of the seed laser are preserved in the FEL output radiation. The latter feature cannot be currently achieved by most of the other FEL facilities that are based on the self-amplification of spontaneous emission (SASE) scheme. The SASE scheme consists of several longitudinal modes with random phases, thus resulting in spiky time and frequency profiles.
While the time-coherence is an added-value for several 'conventional' FEL-based applications, it is mandatory for FWM experiments. Moreover, the layout of FERMI@Elettra can be adapted to exploit multiple seed laser pulses acting on the same electron bunch, resulting in the production of multiple FEL-pulses independently controllable in photon energy, bandwidth, polarization, time duration, etc. Finally, ultra-short (few fs) coherent photon pulses with the aforementioned properties could be generated by employing a scheme based on the echo enabled microbunching [21] and on the enhanced self-amplified spontaneous emission [22] processes.
In brief, FERMI@Elettra is a FEL source that can actually work as a conventional laser and, therefore, may allow pushing advanced table-top laser techniques, such as FWM, into the realm of VUV/soft x-rays. We hereby present a prospective study of the capabilities of FERMI@Elettra to perform VUV/soft x-ray nonlinear experiments, accompanied by estimates of the experimental signal. We show that VUV/soft x-ray FWM at seeded FELs is within reach and it promises a new development in our ability to gain insight into the electronic and structural dynamics of matter.
2. Vacuum ultraviolet/soft x-ray four wave mixing: an atomic selective ultrafast experimental tool
In its very essence, FWM is a nonlinear third-order process where three coherent electromagnetic fields of frequency/wavevector  jointly interact with a sample to generate a fourth field (ω4,
  ), coherently coupled with the three input fields (see figure 1(a)) [23, 24]. Separately, each of the three fields forces the sample polarization vector (
 ) to oscillate at the field frequency (ωi, i = 1–3). The excited sample then radiates with a certain phase shift. This linear mechanism (Rayleigh scattering) is the basis of conventional (photon-in/photon-out) x-ray spectroscopies. The interference of the three fields causes beatings at ω4 = ± ω1 ± ω2 ± ω3, which drive
  and can be regarded as the radiation sources that originate the FWM process. Such a wealth of interactions, properly described by a set of four coupled wave equations [23, 24], makes FWM suitable for studying several different excitations.
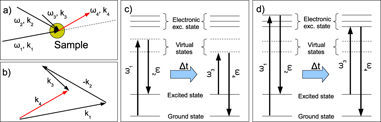
Figure 1. Sketch of a FWM experiment (a) with relative phase-matching diagram (b) and level scheme involving either virtual (c) or excited electronic states (d).
Download figure:
Standard image High-resolution imageIn order to describe the nonlinear response of materials,  can be expanded in powers of the electric field amplitude (
 ) [25]:

where χ(N) is a tensor of rank (N + 1), usually referred to as Nth-order susceptibility, while  is the Nth-order polarization. Since the power series must converge to a finite
  , the χ(N)-value decreases with increasing N. Moreover, the number of independent non-zero elements of χ(N) reduces if the material symmetry is considered [26]; e.g. all 27 elements of χ(2) vanish in isotropic materials. Differently from χ(2), the χ(3) tensor has non-zero elements for any symmetry and each element consists of 48 terms, even though in some cases χ(3) is determined by only a few dominant contributions [27]. In FWM experiments, the 'signal field' (
 ) is generated by
  , which accounts for the coupling between the four waves:

where  . Equation (2) provides insights into the measured FWM signals (
 ), which is proportional to |χ(3)|2, |Ei|2 (i = 1–3) and a phase factor. The latter indicates that an efficient coupling between the four waves may occur along a specific direction; for instance (see figure 1(b)) the FWM signal at ω4 = ω1 − ω2 + ω3 can be eventually detected along the 'phase matched' direction defined by
  . Along such a direction, the emission from different portions of the excited volume can interfere constructively (in phase addition of scattered amplitudes), provided that the coherence length of the FWM process (LFWMc) exceeds the characteristic dimensions of the interaction volume (Lint) [23, 26, 28, 29]. The latter is defined by the overlap region of the fields while LFWMc = π/Δk, where Δk is the wavevector mismatch (
 for the case shown in figure 18). In a continuous and extended sample this 'collective' response of the system to the input fields leads to a remarkable increase of the nonlinear signal, which may even become dominating. Phase matching also ensures that the spectroscopic information embedded in the FWM signal propagates into a specific direction, which can be chosen to be different from the directions of propagation of the input fields, thus substantially increasing the signal-to-noise ratio.
The use of pulsed beams enables one to follow the time evolution of the induced excitations. For example, two time-coincident optical fields with ω1 − ω2 = ωex can be used to selectively excite, e.g. vibrational modes at frequency ωex. The time evolution of these excitations can be traced back by sending a third delayed pulse (probe) of frequency ω3, which gives rise to a scattered field (signal) of frequency ω4 = ω3 + ωex propagating in the phase matching direction  (see figures 1(b) and (c)).
The specific FWM process described above is also known as coherent (anti-stokes) Raman scattering (CRS); at present, it is used to investigate processes in ultrafast molecular dynamics [26]. In some cases, one (or both) of the virtual states involved in the CRS process can be replaced by a real electronic excitation if the input field frequencies are properly tuned (see figure 1(d)). In this case, the efficiency of generating the CRS signal is greatly enhanced [30].
Nowadays, besides CRS, several time- and/or frequency-resolved methods of different levels of complexity (all of them based on IR, visible or UV laser sources) exploit the aforementioned advantages of the FWM process for very different purposes. For instance, in the 'transient grating' method, two time-coincident pulses with  are used to excite phonons with wavevector
  , while their time evolution is probed by monitoring the Bragg diffracted (phase matched) signal of a third, time delayed pulse [31]. In 'photon echo' methods, the time coherence properties of the excited states, which can include electronic wavefunctions arising from low-energy electronic excitations in complex molecular systems, are determined by monitoring the variation of the FWM signal as a function of the relative delay between the two excitation pulses [32]. So far, the shortest wavelength where these techniques were applied is the UV just below 300 nm [33–35]. Pushing their limits to shorter wavelengths allows accessing the core levels, with the advantage of elemental specificity.
Although already theorized in the literature a decade ago [36–38], only a few experimental attempts to demonstrate the FWM process at VUV/soft x-ray wavelengths have been done [39], while pump–probe applications have not yet been reported. In this respect, the only proposal for performing short wavelength FWM is represented by the TIMER project, presently in development at FERMI@Elettra [40]. Here, a basic FWM mechanism, i.e. the 'transient grating', will be used to determine the time evolution of phonon modes in the  –1 nm−1 range. However, the full potential of VUV/soft x-ray FWM goes beyond this specific application.
Insights into the opportunities given by the VUV/soft x-ray FWM can be gained by looking at a possible VUV/soft x-ray counterpart of the CRS, which can be used to study, e.g. exciton dynamics with atomic selectivity in molecular samples [38]. This is schematically depicted in figures 2(a) and (b) and is hereafter referred to as VUV-CRS. Here, an ultrafast high frequency field (ω1 ≈ 100's of eV, time duration ≈ 1 fs) is used to induce a core–hole transition at atom A within a given molecule, while a second field of frequency ω2 = ω1 − ωex is used to generate a valence band excitation of energy ωex ≈ 1–15 eV. The excited electronic wave packet is then eventually detected after a given time-delay (Δt) by a third VUV/soft x-ray probe beam, tuned at the core resonance of atom B (≈ ω3) within the same molecule. This gives rise to the fourth (signal) pulse at ω4 = ω3 + ωex. In bulk samples, many molecules are located in the interaction volume and, if LFWMc ⩾ Lint, then the collective response of the excited molecules may result in an appreciable signal propagating along the phase matching direction. Due to localization of the core shell, the excitation is initially centered on atom A, while the probe interacts with the unoccupied states close to the core shell resonant with the probe (atom B). The VUV-CRS signal (ω4,  ) can then be regarded as a measure of the coherence (if any) between the two sites. In short, by tuning ω1,2,3 and Δt, it is possible to chose where a given excitation is created, as well as where and when it is probed, opening up the possibility to study, e.g. the delocalization of electronic states and charge/energy transfer processes. This key feature is a direct consequence of the short wavelength nature of the method; indeed, coherent optical techniques (such as CRS) cannot probe spatial coherences between different sites, since only spatially homogeneous distributions of excitons, largely exceeding the exciton coherence length (usually on the 1–10 nm range [42]), can be detected. Since VUV/soft x-ray wavelengths may compare with molecular sizes, the wavevector dependencies of the VUV-CRS process can provide information on the involved interatomic distances. A further extension of VUV-FWM deeper into the x-ray range would also allow probing of the entire excitation spectrum, since dipole selection rules do not apply if the radiation wavelength compares with the size of the involved atoms. On the other hand, site selectivity cannot be attained by spontaneous VUV/x-ray (resonant or non-resonant) inelastic scattering methods, which, therefore, cannot probe the non-local nature of the excitations or, e.g. coherences between different atoms within a molecule. Beside these remarkable benefits, the coherent nature of the FWM process allows one to 'merely' improve the signal-to-noise ratio thanks to both the phase-matching constraint and the coherent addition of scattered amplitudes.
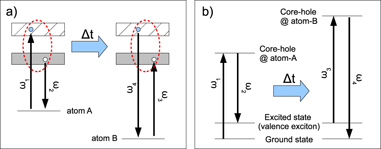
Figure 2. Sketch of the level (a) and energy (b) schemes for a VUV-FWM process involving core level excitations.
Download figure:
Standard image High-resolution imageIt is worth stressing that VUV-CRS is just one of the several FWM-based methods that may benefit from the extension of the exploitable spectral range down to the VUV/soft x-ray. Furthermore, the wealth and complexity of the information attainable by VUV/soft x-ray FWM methods will necessarily push forward the actual theoretical understanding of excited-state processes and dynamics.
3. Potential of the technique
The possibility to have a tool capable of generating FWM signals in the VUV/soft x-ray spectral range will open access to a broad range of excitations and will provide the element specificity of core level excitations. This would enable one to, e.g. follow the charge and energy flow between constituent atoms in materials, capabilities not attainable using table-top lasers and/or synchrotrons. From the range of fundamental scientific issues that can be addressed by the use of coherent VUV/soft x-ray fs pulses in combination with the unique capability of FMW, we discuss the following broad area of topics:
- (i)Intramolecular relaxation dynamics in metal complexes. Excited states of metal complexes are characterised by metal-centered (MC), ligand centered (LC), ligand-to-metal-charge transfer (LMCT) and metal-to-ligand-charge transfer (MLCT) states. Usually, the latter are the doorway states to photoinduced charge separation, spin and structural changes in the complex. Upon excitation, a wealth of processes occur, such as intramolecular vibrational redistribution (IVR), internal conversion (IC, i.e. relaxation between electronic states of identical spin), often via conical intersections (CIs), intersystem crossings (ISC, i.e. relaxation between the electronic states of different spins) and vibrational cooling. Understanding and disentangling these processes is not only of fundamental interest, but will also help to design cheaper and more efficient molecular systems for a given process (e.g. charge separation or spin change), in addition to providing new insight into biological dynamics (e.g. metalloporphyrins). Recent ultrafast studies have shown that some of these processes occur on very short time scales, e.g. sub-10 fs for IVR/IC [41] and sub-30 fs for ISC [42], while very large spin transitions (ΔS = 2; where ΔS is the change in the spin quantum number S) can occur in <150 fs [9]. These electronic and spin changes are often accompanied by substantial structural modifications [9, 43]. The time scales of these processes have important practical implications: e.g. the ultrafast IVR, IC and ISC times directly impact on the electron injection efficiency in dye-sensitized solar cells (DSSCs). The large spin changes in Fe-based metalloporphyrins play a central role in heme proteins [44]. Several questions are still open within this young field, calling for deeper studies with the advanced instrumentation proposed here. For instance, the recent discovery that ultrafast IVR/IC occurs in <10 fs suggests that IVR takes place at sub-vibrational time scales. The origin of such energy dissipation is wholly unclear; it also concerns organic molecules [45]. IC probably occurs via conical intersections (CIs) within the manifold of electronic states (mainly MLCT ones), but it is not possible to disentangle it from IVR with the present tools. VUV/soft x-ray FWM can probe the dephasing of the initial electronic coherence with a few fs resolution and should be able to solve this key issue. Moreover, the body of work emerging from ultrafast studies in the past 10 years shows that the ISC times are governed by complex combinations of structural parameters, spin–orbit constants and density of states [46]. In order to extract a rationale to the spin dynamics in metal-complexes, Fe-based complexes (such as polypyridine or porphyrin) are of prime importance, since they undergo the largest spin changes (ΔS = 2) and are very interesting for applications in solar energy, biology and magnetic data storage [43, 47]. The key point emerging from these studies is that the ΔS = 2 spin flip is highly selective as the 1MLCT state relaxes into the quintet MC one; furthermore, it seems to be mediated by an intramolecular electron-transfer process (MLCT/LMCT in the case of polypyridines/porphyrins). The latter point is an unresolved question, because the passage from the CT to the (quintet) MC state has so far not been time-resolved with the present methods. Theory suggested that the quintet state may have a large CT character [48] but experimental evidence for this conjecture is still lacking. In this respect, the element specificity provided by VUV/soft x-ray FWM is needed as the atoms that are most involved in a putative CT character are the nitrogens of the polypyridine or porphyrin ligands.
- (ii)Charge injection, transport and photocatalytic reactions in nanoparticles. Over the past few years the dynamics of charge and energy transfer in nanostructures has been extensively studied with the aim to develop renewable sources of energy either in DSSCs [49–51] or in the photocatalytic production of solar fuels [52–54]. DSSCs typically consist of metal (e.g. ruthenium) molecular complexes adsorbed onto the surface of a nanoporous wide-gap semiconductor (e.g. TiO2) substrate. The key event in DSSCs is the generation of a charge-separated state via channeled ultrafast electron injection from the excited metal-complex into the conduction band (CB) of the semiconductor. The efficiency of the charge transfer against parasitic energy losses depends on the existence of fast injection channels. Although the initial (from the 1MLCT state) injection time is very fast (shorter than 10's of fs [55]), IVR, IC and ISC are still major competing channels, because they occur on similar time scales. Due to these processes, the system ends up in the lowest 3MLCT state from which injection is much slower, i.e. some picoseconds (ps) [49]. So far, the existence of the initial fast injection is based on indirect measurements: ultrafast optical spectroscopy [55–57] as well as steady-state resonant photoemission [58]. Direct measurements are still pending due to the lack of methodologies with higher time resolutions. Furthermore, the occurrence and efficiency of such fast channels rely on the alignment of the molecular excited states with the CB of the substrate, on their coupling, on the density of CB states and on the trapping effects of surface and impurity states. In addition, several poorly understood factors play a role, such as: the chemical nature of the dye (conjugated versus non-conjugated anchoring groups), the solvent effects, the thermal disorder on the dye-substrate assemblies, the dye coverage and aggregation at the surface and the dephasing mechanism of the electron injected into the CB. Finally, one of the limitations of DSSCs is the recombination of the injected electron with the oxidized adsorbate, which can occur on 100's of fs [59]. A number of questions then still need to be clarified in order to fully understand the injection process and to tailor complexes that could optimize it further. For instance, the migration and trapping of the injected electron are crucially important as this determines the DSSC efficiency. There is strong evidence that part of the electrons end up at surface traps [60], but neither the time scale of the electron mobility to the traps nor the nature of the traps have been identified. This is also because of the lack of an element-specific method with few-fs resolution, as in VUV/soft x-ray FWM. Such unsolved issues also appear in photoelectrochemical cells (PECs), which convert sunlight into chemical energy (solar fuels). PECs actually mimic natural photosynthesis, where water and carbon dioxide are converted into carbohydrates via chemical reactions driven by the light-induced creation and transport of charged particles, that result in the catalyzed processes of water oxidation, CO2 reduction and hydrocarbon production [53, 54, 61–63]. These reactions imply charge migration to the surface, where electrocatalytic processes can take place. How the holes oxidize the surface-adsorbed species (–H2O, –OH, = O, –OOH, etc) and promote molecular O2 is highly debated, since the catalytically crucial role played by hole dynamics has completely escaped the experimental observation. The current research achievements on these systems are limited to optical spectroscopy down to 100's fs [61, 62, 64] and lack element-specificity. An element specific approach is needed here: indeed, while the CB is dominated by the Ti orbitals, the valence band is dominated by the oxygen orbitals. This suggests that a way to distinguish hole from electron dynamics is by looking at the core orbitals of Ti versus those of O. The capability of VUV FWM of probing sub-ps dynamics with elemental sensitivity will overcome the experimental limitations of current optical spectroscopic techniques. For example, VUV FWM will enable us to probe the time-scale of the electron and hole migrations, as well as the dynamics of the water oxidation reaction taking place at the catalyst, thus opening up the possibility to identify the bottleneck of the water oxidation process.
- (iii)Electron correlation and magnetism. Electron dynamics following laser pulses produces off-equilibrium transient states with altered material properties and can lead to phase transitions (e.g. ferromagnetic-paramagnetic and metal–insulator transitions) [65–67]. In magnetism, a principal question refers to the ultimate time scale for modifying and controlling the magnetic state, which determines the temporal limit for magnetic device operation. Controlled magnetization reversal is limited to the ns-regime when driven by external magnetic fields and to about 100 ps in the spin torque process [71]. Faster routes exploit energy transfers through optical/x-ray excitations [72, 73], however, the fundamental processes driving the magnetization dynamics on fs timescales are still unknown. A fast pulse creates an off-equilibrium ensemble of spin polarized electrons, which develops on the fs-scale and activates, through angular momentum transfer, the dynamics of the collective spin-momentum system [74, 75]. The ultrafast channels for spin angular momentum dissipations are not uniquely identified and different processes (e.g. magnon, phonon and Coulomb scattering [68–70]) may concur on different time-scales, as well as electron transport. Different time-scales appear to define, in some alloys, the magnetic moment evolution of specific chemical elements, when they are independently examined by selective core level spectroscopic methods [65]. Also, orbital and spin moments may respond differently to the pulsed excitations, while related effects can modify in the few fs range the spin–orbit coupling [76] and magneto-crystalline anisotropy. In several cases, magnetic phenomena are interrelated to structural and electronic (e.g. metal–insulator) transitions occurring on fast (1–1000 fs) time scales. In general, the descriptions of ultrafast processes, which provide the transfer of the excitation energy from the electron system to the magnetic lattice and eventually to the atomic lattices, are not yet clarified. The understanding of fast magnetic dynamics is therefore a demanding and timely question, which requires a deeper description of angular momentum transfer between charges, spins and lattice. Among the open issues that can benefit from the development of a VUV/soft x-ray FWM method with fully controllable photon polarization, we mention the case of molecular nanomagnets. These systems show quantum magnetic properties at the macroscale, as in quantum tunneling of the magnetization [77]. The easy accessibility of low-lying excited states by microwave radiation and external magnetic fields opens interesting opportunities for implementation of spin-based quantum information devices [78]. VUV/soft x-ray FWM will allow one to study the dynamics of spin and electron excitations on metal atoms and ligand sites, as well as their coupling with other excitations and the origin of the relaxation process in molecular magnets by analyzing the relaxation rates of the spin or orbital degrees of freedom among different atomic sites.
4. The instrument
The eventual development of the VUV/soft x-ray FWM technique at FERMI@Elettra necessarily implies a reconfiguration of the existing FEL source in order to obtain three independent coherent photon pulses (per shot) at different photon energies. These pulses should be featured by a few fs time duration and continuous tunability in both polarization and photon energy, as well as controllable spectral bandwidth, pulse duration and (relative) time delays. At the same time, a multipurpose experimental station and a dedicated photon transport system able to split, wavelength-select, delay, focus and recombine the three pulses at the sample position should be realized. In the following, the proposed instrument is discussed along with the main practical issues. The latter are mainly related to the specific parameters and constraints of the FERMI@Elettra facility. However, the results of the performed study should not be regarded as only limited to the discussed case, because its rationale is likely applicable for the development of other (either new or existing) 4th generation radiation facilities.
4.1. Free-electron laser development
The basic seeding scheme adopted at the FEL-1 source of FERMI@Elettra (see figure 3(a)) allows one to set the relevant photon parameters of the FEL pulse (see www.elettra.trieste.it/lightsources/fermi/fermi.html) [17, 18]. Here, a seed laser (SL) with wavelength λ interacts with the electrons while they propagate through the modulator (MOD), i.e. a short undulator tuned to the seed wavelength. Such interaction produces a modulation in the electron energy, which is transformed in a spatial micro-bunching with strong harmonic components when the electrons cross the static field generated by a magnetic chicane (dispersive section: DS). The micro-bunched electrons are finally injected into a long undulator chain (radiator: RAD), tuned to the Nth harmonic of the seed wavelength, and thus emit coherent FEL radiation at λ/N. The seeding scheme adopted for the FEL-1 source of FERMI@Elettra involves the use of an optical parametric amplifier (OPA) system, which allows one to continuously tune the seed laser wavelength in the 225–265 nm range, while keeping almost constant the seed pulse duration (Δtseed) at about 200 fs (full-width-at-half-maximum (FWHM)). The possibility to choose both λ and N (in the range N ≈ 4–12) ensures wavelength tunability [79]. The polarization tunability is instead provided by the use of APPLE-type undulators [80]. The time duration of the FEL pulses is typically ![$\Delta t_{\mathrm {FEL}}\approx \Delta t_{\mathrm {seed}}/\sqrt [3]{N} \approx 125-85\,\mathrm {fs}$](https://content.cld.iop.org/journals/1367-2630/15/12/123023/revision1/nj464235ieqn20.gif) [81].
[81].

Figure 3. (a) Sketch of the actual seeding scheme of the FEL-1 source at FERMI@Elettra. MLS, OPA, SL, MOD, DS and RAD indicate the master laser source, the optical parametric amplifier, the seed laser pulse, the modulator, the dispersive section and the radiator, respectively; the wavelength (λ) range of the OPA is 225–265 nm while the undulators are tuned at the Nth harmonic (N ≈ 4–12) of λ. (b) The proposed scheme for obtaining coherent photon pulses of a few fs time duration. THG + PStr is a third harmonic /pulse stretcher fixed wavelength stage and NOPA is a non-collinear optical parametric amplifier pumped by a part of the MLS fundamental pulse, respectively; the λ1-range is 550–650 nm while the N1-values can be as large as 150–200.
Download figure:
Standard image High-resolution imageIn order to generate coherent undulator radiation pulses of a few fs duration, we propose to use the so-called 'echo-enabled microbunching' [21] and the 'enhanced self-amplified spontaneous emission' [22] processes. The proposed scheme (see figure 3(b)) is based on the results reported in [82]. In a first step, the electron beam is brought into interaction with a seed laser SL0 (of wavelength λ0 ≈ 260 nm and time duration >200 fs) in a modulator MOD0. This interaction leads to a modulation of the electron energy, which is then transformed in a spatial micro-bunching by the dispersive section DS0. A further interaction into MOD1 with a very short (Δtseed ≈ 15 fs) but rather intense (> 100 MW) seed laser (SL1) operating at visible wavelengths (λ1 ≈550–650 nm, continuously tunable) allows applying the new energy modulation in a short portion of the electron bunch. Both SL0 and SL1 are obtained by splitting the output of a master laser source (MLS: ≈100 mJ per pulse, λ ≈ 780 nm, Δt ≈ 35 fs), thus reducing the relative time jitter due to different sources. The required SL1 characteristics can be achieved by a non-collinear optical parametric amplifier (NOPA [83, 84]), while SL0 can be obtained by third harmonic generation and pulse stretching (THG + PStr) since a broad wavelength tunability is not required for this pulse. After MOD1, the electron bunch passes through DS1. In principle, making a careful choice of both the size of the electron-beam energy modulation in MOD1 and of the DS0 and DS1 strengths, a significant bunching in a narrow (≈ fs) current spike at a high-order harmonic (N1) of λ1 can be obtained (echo-enabled microbunching [21]). A first study of the expected performance of EEHG at FERMI@Elettra has been carried out in [85]. The obtained results provide support to the feasibility of the proposed scheme. Following the generation of the narrow current spike, the electron bunch enters RAD1, tuned to λ1/N1. There, all electrons radiate, but electrons in the current peak produce a short enhanced pulse of coherent radiation that dominates the photon emission (enhanced self-amplified spontaneous emission [22]). The time duration of this coherent VUV/soft x-ray pulse (![$\Delta t\approx \Delta t_{\mathrm {seed}}/\sqrt [3]{N1}$](https://content.cld.iop.org/journals/1367-2630/15/12/123023/revision1/nj464235ieqn21.gif) ) can therefore be as short as ≈2–3 fs, since N1 can be as large as 150–200. Note that the bunching generated at the high-order harmonic λ1/N1 is relatively small, compared, e.g. to that obtained at low-order harmonics in the standard FEL-1 configuration. For this reason, when the machine is operated in this configuration, the process of coherent emission must occur in a relatively short radiator length with respect to the actual FEL-1 configuration, otherwise it will be rapidly contaminated by SASE radiation. Time independent 3D simulations carried out with the numerical code GENESIS [86] suggest that the radiator length should be about one third of the actual one.
) can therefore be as short as ≈2–3 fs, since N1 can be as large as 150–200. Note that the bunching generated at the high-order harmonic λ1/N1 is relatively small, compared, e.g. to that obtained at low-order harmonics in the standard FEL-1 configuration. For this reason, when the machine is operated in this configuration, the process of coherent emission must occur in a relatively short radiator length with respect to the actual FEL-1 configuration, otherwise it will be rapidly contaminated by SASE radiation. Time independent 3D simulations carried out with the numerical code GENESIS [86] suggest that the radiator length should be about one third of the actual one.
The flat portion of the FERMI@Elettra electron beam is long enough (> 200 fs) to allow multiple coherent emissions from the same electron bunch, with a further possibility to independently set all relevant photon parameters of the FEL pulses. The basic idea is to simply triple the aforementioned scheme (see figure 4). Indeed, the insertion of a second modulator (MOD2) after RAD1 allows for another interaction between a 'fresh' portion of the same electron beam and another seed laser (SL2) of a different wavelength (λ2). The subsequent microbunching can be achieved in a second dispersive section (DS2), while a second coherent photon pulse with wavelength λ2/N2 is then emitted by a second radiator chain (RAD2) tuned at the N2th harmonic of λ2. The third pulse is finally obtained by adding an additional sequence of devices (i.e. MOD3, DS3 and RAD3; the latter being tuned at the N3th harmonic of λ3) and by allowing a further interaction between the electron bunch and a third seed laser (SL3; wavelength λ3). Since the time duration of the SL1, SL2 and SL3 pulses is <20 fs, it is possible to accommodate these three independent seeding processes into the portion of the electron bunch previously seeded by the SL0 pulse, which is ≈200 fs long in time. We have recently tested the feasibility of a double coherent emission at FERMI@Elettra; as a matter of fact, we demonstrated the possibility to radiate two distinct VUV photon pulses at different wavelengths from the same electron bunch (pulse energy ≈20 μJ). This has been achieved using two different and complementary schemes. In the first one [13], the electron bunch has been seeded by a powerful chirped laser pulse, resulting in the emission of two sub-pulses with different central wavelengths and controllable temporal separation. In the second scheme, the seed was made of two separated laser pulses (261.1 and 259.7 nm wavelength; 100 fs time duration displaced in time by 500 fs), which stimulate the two-color (37.1 and 37.3 nm) double coherent emission [14].
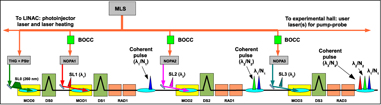
Figure 4. Sketch of the proposed scheme for obtaining the three-color/few-fs coherent undulator emission needed to perform VUV/soft x-ray experiments; the rationale of the laser system scheme is also shown: BOCC's are the balanced optical cross-correlator systems used to determine the relative timing fluctuations while NOPAi (i = 1–3) are three separate parametric amplifiers pumped by a part of the MLS fundamental pulse.
Download figure:
Standard image High-resolution imageFurthermore, as schematically depicted in figure 4, SL1, SL2 and SL3 are generated by three separate NOPA devices, which amplify a fraction of the same MLS output. The use of three NOPAs allows one to independently set both (λ1,λ2,λ3) and (N1,N2,N3). This latter feature ensures independent wavelength tunability [79], while independent polarization tunability is provided by the use of APPLE-type undulators [80]. The other relevant parameters of the three photon pulses can be independently controlled by separately acting on the SL1, SL2 and SL3 pulses. A necessary condition for the proposed scheme to work properly is that the relative timing of SL1, SL2 and SL3 pulses is constant with high accuracy. The use of a common pump source for the three NOPAs is essential for minimizing their relative timing jitter. Indeed, measurements performed at FERMI@Elettra show that the main contribution to timing jitter comes from the seed laser oscillator; also, that non-negligible timing drifts may originate from the regenerative amplifier of the MLS (even in a temperature stable environment). In the proposed scheme, both are common for all the seed pulses and therefore cancel. Based on the experience obtained at FERMI with the OPA, we expect negligible timing jitter (< 1 fs) from the NOPAs, while slow timing drifts (on the 10's of minutes scale), limited to below 10 fs, are introduced by the separated beam transport to the different seed positions. These drifts can be measured with sub-fs resolution by balanced optical cross-correlator (BOCC) methods [88] and compensated to a better than 1 fs precision by piezo-translator based feedbacks of the type already implemented at FERMI for regenerative amplifier drift stabilization [87].
The rationale of the proposed scheme, based on the echo-enabled microbunching and on the enhanced self-amplified spontaneous emission processes, allows keeping the overall length of the machine well below the hard limit given by the length of the undulator hall of FERMI@Elettra.9 However, the proposed scheme does not allow one to generate very intense photon pulses, compared to what is presently available at FERMI@Elettra. Indeed, the radiated energy per pulse drops down as ≈Δt/ΔtFEL, where ΔtFEL is the time duration of the FERMI@Elettra pulses. Moreover, in order to avoid a relevant SASE contamination, we estimated that the length of each of the three radiator chains has to be reduced by a factor of ≈3 with respect to the present configuration of FERMI@Elettra, thus leading to a reduction in the total radiated power by a factor of ≈9 with respect to the current FERMI source [18]10. We then estimate a radiated power of 1.2–0.2 GW in the 60–4 nm range, corresponding to an energy/pulse of ≈9 − 0.6 μJ. However, future upgrades of FERMI@Elettra (presently under evaluation) envisage increasing the radiated power. These include a further increase of the electron-beam energy, which is presently limited to 1.5 GeV, and the implementation of chirped pulse amplification [89]. Such a technique may allow one to gain at least one order of magnitude in the generated output power.
4.2. Photon beam transport
The photon analysis, delivery and reduction system (PADReS [90]) presently implemented at FERMI@Elettra will be upgraded in order to provide a proper diagnostic of the three-color FEL emission. In particular, the grating-based VUV spectrometer (PS) used to monitor 'in-line' the fundamental properties (central wavelength, intensity, bandwidth, etc) of the FEL emission will be improved in order to simultaneously detect the three-color pulses, eventually relaxing the spectral resolution. This task can be achieved by choosing the grating parameters and by designing a wide-angle detection system, also able to exploit higher diffraction orders. The spectrometer data will be used to monitor, on a shot-to-shot basis, the intensity and spectral stability of the three pulses, in order to provide a proper normalization of the FWM signal.
We performed ray-tracing calculations with the SHADOW code [91] in order to identify reliable solutions for the conceived photon transport system, which is located downstream of the PS. For these calculations, we used as working hypotheses that the distance between the three sources and the PS are 55, 72.5 and 90 m, while the photon beam divergence (σ') and source size (σ) are those actually observed at the FERMI@Elettra source: i.e. σ' ≈ 1.25 (μrad nm−1)·λ (nm) and σ ≈ 60 μm. This assumption relies on the fact that the geometrical properties of the coherent photon emission are essentially given by the electron beam properties, which are not expected to substantially change in the proposed scheme.
The three (collinear) coherent VUV/soft x-ray pulses (hereafter quoted as ω1, ω2 and ω3) emerging from the output of the PADReS system are separated by a monochromator based on diffraction gratings (see figure 5). The +1 (external) and −1 (internal) diffraction orders of the first grating (G0), placed 4.5 m downstream of the PS, is used to spatially separate the two beams closer in frequency. As an example, we consider two photon pulses well separated in ω: i.e. ω1 = 290 and ω2 = 275 eV (1 eV bandwidth). These are in the characteristic energy range of, e.g. the carbon K-edge or the ruthenium M4,5-edge, an element present in the so-called 'black dyes', which are relevant for DSSC applications [55, 92]. Such beams are diffracted in the ±1 orders by an Au coated laminar grating (G0) with 400 grooves mm−1, a groove ratio of 0.55, a groove height of 16 nm and an angle of incidence (α) of 86° (grating 'A' of those listed in table 1); in such a case, the cutoff frequency (ωcutoff) is ≈204 eV, so that only higher-ω photons are diffracted in the +1 order. The diffraction angles for the −1/ + 1 diffractions of ω1/ω2 are β−1ω1 = 84.78° and β+1ω2 = 87.96°, thus leading to an angular separation with respect to the zeroth diffraction order (specular reflection) of −1.22° and 1.96°, respectively. This reflects in a transversal separation between the two beams of about 280 mm after 1 m, while the angular separation between the ω1 and ω2 beams diffracted in same order, either the +1 or −1, is larger than the divergence of the single beam. It is then possible to select a single beam out of the two by using movable slits (S1 and S2, located downstream G0) working as spatial filters. The quoted grating parameters allow selecting the (ω1,ω2)-values for ω > ωcutoff (≈ 204 eV in this case). A set of interchangeable gratings, as those reported in table I, must be used in order to exploit the ω-range (22–300 eV) provided by the source. The two beams emerging from the ±1 orders of G0 impinge onto two roto-translating gratings (G1 and G2; see figure 5) with the same characteristics as G0 arranged in a subtractive configuration [93] in order to compensate for the dispersion and pulse lengthening introduced by G0 [94]. Figures 6(a) and (b) report ray tracing results of beam profile 2 m downstream of G1 and G2, respectively, if the S1 and S2 slits are not used; in these figures, D and V are spatial coordinates of the dispersive (horizontal) and vertical directions, respectively, while the origin of the reference frames are arbitrary.
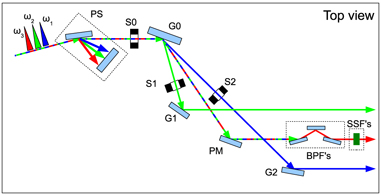
Figure 5. Sketch of the proposed layout to select and spatially separate the three-color FEL pulses (top-view, all reflection angles are enlarged for clarity). PS is the PADReS VUV spectrometer, presently available at FERMI@Elettra, (G0,G1,G2) are diffraction gratings, (S0,S1,S2) are slits, PM is a plane mirror, while BPFs and SSFs are multilayer-based bandpass and solid state filters (SSF), respectively.
Download figure:
Standard image High-resolution image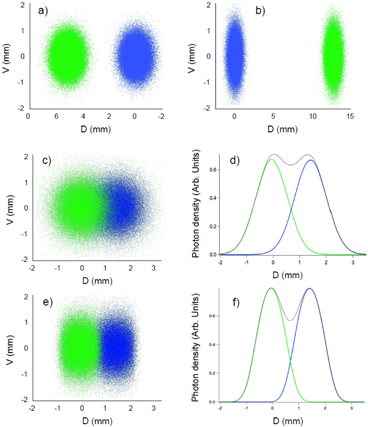
Figure 6. Ray tracing calculation of beam profiles 2 m after G1/G2 (grating parameters are reported in table 1: grating A) for the ω1 = 290 eV (blue dots) and ω2 = 275 eV (green dots) beams diffracted in the −1 (a) and +1 (b) order by the G0 grating if S1 and S2 are not used; pulse bandwidths are 1 eV. Panel (c) shows the same calculations as in panel a with ω1 = 283 eV (blue dots) and ω2 = 279 eV (green dots); pulse bandwidths are 1 eV. Panel (d) is the corresponding photon density along D: ω1, ω2 and ω1 + ω2 are indicated as full blue, full green and dotted black lines, respectively. Panels (e) and (f) are, respectively, as panels (c) and (d) with an horizontal slit (S0; see figure 5) of 1.1 mm width placed 20 m before G0. In this case, the overall intensity reduction is ≈19%.
Download figure:
Standard image High-resolution imageTable 1. Parameters of the grating set that can be used to cover the full spectral range (20–300 eV) provided by the FERMI@Elettra source.
| Grating N | A | B | C | D |
|---|---|---|---|---|
| Energy range | 300–200 eV | 200–100 eV | 42–100 eV | 22–50 eV |
| Cutoff energy (eV) | 203.6 | 86.5 | 40.7 | 20.4 |
| Groove density (Gr mm−1) | 400 | 170 | 80 | 40 |
| Groove height (nm) | 16 | 30 | 60 | 140 |
| Groove ratio | 0.55 | 0.55 | 0.55 | 0.65 |
| Coating material | Au | Au | Au | C |
In the ideal subtractive scheme, the diffraction orders of the two subsequent grating diffractions have opposite signs, the angle of incidence of the second grating (either G1 or G2) is equal to the diffraction angle of the first one (G0) and the number of illuminated grooves are equal. Such constraints cannot be reasonably fulfilled in the discussed case, in light of the finite divergence and bandwidth of the beam, the large distance (7 m in the present case) between the two gratings and the grazing incidence geometry. The different footprint of the beam at G0 and G1/G2 gives rise to a residual time elongation, which can be estimated to be ≈ΔNλ/c; where ΔN is the difference in the number of illuminated grooves at G0 and G1/G2, λ is the photon wavelength and c is the speed of light. In the aforementioned case (i.e. ω1 = 290 eV, ω2 = 275 eV, 1 eV bandwidth), the residual time elongation is in the 5–35 fs range. This time-broadening can be reduced by a careful choice of groove density and/or angle of incidence mismatch between G0 and G1/G2. For instance, in the discussed case the zero time elongation after G1 and G2 gratings can be achieved by setting the angle of incidence at G1 and G2 to 84.42° and 87.25°, respectively, instead of those characteristic of the ideal subtractive geometry (i.e. 84.78° and 87.96°). As a consequence, the ω1 and ω2 beams emerging from G1 and G2 do not travel parallel, since the diffraction angles of ω1 at G1 and ω2 at G2 are no longer 86° but 85.54° and 85.59°, respectively. This residual angular separation is always smaller than a few tenths of degrees and can be removed in the three-way delay-line (see figure 7) by using slightly different incident angles on the first plane mirror.

Figure 7. Schematic (top, side and front) views of a three-way delay-line; all reflections are by plane mirrors while the reflection angles are enlarged for clarity. The wide arrows schematize the degrees of freedom of the mirrors.
Download figure:
Standard image High-resolution imageThe minimum frequency separation (|ω1 − ω2|min) between ω1 and ω2 pulses provided by grating A is ≈4 eV and is essentially limited by the divergence of the source. For instance, figures 6(c) and (d) report ray tracing calculations for ω1 = 279 eV and ω2 = 283 eV (1 eV bandwidth) 2 m downstream of G1, thus corresponding to the +1 diffraction order of G0, which is the more critical one for minimizing |ω1 − ω2|min. At such a small frequency separation, the two beams are spatially overlapped. The overlap can be removed by reducing the horizontal divergence of the beam impinging onto G0. This option is reported in figures 6(e) and (f), which report the same case of figures 6(c) and (d) with an additional horizontal slit (S0, 1.1 mm width) inserted in the beam path 20 m before G0; in this case, the reduction in the pulse energy is ≈19%. Smaller |ω1 − ω2|min values can be obtained, at the expense of the photon throughput, by further reducing the width of S0. We found that the configuration based on grating A is the most problematic in terms of a minimum ω-separation of the beams and photon throughput; a more detailed account of the performance of the (G0,G1,G2)-system is reported elsewhere [95]. More sophisticated approaches to further reduce |ω1 − ω2|min keeping the time-elongation, ω-tunability and throughput at an acceptable level are under evaluation.
The beam with the larger wavelength difference (ω3) is finally derived by the zeroth diffraction order (specular reflection) from G0 in combination with a set of insertable multilayer mirrors systems used as bandpass filters (BPFs) and/or solid state filters (thin films, SSFs). The three spatially separated single-color FEL beams are then routed into a three-way delay-line, which also offsets the λ3/N3 beam in the vertical plane (see figure 7). Each branch of the delay-line exploits two grazing incidence reflections by plane mirrors. The relative time delays between the three beams can be varied in the ±20 ps range by varying the grazing angles of the two reflections in the 1.5–3° range while translating the second mirror to keep a fixed output direction (see figures 7(a) and (b)). The maximum/minimum distance considered here between the two mirrors is ≈10/5 m; larger delays are possible if a larger range in the grazing angle and/or in the relative distance between the two mirrors is considered.
The three FEL beams emerging from the three-way delay-line along a fixed direction are finally focused at the sample position by independent concave focusing (FM1, FM2 and FM3) and plane deflecting (PM1, PM2 and PM3) mirrors (see figure 8); the latter can roto-translate in order to allow changing the relative angles between the three beams. FM3 and PM3 are vertically offset in order to avoid mechanical interferences that can limit the exploitable angular range. Such an out-of-plane (BOXCAR [96]) configuration for exciting and probing beams, often used in FWM applications, will allow the fulfilment of the phase-matching conditions in a wide angular range. Figures 9(a)–(f) show some examples of ray tracing results for the focal spot at the sample. Data do not include finite values of slope errors and roughness, however, the results are not affected by these parameters as far as they are kept below 0.2/0.1/0.1 μrad (rms) and 3/3/2 nm (peak-to-valley), respectively, for gratings/plane-/focusing-mirrors. With such values for the mirror errors, the wavefront distortion with respect to the ideal wavefront can be kept below 0.3 nm. Also, the finite pulse bandwidth is not accounted for by the data reported in figure 9. While this does not affect the focusing of the ω3 beamline, it may affect that of ω1 and ω2 beamlines. In the ray-tracing calculations, the distances between the source and FM1, FM2 and FM3 (p) were assumed to be, respectively, 101, 83.5 and 118.5 m. In order to determine the source distances for the three beams, we used the virtual source positions within the FEL (the ray tracing calculation includes all the components between virtual source and focal spot). The distances between the sample and FM1, FM2 and FM3 (q) were assumed to be ≈5.5, 4.5 and 5 m, respectively, thus giving a demagnification factor of ≈19 for the ω1 and ω2 beamlines and ≈26 for the ω3 beamline. The ω3 beam is focused at the sample by an ellipsoidal mirror (88° angle of incidence, p = 113.5, q = 4.5 m), which can provide focal spot sizes of about 30–50 μm2 (see e.g. figures 9(c) and (f)). The ω1 and ω2 beamlines are equipped with Kirkpatrick–Baetz (KB) active systems [97], able to provide focal spot sizes of about 30–50 μm2 (see e.g. figures 9(a), (b), (d) and (e). KB systems further allow one to uncouple the horizontal and vertical strength. This capability is of critical relevance, since one can compensate for the mismatch between the horizontal and vertical properties (size, divergence and position) of the virtual source, as seen by the focusing mirrors of the ω1 and ω2 beamlines. Such a mismatch, induced by the (G0,G1,G2)-grating set, strongly depends on the central wavelength, bandwidth and grating parameters and, if not properly compensated, can remarkably affect the focal spot size, as discussed in [95].
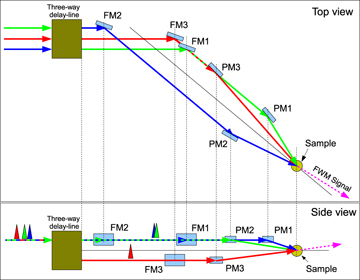
Figure 8. Schematic (top and side) views of the focusing/routing system. FM's and PM's are concave focusing and plane deflective mirrors, respectively; all reflection angles are enlarged for clarity.
Download figure:
Standard image High-resolution image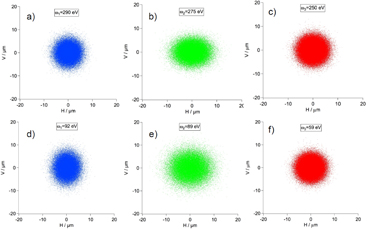
Figure 9. Ray tracing calculations of focal spots. Data corresponding to ω1, ω2 and ω3 beamlines are reported as blue, green and red dots, respectively. H and V are the horizontal and vertical spatial coordinate, respectively, while the ω-value of the beam is reported in each panel. The focal spot area for panels (a)–(f) is 42, 51, 29, 44, 52 and 28 μm2.
Download figure:
Standard image High-resolution imageWe finally mention that the changes in the optical path length during the ω and time-delay scans due, respectively, to the change in the working angles of (G0,G1,G2)-grating set and to the three-way delay-line are limited to some 10's of mm and, therefore, do not substantially affect the focus.
The calculated overall throughput of this complex beam transport system is reported as a function of ω in figure 10(a) for the ω1 and ω2 beamlines. Data shown in this figure do not include the reflectivity of the last (routing) mirror, which strongly depends on ω and experimental geometry. For instance, at ω = 30 eV, the reflectivity of a Ni-coated mirror is larger than 65% for grazing angles lower than 15°, while at ω = 300 eV, it drops down to below 50% for grazing angles >6°.11 At high-ω and large grazing angles, a much larger photon throughput can be achieved by multilayer coated mirrors. The throughput of the ω3 beamline is expected to be larger, since the two specular grazing incident reflections from G0 and PM plus the BPF or the SSF are more efficient than two subsequent grating diffractions. The ±1 orders diffraction efficiency for the gratings reported in table 1 are separately reported in figure 10(b).
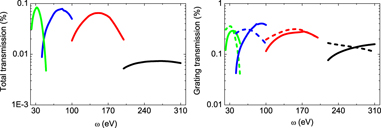
Figure 10. Panel (a) reports the overall transmission of the ω1 and ω2 beamlines of the photon transport system as a function of ω; the reflectivity of the last routing mirror was not included. Full/dashed lines in panel (b) are the transmission in the +1/ − 1 order as a function of ω for the gratings listed in table 1 (black, red, blue and green lines correspond to the grating A, B, C and D listed in table 1).
Download figure:
Standard image High-resolution imageThe sample will be finally placed in an experimental chamber equipped with a sample manipulator, designed to be compatible with different sample environments (including special cells or injector systems for gas or liquid samples [98]), detectors and diagnostics for monitoring both beam and sample parameters. The experimental chamber would also be integrated with further optical systems, that can eventually be employed to collect and spectrally analyze the VUV-FWM signal and/or to focus onto the sample an additional laser pulse, which can eventually be used to photo-initialize some specific dynamics.
4.3. Signal estimate
As previously mentioned, the FWM signal is proportional to |χ(3)|2, |Ei|2 (i = 1–3) and to the phase matching factor, which essentially accounts for the localization in space of the FWM signal (equations (1) and (2)). In order to provide an order of magnitude estimate of the FWM signal (|E4|2), we considered the following equation:

where sinc2(ΔkLint/2) term in equation (3) is the usual representation of the phase matching factor in a finite size sample [23, 26, 28]. This factor is maximized when  (i.e. for LFWMc ≫ Lint). In non-collinear FWM experiments, Δk is determined by both the pointing and wavelength stability of the laser and may sensibly limit the magnitude of the signal. In this respect, the seeding scheme adopted at FERMI@Elettra can provide an outstanding pointing (≪ 10 μrad) and wavelength stability (δλ/λ < 10−4 [101]) of the source. In equation (3), we added the
  factor (where Lz and α are the sample length crossed by the beams and the absorption coefficient at the involved frequencies12) to account for the absorption of the radiation inside the sample. While in the optical case this is often negligible, at VUV/soft x-ray wavelengths α−1 compares with the typical size of the interaction volume (i.e. αLz ≈ 1). Moreover, in the spectral range considered here, α can assume a broad range of values (≈ 0.1–10 μm−1) depending on the specific sample and wavelength. A conscious choice of the sample and experimental geometry has then to be made in order to keep this factor above an acceptable level.
In order to provide an order-of-magnitude estimate of χ(3), we used the centro-symmetric anharmonic oscillator model, derived within the dipole approximation and used to account for the stimulated Raman scattering process [15, 24], a FWM-based method in which ω1 = ω3 and ω4 = ω2. In this case

where  0, n, ra, e and me are the dielectric constant, the number density, the atomic radius, the electron charge and mass, respectively, while ω0 and γ0 are the resonance frequency and linewidth. The black and blue lines in figure 11 are the ω2-dependence of |χ(3)| in the IR-optical range, as given by equation (4), assuming n = 3 × 1028 m−3, ra = 10−10 m and ω1 = 1 eV, while ω0 and γ0 values are those typical of optical transitions (ω0 = 2.5–5 eV and γ0 = 0.02–0.2 eV). Such estimated |χ(3)|-values are of the same order of magnitude as those usually observed in the optical range [99, 100]. Figure 11 also reports the |χ(3)| trend expected in the VUV/soft x-ray, as estimated through equation (4) assuming ω1 − ω2 = ωex (with ωex in the optical range), while the ω0 and γ0 values are those typical of core transitions falling within the FERMI@Elettra spectral range (ω0 = 20–310 eV and γ0 = 0.2–1 eV). At resonance, the |χ(3)|-values in the low-ω side of the spectral range considered here (≈ 30 eV) are similar to those found, out of resonance, in the optical domain. A decrease in the |χ(3)|-value of about two orders of magnitude is instead observed when ω decreases down to ≈300 eV.

Figure 11. |χ(3)|-values as derived from equation (4). |χ(3)|-values in the optical range were obtained by setting ω1 = 1 and ω0 = 2.5 eV (black lines) or 5 eV (blue lines); full and dashed lines correspond to γ0 = 0.2 and 0.02 eV, respectively. |χ(3)|-values in the VUV range were obtained by assuming ω1 = ω2 + ωexc in equation (4) and setting ω0 = 30 eV (green lines), 100 eV (red lines) or 300 eV (magenta lines); full lines correspond to (ωexc;γ0)-values of (2.5; 0.2) eV while dashed lines indicate other representative (ωexc;γ0)-values: i.e. (2.5; 2), (5; 0.2) and (5; 2) eV. The areas delimited by dashed lines sketch typical |χ(3)|-values found in the optical domain [99, 100] and those expected in the VUV range.
Download figure:
Standard image High-resolution imageFigure 12(a) reports an example of the estimated number of photons per pulse (Nsignal) in the FWM signal as a function of ω. Nsignal was calculated as: Nphot = W4ΔtAs/(ℏω4) = |E4|2ΔtAs/(2Z0ℏω4); where W4, As = 40 μm2 and Z0 = 377 V A−1 are the power density, the beam size at the sample and the vacuum impedance, respectively. We further assumed ![$\Delta t=\Delta t_{\mathrm {seed}}\sqrt [3]{\lambda _4/\lambda _{\mathrm {seed}}}=15\,(\mathrm {fs})\sqrt [3]{\lambda _4\,(\mathrm {nm})/600\,(\mathrm {nm})}$](https://content.cld.iop.org/journals/1367-2630/15/12/123023/revision1/nj464235ieqn24.gif) . Full lines in figure 12 are |E4|2, calculated from equation (3) assuming
. Full lines in figure 12 are |E4|2, calculated from equation (3) assuming  , ω1 − ω2 = ωex = 5 eV and ω1 = ω3 = ω0 = ω (hence ω4 = ω3 + 5 (eV)). In this case, equation (4) reduces to

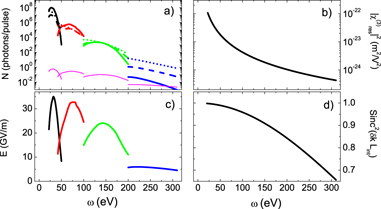
Figure 12. Panel (a) reports the expected experimental signal as a function of ω, as calculated through equation (5) (shown in panel (b)) assuming all input fields at approximatively the same frequency (full lines) and the pump/probe fields fixed at ≈150 eV (dashed/dotted lines), magenta lines are the signal expected from the single beam scattering within the solid angle subtended by the FWM signal; see text for further details. Panels (c) and (d) report the expected values of |E| and of the phase matching factor; see text for further details. Black/red/green/blue lines in panels (a) and (c) refer to the configuration based on grating A/B/C/D listed in table 1.
Download figure:
Standard image High-resolution image
The ω-dependence of equation (5) with n = 3 × 1028 m−3, ra = 10−10 m and γ0 = 0.5 eV, is reported in figure 12(b). The ω-dependence of  (where Wi is the power density of the ith field at the sample) is reported in figure 12(c). It was determined by assuming Wi = TP(ωi)SP(ωi)/As, where TP(ω) is the transmission of the photon transport system (figure 10(a)) scaled by an additional factor of 0.7 to account for the reflectivity of the last routing mirror and SP(ω) is the peak power at the source. As previously discussed, SP(ω) was determined by scaling the peak power of the actual FEL source by a factor of 9, thus leading to ≈1.1 GW for ω < 70 eV, followed by a decrease down to ≈0.2 GW at 300 eV. The phase matching factor is reported in figure 12(d), calculated considering
  and
and  [101]. Shot-by-shot variations of |Ei|2 and that of the phase matching factor due to central wavelength fluctuations would be provided by PS and used to normalize the experimental signal.
Dashed and dotted lines in figure 12(a) are obtained, respectively, by assuming ω3 = 150 eV (ω4 = 155 eV and ω = ω1 = ω2 + 5 (eV)) and ω1 = ω2 + 5 (eV) = 150 eV (ω = ω3 = ω4 − 5 (eV)), respectively, while retaining the same χ(3)res-value shown in figure 12(b). The latter assumption is clearly inappropriate; the dash and dotted lines in figure 12(a) should be regarded as just an indication of the expected trend.
On such grounds, we expect a large VUV-FWM signal (up to above 107 photons per pulse) in the low-ω side of the range under consideration. The experimental signal then rapidly drops down to about a few photons per pulse at ω ≈ 200 eV (still within the detection capability of standard detectors). Such an amount of signal can be roughly expected, e.g. also in the case where the probe pulse is in the 200–300 eV range while the pump ones locate in a more favorable ω-range. Conversely, if all input fields (or even just the pump ones) are in the 200–300 eV range, then the signal level is well below the single photon per pulse. However, it is worth noticing that these experiments do not require the single-shot approach due to sample damage. The FWM signal from several consecutive pulses can be thus summed up in order to improve the statistical quality of the data, while time-gated detection systems could be used to decrease the dark counts. On the other hand, further developments of the source, such as the increase in the LINAC energy and/or the implementation of chirped amplification schemes [89], would allow one to fully exploit the spectral range above 200 eV.
Finally, we point out that the spontaneous undulator emission is expected to be on the same level (< 0.1 μJ per pulse) or even less than what is currently observed at the FERMI@Elettra source, because the length of radiating elements is essentially the same while the electron bunch length would be quite a lot shorter than the one that is presently used (≈ 1 ps). On the other hand, the transmission of such a spontaneous undulator emission through the wavelength-selective optical transport system will be even lower than what is shown in figure 10(a) and, consequently, we do not expect any appreciable contribution to the measured signal. The FWM signal is expected to propagate along the  direction with a divergence roughly given by the divergence of the incoming beam times the demagnification factor of the optics, which, in the worst case, is ≈2 mrad. This means that the detector has to subtend a solid angle (ΔΩ) of about 3 × 10⁻⁷ sr. The total 'spontaneous' scattering efficiency of a single beam of frequency ωi into ΔΩ from a homogeneous and extended sample is given by:
  ; where f(Q) is the form factor, S(Q) the static structure factor and Q the scattering vector. At Q < 1 nm−1, as in this case, S(Q) ≈ S(0) and f(Q) ≈ Z, where Z is the atomic number. For Z = 10, N = 3 × 1028 m−3, Lz = α−1i = 1 μm (Nouti is maximum when L = α−1i), ΔΩ = 3 × 10⁻⁷ sr and for typical S(Q) values of 0.1–0.01, we have that Nouti/Nini ≈ 10−12. As shown in figure 12(a), the single beam scattering compares the FWM signal when all three input beams are at ≈300 eV, while it is completely negligible at ω < 200 eV. In other words, thanks to the strong directional nature of the FWM signal, we expect an almost negligible amount of spontaneous scattering intensity from the three beams (separately) in the small solid angle of the FWM detector, at least for ω < 200 eV. However, we also stress that it is always possible to determine the scattering intensities of the single beams separately by simply shutting down the unwanted beams. Once corrected for the pulse energy, given by the PS, such measurements can be used to subtract the residual background of spontaneous scattering in order to obtain the true FWM signal.
5. Conclusions
In summary, we pointed out how the potential capability of seeded FEL sources, like FERMI@Elettra, to provide the stable and controllable multiple emission of ultrashort coherent pulses at different wavelengths can be used to extend advanced multidimensional spectroscopies, as those based on FWM processes, in the VUV/soft x-ray range. Differently from other FEL-based applications, the proposed experiments definitely do not require 'just' high brilliance but, rather, a unique combination of 'laser-like' (time coherence and short pulses) and 'synchrotron-like' (wavelength range and tunability) features, likely achievable in the near future with seeded FELs. The proposed instrument can provide a full coherent control of molecular and crystal excitations at VUV/soft x-ray wavelengths, thus opening up the possibility to directly and selectively probe coherent excitations at atomic length and time scales. The results of this kind of experiments would be of paramount importance for various research fields and cutting-edge applications that range, for instance, from the understanding of the charge/energy transfer processes in photovoltaic and bio-mimetic devices to magnetic dynamics in spintronics.
Acknowledgments
CM acknowledges support from the European Research Council through the ERC grant no. 202804-TIMER. Authors gratefully acknowledge referee 3 for the accurate competent and constructive review.
Footnotes
- 8
We note that in general in the definition of Δk we have to consider also the refraction index at the involved wavelength this are in most cases negligible at VUV/soft x-ray wavelengths discussed further below.
- 9
Obviously this constraint does not apply if the rationale of the proposed instrument is transposed to another facility.
- 10
At this stage of the study we cannot exclude the possibility to slightly increase the length of RAD1, RAD2 and RAD3 in order to mitigate the reduction in the radiated power.
- 11
Data freely available at http://henke.lbl.gov/optical_constants/mirror2.html.
- 12
A proper account of absorption should consider the sample lengths crossed by the four beams separately, as well as the experimental and sample geometry.