

Abstract
We report the anomalous charge density wave (CDW) state evolution and dome-like superconductivity in CuIr2Te4−xSex (0 ⩽ x ⩽ 0.5) series. Room temperature powder x-ray diffraction (XRD) results indicate that CuIr2Te4−xSex (0 ⩽ x ⩽ 0.5) compounds retain the same structure as the host CuIr2Te4 and the unit cell constants a and c manifest a linear decline with increasing Se content. Magnetization, resistivity and heat capacity results suggest that superconducting transition temperature (Tc) exhibits a weak dome-like variation as substituting Te by Se with the maximum Tc = 2.83 K for x = 0.1 followed by suppression in Tc and simultaneous decrease of the superconducting volume fraction. Unexpectedly, the CDW-like transition (TCDW) is suppressed with lower Se doping (0.025 ⩽ x ⩽ 0.2) but re-emerges at higher doping (0.25 ⩽ x ⩽ 0.5). Meanwhile, the temperature-dependent XRD measurements show that the trigonal structure is stable at 20 K, 100 K and 300 K for the host sample and the doping composition with x = 0.5, thus we propose that the behavior CDW-like transition arises from the disorder effect created by chemical doping and is not related to structural transition. The lower and the upper critical fields of these compounds are also addressed.
Export citation and abstract BibTeX RIS
1. Introduction
Transition-metal chalcogenides (TMCs) own plentiful structural chemistry and physical properties such as nontrivial topological properties [1–3], charge density wave (CDW) [4–6], superconductivity (SC) [7–10], Mott transition [11], extremely large magnetoresistance [12, 13], spin glass [14], and so on. Specifically, the coexistence/competition of SC and CDW is a long history but still a hot topic in condensed matter physics. CDW and SC are two fully distinct cooperative states, both of which happen because of the instabilities of Fermi surface (FS) that result in the splitting of FS and the density of states (DOS) at FS surface decrease below their corresponding transition temperatures. So far, abundant results demonstrate that a superconducting dome can usually be seen on the edge of a CDW/structural instability by the application of hydrostatic pressure [15, 16], chemical doping [17–22], or gating [23]. Among chemical doping methods, the isovalent substitution is a commonly used strategy to study the key relation between SC and instabilities in some other order parameters. A recent, prominent case is 1T-TaS2−x Sex , in which SC occurs when the commensurate CDW (CCDW) Mott phase vanishes, and it coexists with the nearly CCDW state [24]. Moreover, the isoelectronic S substitution for Se in 2H-TaSe2 leads to the emergence of a robust superconducting order in the 2H-TaSe2−x Sx (0 ⩽ x ⩽ 2) series. In the case of 2H-TaSe2−x Sx (0 ⩽ x ⩽ 2) compounds, the CDW is suppressed and the SC is maximized with crystallographic disorder, and the superconducting transition temperature (Tc) of the doped compound is surprisingly higher than those of two end compounds [25]. Another example of isoelectronic substitution material is TaSe2−x Tex (0 ⩽ x ⩽ 2). The isoelectronic Te replacement for Se in 2H-TaSe2 not only leads to two polytypes and two polymorphs, but also enhances the Tc. The Tcs of the 1T and 3R polymorph TaSe2−x Tex are both higher than that of the undoped 2H-TaSe2. Especially, the maximum Tc of 3R-TaSe2−x Tex variants is five times larger than that of the undoped 2H-TaSe2 sample [26]. Moreover, the 3R-TaSe2−x Tex variants exhibit the coexistence of SC and CDW, with 3R-TaSe1.9Te0.1 initially displaying an incommensurate and then transitioning to a CCDW phase upon further cooling. This phenomenon likely emerges either from an unexpected influence of the layer stacking order on the electronic properties, which is likely to be dominated by the characteristics of the single layer or from exceptional dependence of Tc on the subtle differences in the properties of the single layers in this type of compounds [26]. Besides, SC is emerged or enhanced upon isoelectronic Se substitution for Te/S in the parent TMCs (e.g. 1T-PdTe2, 1T-TaS2, ZrTe3) [27–30]. The enhancement of Tc in 1T-PdSeTe is considered to be arising from the possible existence of metallic Pd or PdTe stripes and/or some dedicated structural disorder caused by a rather small amount of Se deficiency. Except for the TMC compounds, Se chemical doping has been confirmed to be an effective tool to tune the CDW and SC in other systems like Eu3Bi2S4F4 [31], Nb2Pd(S1−x Sex )5 [32] and so on.
Very recently, the occurrence of SC in a CDW materials has been observed in the quasi-two-dimensional Cu0.5IrTe2 (CuIr2Te4) chalcogenides with a NiAs defected trigonal structure (space group P3-m1) as presented in the inset of figure 1(a), in which Cu is intercalated between the Te–Ir–Te layers [33]. The Tc is around 2.5 K, and the CDW transition temperature (TCDW) is about 250 K (from heating) and 186 K (from cooling). First-principles calculations further reveal that the electronic DOS in the vicinity of the Fermi energy fundamentally descend from the Ir d and Te p orbitals [33]. Therefore, it is reasonable to tune the SC and CDW in the parent CuIr2Te4 telluride chalcogenide with isoelectronic Se substitution for Te-site by controlling the Fermi energy EF or creating disorder.
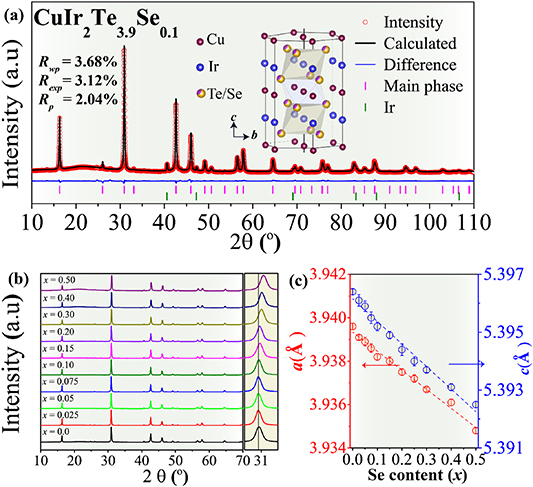
Figure 1. (a) Rietveld refinement for the representative CuIr2Te3.9Se0.1. (b) PXRD patterns for CuIr2Te4−x Sex (0 ⩽ x⩽ 0.5). (c) The dependence of unit-cell constants a and c on the doping concentration x.
Download figure:
Standard image High-resolution imageOn the other hand, copper-based chalcogenide spinels display rich physical properties such as magnetic ordering [34–36], metal-insulator transition (MIT) [37–39], and SC [8, 40–42]. It is well known that the sulpo-CuRh2S4, where the Cu atoms occupy the tetrahedra sites and the Rh atoms occupy the octahedra sites, shows SC with Tc = 4.70 K [31]. Another spinel CuIr2S4 displays temperature-induced MIT near 226 K with structural phase transition, displaying hysteresis on cooling and heating [39]. Selenospinel CuIr2Se4 (isostructural to CuIr2S4), however, remains ordinary metal above 0.5 K at ambient pressure but shows a MIT above 2.8 GPa [43, 44]. Despite the absence of metal–metal pairing or charge ordering in CuIr2Se4, it seems to be at the margin of such performance [45], i.e. it possibly has a nascent propensity to such fluctuation due to the robust spin–orbit coupling of 5d Ir and the geometrical frustration inherent to the spinel structure. Indeed, SC in CuIr2Se4 spinel has been prompted by Pt substitution for Ir [8]. Therefore, these differences in structural and electronic properties between the layered CuIr2Te4 and the spinel CuIr2Se4 have attracted our attention as a starting point to explore the effect of the isoelectronic Se substitution for Te site on the SC and CDW in CuIr2Te4 compound and whether it can facilitate SC near a CDW state.
For this matter, we successfully synthesized and systemically investigated the crystallographic and physical properties of the polycrystalline CuIr2Te4−x Sex (0 ⩽ x ⩽ 0.5) series. Yet, several attempts have been failed to produce single crystal for this family. The analysis of x-ray diffraction (XRD) measurements under several temperatures (20 K, 100 K and 300 K) indicates that CuIr2Te4−x Sex (0 ⩽ x ⩽ 0.5) samples maintain the same layered structure as the CuIr2Te4, but mixed layered phase and cubic phase can be found for x ⩾ 0.50 even near the end. Resistivity and magnetic susceptibility measurements both show consistently that isoelectronic Se substitution for Te in CuIr2Te4 first favors the SC near a CDW accompanied with the anomalous CDW state evolution in two sides of dome-like SC. The optimal doping composition is CuIr2Te0.9Se0.1 with the highest Tc = 2.83 K. The CDW-like states disappear at lower doping content but re-emerge at higher Se doping concentration.
2. Methods
Polycrystalline CuIr2Te4−x Sex (0 ⩽ x ⩽ 0.5) compounds are made by means of a vacuum shield solid-state reaction method. Cu, Ir, Te and Se powders were weighted in the stoichiometric ratios and ground with a mortar. Then the mixture was sealed in the evacuated quartz tubes and sintered at 1023 K for 5 d. The as-prepared precursors were then reground, compressed into pellets and heated at 1023 K for 10 d. The polycrystalline CuIr2Te4−x Sex samples are not air-sensitive.
To determine phase purity and analyze the detailed crystal structure, powder XRD (PXRD) characterization was carried out at room temperature by using MiniFlex, Rigaku apparatus with Cu Kα1 radiation. Rietveld model in FULLPROF suite software was used to perform the structural parameter refinements for the obtained polycrystalline CuIr2Te4−x Sex compounds. Besides, XRD measurements under 20 K, 100 K and 300 K were carried using a Mo K (17.4 keV) microspot x-ray source and a Pilatus 2D detector. All temperature evolution measurements are conducted through warming process. The elements ratios and their distributions were examined via scanning electronic microscope combined with energy dispersive X-ray spectroscopy (SEM-EDS) EM-30AX PLUS from Kurashiki Kako Co. Ltd, Japan, equipped by an energy dispersive x-ray spectroscopy detector. The temperature-dependent electrical resistivity (ρ(T)) of all the samples and the specific heat capacity (Cp(T)) measurements we carried out using a quantum design physical property measurement system. The DC magnetic susceptibilities were measured using a superconducting quantum interference device magnetic property measurement system under 10 Oe. Using resistivity ρ(T) data, Tcs are extracted from the midpoint of the drop region, and the extrapolations of the abrupt slope of the susceptibility and the normal state susceptibility, Tc from the specific heat capacity (Cp(T)) is estimated by the equal area entropy construction method. TCDW values have been estimated from the minimum of the temperature-dependent derivative of resistivity (dρ/dT(T)) and the maximum of the temperature-dependent derivative of magnetic susceptibility (dχ/dT) measured under 10 kOe.
3. Results and discussions
We performed detailed structural investigation using the Rietveld refinement technique to check the phase purity and crystal structure of all the synthesized polycrystalline CuIr2Te4−x Sex (0 ⩽ x ⩽ 0.5) series. The refinement for the representative CuIr2Te3.9Se0.1 compound is shown in figure 1(a). An analysis of XRD patterns shows that CuIr2Te3.9Se0.1 compound has a trigonal structure with lattice contents a = b = 3.9382 Å, c = 5.3952 Å, which is slightly lower than those of the parent compound CuIr2Te4 with a = b = 3.9397 Å, c = 5.3964 Å [32]. The Rietveld refinements for the other investigated polycrystalline samples are depicted in the supplemental information (figure S1 (available online at stacks.iop.org/SUST/34/115003/mmedia)). Besides, the refinement results confirm that all these CuIr2Te4−x Sex (0 ⩽ x ⩽ 0.5) series preserve the basic trigonal structure with the space group P-3m1 as presented in the inset of figure 1(a), though tiny unreacted Ir appears in all the specimens, where Cu atoms occupy the octahedral sites 1b (0 0 ½), Ir atoms occupy the sites 1a (0 0 0), Te/Se atoms are in sites 2d (⅓ ⅔ z). Room temperature XRD patterns of the polycrystalline CuIr2Te4−x Sex (0 < x < 0.5) compounds are shown in figure 1(b). The variation of the (002) diffraction peaks for different Se concentrations is revealed in the right side of figure 1(b), where all the (002) peaks shift towards higher angle with increasing selenium concentration in CuIr2Te4−x Sex (0 ⩽ x ⩽ 0.5). Indeed, as depicted in figure 1(c), the lattice constants a and c both manifest linear decrease with the increase of Se concentration x for our synthesized CuIr2Te4−x Sex , which is in good agreement with Vegard's law [46]. The reason behind this is the smaller ionic radii of Se (1.98 Å) compared with that of Te (2.21 Å) [47]. Hence, a consistent reduction of the unit cell volumes of the CuIr2Te4−x Sex compounds is expected. Nevertheless, samples with higher Se content (the vicinity of the spinel CuIr2Se4) have not been successfully synthesized at present. In addition, we further used scanning electronic microscope combined with energy dispersive X-ray spectroscopy (SEM-EDS) to examine the ratio and the distribution of the elements and found that the experimental percentages of Cu:Ir:Te:Se for CuIr2Te4−x Sex samples are close to the initial percentages (see figure S2). As shown in figure S3, we can see a homogeneous distribution for all the elements in these CuIr2Te4−x Sex polycrystalline samples.
The raw resistivity data as a function of temperature is plotted in figure S4. The temperature-dependent normalized resistivity (ρ/ρ300K) of CuIr2Te4−x Sex (0 ⩽ x ⩽ 0.5) polycrystalline series under zero magnetic field is given in figure 2(a). The specimens demonstrate a metallic behaviour in the temperature region of 3 K – 300 K, but there is abnormal hump in some samples. A sharp drop of resistivity can be seen at low temperatures, identifying the onset of SC. Normalized resistivity ρ/ρ300K near Tc is shown in figure 2(b). Tc gradually increases up to 2.83 K for the optimal CuIr2Te3.9Se0.1. From table 1 and figure S5, we can see that the increase of Tc is followed in an increase residual resistivity ratio (RRR = R300K/R8K) from 4.16 for the undoped sample to 5.88 for the doped sample with the highest Tc (x = 0.1). Besides, from figure 2(a), we can see that the anomalies hump disappears at very low Se doping concentration region, indicating the suppression of CDW-like transition temperatures (TCDW), which is determined by the minimum of dρ/dT (see inset of figure 2(a)). Meanwhile, the Se doped samples in the region of 0 < x ⩽ 0.3 exhibit sharp superconducting transition, implying that the samples is highly homogeneous (see figure 2(b) and table 1). Unexpectedly, the hump anomalies associated with CDW-like transition in the ρ(T) curves re-emerges when x = 0.25. For 0.25 ⩽ x⩽ 0.5, the TCDW transition anomalies steadily increases with increasing Se doping, while the RRR (RRR = R300K/R8K) sharply decreases from 3.02 for x = 0.25–1.87 for x = 0.5 (see table 1 and figure S5). The decrease of RRR suggests that Se doping induces disorder significantly and Se ions are effective scattering centers [48–50], which could account for the reemergence of the CDW.
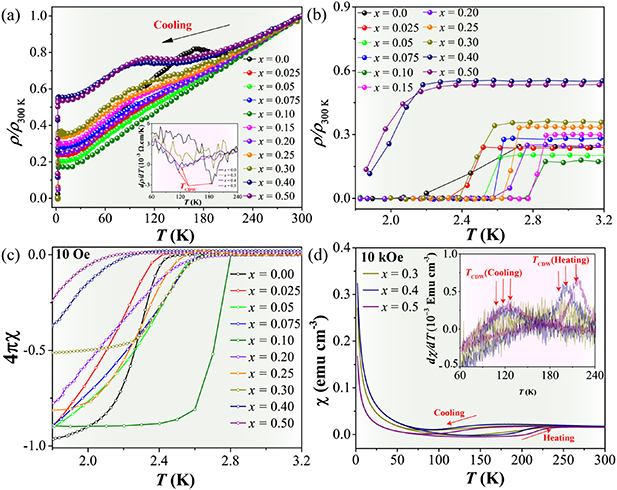
Figure 2. Electrical transport and magnetic properties of CuIr2Te4−x Sex . (a) The temperature-dependent resistivity for the polycrystalline CuIr2Te4−x Sex . (b) The magnified view of the normalized resistivity (ρ/ρ300K) at the superconducting transition range for the polycrystalline CuIr2Te4−x Sex at low temperatures. (c) Magnetic susceptibilities for CuIr2Te4−x Sex (0 ⩽ x ⩽ 0.5) near the superconducting transitions region measured under 10 Oe applied field. (d) Magnetization curves measured under 10 kOe for CuIr2Te4−x Sex (0.3 ⩽ x ⩽ 0.5).
Download figure:
Standard image High-resolution imageTable 1. Se content (x) dependence of the residual resistance ratio (RRR = R300K/R8K), superconducting transition temperature (Tc), and CDW transition temperature (TCDW).
| Se content (x) | RRR = R300K/R8K | Tc (K) | TCDW (K) |
|---|---|---|---|
| 0 | 4.16 | 2.50 | 187 |
| 0.025 | 4.34 | 2.48 | — |
| 0.05 | 4.87 | 2.58 | — |
| 0.075 | 3.70 | 2.61 | — |
| 0.1 | 5.88 | 2.83 | — |
| 0.15 | 3.49 | 2.82 | — |
| 0.2 | 4.16 | 2.71 | — |
| 0.25 | 3.02 | 2.68 | 100 |
| 0.3 | 2.71 | 2.50 | 108 |
| 0.4 | 1.81 | 2.05 | 116 |
| 0.5 | 1.87 | 1.94 | 131 |
The magnetic susceptibility measurement provides substantial evidence for bulk SC. The zero-field cooling temperature dependence of the normalized magnetization (4πχ) data under 10 Oe for CuIr2Te4−x Sex samples are given in figures 2(c) and S5, which display a diamagnetic behavior below Tcs. The change in TcS is found to be in good agreement with the electrical transport data, whereas the superconducting volume fraction is getting smaller with higher doping content. In particular, the superconducting volume fraction for those samples with the re-emergence of CDW-like transition for x ⩾ 0.25 is much smaller than those of other samples without CDW-like transition, suggesting the competition between SC and CDW-like transition. We further performed the magnetization hysteresis under 10 kOe from cooling and heating process as shown in figures 2(d) and S5, these compounds with x ⩾ 0.25 also exhibit the CDW-like related magnetic anomalies. The inset in figure 2(d) represents the cooling temperature differentiated magnetization (dχ/dT(T)) curves that have been used to define the values of TCDW. These values are in good agreement with those data derived from ρ(T) measurements.
With the purpose of revealing whether the abnormal hump is related to a structural phase transition, we have performed XRD measurements on the parent CuIr2Te4 and highest doping sample CuIr2Te3.5Se0.5 at 20 K, 100 K and 300 K. From figure 3, we can see that the three XRD patterns measured at different temperature are similar, which can be successfully indexed to the space group P3-m1. Thus, the abnormal hump is likely not linked to the structural transition. It indicates that there is no structural phase transition at low temperature, which differs from the case for IrTe2 where the resistivity anomaly has been proved associated to the structural phase transition from trigonal to monoclinic structure at cooling [18, 20, 51]. However, there is no strong CDW signal can be detected, which may be ascribed to the polycrystalline nature of our samples. We have also realized that it will be more clearly if the observed abnormal humps appear in the crystalline samples instead of the polycrystalline compounds. However, we have tried a few methods including self-flux method, vapor transport method and modified Bridgman method to grow the crystalline samples, but all failed to obtain the target crystalline samples so far.

Figure 3. Temperature-dependent PXRD patterns for the representative samples: (a) CuIr2Te4 and (b) CuIr2Te3.5Se0.5 at 20 K, 100 K and 300 K.
Download figure:
Standard image High-resolution imageTo further confirm the bulk SC in the CuIr2Te4−x
Sex
system, the optimal doping polycrystalline CuIr2Te3.9Se0.1 composition is characterized by low-temperature specific heat capacity (Cp) measurement. The main panel of figure 4(a) displays the plots of Cp/T against T2 for 0 and 10 kOe applied fields. A clear sharp anomaly in zero magnetic field is observed around 2.81 K as presented in the inset figure 4(a), which is close to that determined by the resistivity and susceptibility. Besides, the specific heat jump is suppressed upon the application of the magnetic field 10 kOe, indicating that the upper critical field for CuIr2Te3.9Se0.1 is less than 10 kOe. The zero-field specific heat above Tc can be well fitted to Cp/T = γ + βT2 (see the dashed red line in figure 4(a)), where γ is the constant of electronic contribution to the specific heat (Cel.) and β is the lattice constants in the second term of the phonon contribution (Cph.). γ value is about 10.84 mJ mol−1 K−2, and β value is near 3.51 mJ mol−1 K−4. Further, the Debye temperature (ΘD) can be calculated from the formula  , where n = 7 is the number of atoms per formula unit and R is the gas constant. ΘD value for the CuIr2Te3.9Se0.1 sample is 157 K. Hereafter, we calculated the electron–phonon coupling constant (λep) using the value of ΘD and Tc values from the inverted McMillan equation [52]:
  , where µ∗= 0.15 is the repulsive screened coulomb parameter. The value of λep is estimated to be 0.65. We then calculated the DOS at the Fermi level N(EF) from the formula
  , where kB is Boltzmann's constant. N(EF) is calculated to be 3.11 states/eV/f.u. (f.u. = formula unit), which is little higher then that of the pristine CuIr2Te4. The enhancement in the SC in CuIr2Te4−x
Sex
compounds can be explained according to the enhancement of the electron–phonon coupling (λep) and the increase of DOS of FS N(EF) by Se substitution as compared to the host CuIr2Te4. We calculated the specific heat jump ΔC (T = Tc) as the difference between the Cel. at Tc and the normal state (illustrated by the solid red line in the inset of figure 4(a). The normalized specific heat jump value ΔCel./γTc is estimated to be 1.51, which is slightly higher the Bardeen–Cooper–Schrieffer (BCS) weak-coupling limit (1.43), which confirm the bulk nature of SC in CuIr2Te3.9Se0.1.
, where kB is Boltzmann's constant. N(EF) is calculated to be 3.11 states/eV/f.u. (f.u. = formula unit), which is little higher then that of the pristine CuIr2Te4. The enhancement in the SC in CuIr2Te4−x
Sex
compounds can be explained according to the enhancement of the electron–phonon coupling (λep) and the increase of DOS of FS N(EF) by Se substitution as compared to the host CuIr2Te4. We calculated the specific heat jump ΔC (T = Tc) as the difference between the Cel. at Tc and the normal state (illustrated by the solid red line in the inset of figure 4(a). The normalized specific heat jump value ΔCel./γTc is estimated to be 1.51, which is slightly higher the Bardeen–Cooper–Schrieffer (BCS) weak-coupling limit (1.43), which confirm the bulk nature of SC in CuIr2Te3.9Se0.1.
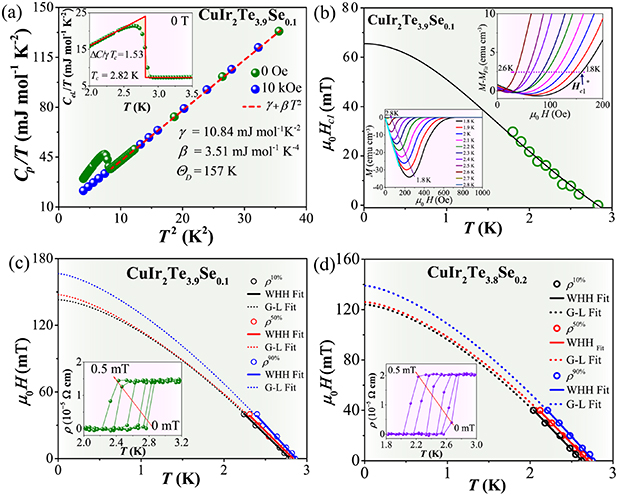
Figure 4. (a) Low-temperature Cp/T at zero (solid green circles) and 10 kOe field (solid blue circles) as a function of T2, the inset shows Cel/T vs T. (b) The lower critical field for CuIr2Te3.9Se0.1 with the fitting lines using the equation μ0
Hc1(T) = μ0
Hc1(0) . The bottom and upper insets illustrate the magnetic susceptibilities M(H) curves and M − MFit (H) at various temperatures, respectively. ((c) and (d)) The upper critical fields for CuIr2Te3.9Se0.1 and CuIr2Te3.8Se0.2. The data are extracted from ρ(T,H) and fitted by GL and WHH models for different criteria. The insets depict the temperature-dependent resistivity under different magnetic field ρ(T,H) curves for CuIr2Te3.9Se0.1 and CuIr2Te3.8Se0.2, respectively.
Download figure:
Standard image High-resolution imageSince the lower critical and the upper critical fields (μ0
Hc1(0) and μ0
Hc2(0)) are essential properties of superconductors, we next estimate the μ0
Hc1(0) and μ0
Hc2(0). As represented in figure 4(b), μ0
Hc1(T) for the optimal compound CuIr2Te3.9Se0.1 has been estimated from the magnetization isotherms in the temperature range 1.8 K–2.8 K (see lower inset of figure 4(b)). The profile of the M(H) curves points that CuIr2Te3.9Se0.1 is a type-II superconductor as evidenced by the linear shielding ('Meissner line') at low fields (see solid straight line in inset). Above ∼300 Oe, the shielding reduces as magnetic flux starts to penetrate the bulk and the system gets in the vortex state. To figure out the μ0
Hc1(0), we pursued the method which has been used before for different SC as demonstrated in the insets of figure 4(b). The demagnetization effect has been considered to get an accurate value of μ0
Hc1(0). We can get the demagnetization factor (N) value from the formula  , where
  is the slope of linear fitting (see the upper inset in figure 4(b)). The estimated value of N is 0.56. As shown in the lower inset of figure 4(b), the fitted purple linear line describes the Meissner shielding effects at low fields based on the formula MFit = fH + e (Meisner line) in the region of low magnetic fields, where f represents the slope of the linearly fitted M(H) data and e is the intercept. We can subtract Meissner line from the magnetization M for each isotherm (M − MFit (H)) to determine the value of μ0
Hc1
*. As depicted in the top inset in figure 4(b), μ0
Hc1
* values are determined from 1% M at the field when diverges below the fitted data (MFit). By considering N, we can obtain μ0
Hc1(0) from the expression:
is the slope of linear fitting (see the upper inset in figure 4(b)). The estimated value of N is 0.56. As shown in the lower inset of figure 4(b), the fitted purple linear line describes the Meissner shielding effects at low fields based on the formula MFit = fH + e (Meisner line) in the region of low magnetic fields, where f represents the slope of the linearly fitted M(H) data and e is the intercept. We can subtract Meissner line from the magnetization M for each isotherm (M − MFit (H)) to determine the value of μ0
Hc1
*. As depicted in the top inset in figure 4(b), μ0
Hc1
* values are determined from 1% M at the field when diverges below the fitted data (MFit). By considering N, we can obtain μ0
Hc1(0) from the expression:  . We can further calculate the μ0
Hc1(T) data using the formula: μ0
Hc1(T) = μ0
Hc1(0)
. We can further calculate the μ0
Hc1(T) data using the formula: μ0
Hc1(T) = μ0
Hc1(0) . The extrapolation of the μ0
Hc1(T) data down to T = 0 K yields the value μ0
Hc1(0) = 66 mT for CuIr2Te3.9Se0.1, which is almost 2.5 times larger than μ0
Hc1(0) of the parent CuIr2Te4 (28 mT, see table 2).
. The extrapolation of the μ0
Hc1(T) data down to T = 0 K yields the value μ0
Hc1(0) = 66 mT for CuIr2Te3.9Se0.1, which is almost 2.5 times larger than μ0
Hc1(0) of the parent CuIr2Te4 (28 mT, see table 2).
Table 2. Superconducting parameters of different ternary telluride chalcogenides compounds.
| Parameter Material | CuIr2Te3.9Se0.1 (This work) | CuIr2Te3.8Se0.2 (This work) | CuIr2Te4 [33] | CuIr1.95Ru0.05Te4 [58] | CuIr2Te3.9I0.1 [57] | Cu0.25Zn0.25IrTe2 [59] |
|---|---|---|---|---|---|---|
| Tc (K) | 2.83 | 2.71 | 2.5 | 2.79 | 2.95 | 2.82 |
| γ(mJ mol−1 K−2) | 10.84 | — | 12.05 | 12.26 | 12.97 | 13.37 |
| ß (mJ mol−1 K−4) | 3.51 | — | 1.97 | 1.87 | 3.03 | 1.96 |
| ΘD (K) | 157 | — | 190 | 193 | 165 | 190.6 |
| ΔC/γTc | 1.51 | — | 1.5 | 1.51 | 1.46 | 1.45 |
| λep | 0.65 | — | 0.63 | 0.65 | 0.70 | 0.66 |
| N(EF) (states/eV/f.u.) | 3.11 | — | 3.1 | 3.15 | 3.24 | 3.41 |
| μ0 Hc1(0) (mT) | 66 | — | 28 | 98 | 24 | 62 |
| μ0 Hc2(0) (mT) (ρN50% GL theory) | 148 | 127 | 145 | — | 232 | 198 |
| μ0 Hc2(0) (mT) (ρN50% WHH theory) | 144 | 125 | 120 | 247 | 188 | — |
| −dHc2/dTc (mT K−1) | 73.3 | 66 | 66 | 125 | — | — |
| μ0 HP (T) | 5.26 | 5.04 | 4.65 | 5.24 | 5.49 | 5.26 |
| ξGL (nm) | 47.18 | 51.34 | 52.8 | 36.3 | 41.9 | 40.7 |
The upper critical μ0
Hc2(0) for the CuIr2Te3.9Se0.1 and CuIr2Te3.8Se0.2 superconducting samples are estimated from low temperature ρ(T) data under different applied fields (between 0 and 500 Oe). The temperature-dependent resistivity is presented in figures 4(c) and (d). The resistivity transition gradually shifts to lower temperatures but seems to be a least susceptible to the applied magnetic field, indicating robust SC. The Tc at each magnetic field is extracted and plotted in the inset of figures 4(c) and (d). The derived μ0
Hc2(T) diagrams of CuIr2Te3.9Se0.1 and CuIr2Te3.8Se0.2 are plotted in figures 4(c) and (d), respectively. The values of μ0
Hc2(0) are determined through Ginzberg–Landau (GL) and Werthamer–Helfand–Hohenburg (WHH) theories. We calculated μ0
Hc2(0) values from the criteria 90%, 50% and 10% of superconducting transition in resistivity data (ρN) using the GL equation [53]:  . The μ0
Hc2(0) values from 50% ρN criteria are 148 and 127 mT, respectively. On the other hand, the μ0
Hc2 values calculated from the simplified WHH equation for the dirty-limit SC:
. The μ0
Hc2(0) values from 50% ρN criteria are 148 and 127 mT, respectively. On the other hand, the μ0
Hc2 values calculated from the simplified WHH equation for the dirty-limit SC:  [54, 55] where (dHc2/dTc) denotes the slope of μ0
Hc2(T) near Tc (the color solid line). The obtained values of μ0
Hc2(0) from WHH model for CuIr2Te4−x
Sex
(x = 0.1 and 0.2) from the 50% ρN criteria are 144 and 125 mT, respectively. The μ0
Hc2(0) do not surpass the Pauli limiting field for the weak-coupling BCS superconductors HP = 1.86 × Tc [56]. Therefore, the values of HP are estimated to 5.26 and 5.04 T, respectively. The Ginzburg–Landau coherence length (ξGL(0)) is extracted from this equation
[54, 55] where (dHc2/dTc) denotes the slope of μ0
Hc2(T) near Tc (the color solid line). The obtained values of μ0
Hc2(0) from WHH model for CuIr2Te4−x
Sex
(x = 0.1 and 0.2) from the 50% ρN criteria are 144 and 125 mT, respectively. The μ0
Hc2(0) do not surpass the Pauli limiting field for the weak-coupling BCS superconductors HP = 1.86 × Tc [56]. Therefore, the values of HP are estimated to 5.26 and 5.04 T, respectively. The Ginzburg–Landau coherence length (ξGL(0)) is extracted from this equation  [56] at the 50% criteria μ0
Hc2(0), where Ø0 = 2.07 × 10⁻³ T µm2 is the flux quantum. ξGL(0) values for CuIr2Te3.9Se0.1 and CuIr2Te3.8Se0.2 are 47.831 and 51.34 nm, respectively. Table 2 gives a sight about the physical properties of our present studied compounds as compared to other previous reported telluride chalcogenides.
[56] at the 50% criteria μ0
Hc2(0), where Ø0 = 2.07 × 10⁻³ T µm2 is the flux quantum. ξGL(0) values for CuIr2Te3.9Se0.1 and CuIr2Te3.8Se0.2 are 47.831 and 51.34 nm, respectively. Table 2 gives a sight about the physical properties of our present studied compounds as compared to other previous reported telluride chalcogenides.
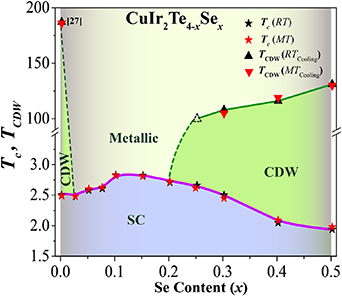
Figure 5 depicts the T(x) phase diagram of TCDW and Tc versus Se content (x) for CuIr2Te4−x Sex , showing CDW-like order, metallic state and superconducting phase edges. In the beginning, with increasing Se content x, the CDW-like order has vanished around x =0.025. The suppression of CDW-like transition first causes the enhancement of Tc and Tc reach to the highest value of 2.83 K at x = 0.1. Nevertheless, with a further increase of Se, the Tc decreases and gives rise to a weak SC dome-like phase diagram. Unexpectedly, the higher Se concentration (x > 0.2) induces the reappearance of CDW-like state with a lower transition value than that of the Se-free host material. Such tendency of CDW has been found by iodine doping for Te [57] but not by Zn doping in Cu site or Ru, Al, Ti doping in Ir site [58–60]. Thus, the CDW-like transition in this system seems to be dopant-dependent. Similar behavior has also been reported for Tl-intercalated Nb3Te4 single crystals [61], which is ascribed to the disorder in the quasi 1D Nb chains. Besides, Mx TiSe2 where M is 3d transition metal (M = Mn, Cr, Fe) systems also manifested analogous phenomena where CDW was first suppressed and then re-appeared with higher intercalation concentration, which is due to the deformation degree of Se–Ti–Se sandwiches [62, 63]. The re-occurrence of CDW is reported for 1T-TaS2−x Sex single crystals as well [64]. One additional case is 2H-TaSe2−x Sx (0 ⩽ x ⩽ 2), where a large dome-like superconducting phase diagram is accompanied by the appearance of CDW at two ends [25], where disorder played a significant role in the behavior of CDW and SC. On the other hand, RRR has been widely considered to be an indication of disorder a dirty superconductor [48–50]. It is also well known that RRR ratio is reduced in the dirty-band case [65–68]. However, in our case, RRR ratio increases with increasing doping content in the lower doping region from 0 to 0.1, while decreases as x arises in the higher doping region of 0.1 – 0.5. From figure 5, Tc increases as the CDW transition is suppressed and completely disappears, while the Tc decreases when the CDW transition reemerges and TCDW increased with the doping content. Overall, this system exhibits competing tendencies towards CDW and SC orders. Therefore, we suggest that the initial enhancement of the Tc and disappearance of the CDW is due to the increase of DOS at FS and the reemergence of CDW in over Se-doped region might result from the disorder scattering of Se-impurities and the decrease of DOS at FS because some portions of FS are removed by CDW gaping and consequently degrading superconducting Tc [68]. Yet, further theoretical and/or experimental studies need to prove it.
Figure 5. The phase diagram of Tc and TCDW versus Se doping content. The Tc data has been extracted from ρ/ρ300K (T) and χ(T). TCDW has been extracted from the cooling data of the zero-field ρ/ρ300K (T) and χ(T) under 10 kOe.
Download figure:
Standard image High-resolution image
4. Conclusion
In summary, our results highlighted the role of Se doping in SC and CDW-like states on CuIr2Te4−x Sex . We have successfully synthesized a series of CuIr2Te4−x Sex (0 ⩽ x⩽ 0.5) polycrystalline compounds. PXRD results from different temperatures demonstrate that the trigonal phase is stable at 20, 100 K and 300 K, indicating there is no structural phase transition at low temperature. By the means of the electrical resistivity, magnetic susceptibility and specific heat measurements of CuIr2Te4−x Sex (0 ⩽ x⩽ 0.5) compounds, it can be found that when Se substitution concentrations in the range of x⩽0.2, the Se substitution leads to the disappearance of the CDW-like state. Besides, a slight increase of Tc can be seen with the highest Tc of about 2.83 K for the optimal doping x = 0.10. However, further augmentation of the dopant content (x ≥ 0.25) caused the reappearance of noticeable anomalies in both resistivity and magnetization, indicating the CDW-like transition retakes place, which is highly related to the disorder effects created by selenium doping. Nevertheless, these findings call for further studies to determine the possible explanations behind this kind of behavior.
Acknowledgments
This work is supported by the National Natural Science Foundation of China (Grants No. 11922415), Guangdong Basic and Applied Basic Research Foundation (2019A1515011718), the Fundamental Research Funds for the Central Universities (19lgzd03), Key Research and Development Program of Guangdong Province, China (2019B110209003), and the Pearl River Scholarship Program of Guangdong Province Universities and Colleges (20191001). The work at IOPCAS is supported by the NSFC (12025408, 11921004, 11904391), the National Key R&D Program of China (2018YFA0305702). Y Y P is grateful for financial support from the National Natural Science Foundation of China (Grant No. 11974029).
Data availability statement
The data that support the findings of this study are openly available at the following URL/DOI: http://dx.doi.org/10.2139/ssrn.3761880.