

Abstract
The magnetization properties of the endohedral cluster superconductor Mo8Ga41 are studied by sensitive Hall-probe magnetometry. The temperature dependence of the lower critical magnetic field Hc1 is obtained and compared to theoretical models accounting for single-gap and two-gap superconductivity. Data can be described by both models with minor differences. These results are confronted with our previous measurements which evidence that the system is inherently single-gap s-wave superconductor but minor additional phases are present also in seemingly perfect samples. We discuss how presence of such additional phases with varying size of the penetration depth and Hc1 field is reflected in magnetization measurements which could lead to misinterpretation of the multigap superconductivity in Mo8Ga41.
Export citation and abstract BibTeX RIS
1. Introduction
The experimental discovery of two energy gaps in MgB2 [1] has spread wide interest in multi-gap superconductivity. Unconventional properties of various superconductors are often revised within this concept. However, not all systems, which are claimed to be multi-gap superconductors, withstand further investigations and subsequently the features attributed to this phenomenon find simpler and more conventional explanations. Experimental confirmation of multi-gap superconductivity thus requires a combination of very sensitive research methods that are capable to address various properties of the system.
One example of controversial two-gap superconductor is ZrB12. Several different methods were used to study this material, however, they brought inconsistent results. Coupling strength determination was one of the problems. Daghero et al [2] reported weak coupling from transport measurements. Simultaneously they observed strong coupling from point-contact spectroscopy. Similar observation was described by Tsindlekht et al [3], where weak coupling inferred from magnetization measurements condradicts the strong coupling results from their scanning tunneling microscopy. Pairing symmetry of this material remains also debatable. Point-contact spectroscopy and scanning tunneling microscopy from overmentioned studies show an s-wave pairing. On the other hand, Gasparov et al [4] states, that d-wave pairing is also possible in ZrB12. They suggested that discrepancies in previous reports may be related to inhomogeneous character of the sample caused e.g. by sample treatment before the experiment. Measurements of the superfluid density and the upper critical magnetic field have been explained by the two-gap superconductivity. Contrary, no signature of two-gap superconductivity was observed in heat capacity measurements by Lortz et al [5] nor in spectroscopic measurements by Daghero et al [2, 3].
In the same context of possible two-gap superconductivity, recent attention has been drawn to superconductor Mo8Ga41. Verchenko et al [6] presented in 2016 thermodynamic and transport measurements revealing strong-coupling superconductivity in this system. In 2017 muon spin relaxation measurements (µSR) on the same samples suggested multigap superconductivity [7]. This was followed by a report of Sirohi et al [8] who fitted the spectra obtained by the scanning tunneling spectroscopy on Mo8Ga41 by two gaps varying their size at different places on the sample surface. Our recent publication [9] brought a detailed study of the thermodynamic properties of this material using high-sensitivity ac-calorimetry as well as spectroscopic properties by applying scanning tunneling spectroscopy/microscopy (STS/STM) on large areas of the sample surface. This report clarified that Mo8Ga41 is inherently a single-gap superconductor and supposed two-gap features are just a reflection of domains or slight inhomogeneities present along the dominant phase even in the seemingly perfect sample. It is a consequence of the existence of the phases which are structurally very close to Mo8Ga41 [9].
Here we present a supplementary study of this superconductor using local Hall probe magnetometry performed on the same piece of crystal as in our previous report [9]. We show that also the lower critical magnetic field might be affected by surface inhomogeneities of the sample and mimic the two-gap behavior.
2. Experimental details
Mo8Ga41 crystals of submillimeter size were prepared using the flux growth method. Synthesis details and crystal analyses can be found elsewhere [6].
The local magnetometry was performed using array of miniature Hall probes based on semiconductor heterostructures GaAs/AlGaAs with two-dimensional electron gas as an active layer. A chip contained eight probes arranged in a line with the distance of 25 µm between two neighboring probe centers. Dimensions of each probe were 10 × 10 µm2. The sample was placed on top of the probe array and mounted in the 3He refrigerator. Horizontal superconducting 8 T magnet generated magnetic field perpendicular to the Hall probe surface. Probes were serially powered by a bias current of 10 µA. The voltage measured across each probe was proportional to the local magnetic induction B of the measured sample. Before each measurement the sample was cooled down in zero magnetic field to ensure absence of vortices being trapped in the sample. During the measurement, applied magnetic field H is increased gradually and voltage response of each probe is recorded. When the sample is in an ideal diamagnetic state, magnetic field does not penetrate the sample. The probes are shielded from the field by the sample so that no Hall voltage is detected. When the magnetic field near the sample edges reaches the lower critical magnetic field, Hc1, first vortex penetrates the sample. This is reflected in an increase of the magnetic induction read by the Hall probe at the location where this first vortex is settled. Due to the higher density of magnetic field lines around the sample edges, the value of Hc1 is higher than the applied magnetic field, which is at the point of vortex penetration defined as the penetration field, Hp . To obtain a real lower critical field Hc1 from the penetration field, it is necessary to consider mechanism of vortex penetration into the sample and take into account its shape, i.e. the demagnetization factor.
3. Results and discussion
To address the lower critical magnetic field, Hc1, it is necessary to determine the region of the sample where superconducting vortices accumulate after penetration into the sample. Two main scenarios may occur affecting the spatial distribution of the magnetic induction B within the sample [10]. In the case that there are pinning centers present in the sample, vortices are trapped right after they penetrate inside. As a result, they are accumulating near the sample edges. Magnetic profile of the sample is V-shaped and the appropriate position for Hp measurements is close to the sample edge. When pinning is weak vortices move to the center of the sample due to the repulsive interaction with the superconducting current flowing beneath the surface of the superconductor. This is characterized by a dome-shaped magnetic field profile and suitable location to measure Hp is in the center of the created dome.
By simultaneously recording the Hall voltage on all probes in the gradually increasing field, we constructed magnetic profiles of the sample as shown in figure 1. The sample was wider than the length of the Hall probes array, therefore it was necessary to measure the profiles by parts. The profiles in the figure 1 were constructed from measurements at 2 K in two overlapping sample positions. The edge and the center of the sample are shown as vertical dashed lines. Each curve represents a magnetic profile at the given applied field from 0 to 40 mT. The probes on positions 0–2 were located outside the sample. The probes on positions 3–13 were covered by the sample and recorded the perpendicular component of its magnetic field induction B. The profiles are V-shaped, which means that there is strong pinning inside the sample. Detailed analysis including the calculation of the pinning strength can be found in [11]. Due to the strong pinning, Hp was measured near the edge of the sample at the position A highlighted by a shaded box in figure 1. The distance of position A from the sample edge is equal to d/2, where d is the sample thickness. The choice of the location to measure Hp was based on the following description of the vortex penetration mechanism by Brandt et al [10]. Already a small magnetic field surrounding superconductor is deformed and partially extends into the edge regions of the sample. These regions can spread deeper into the sample and farther from its edges with increasing magnetic field. When they meet in the middle of the sample side at the distance of d/2 from the edge, a complete superconducting vortex is formed. If its movement is prevented due to the strong pinning, the first complete vortex can be then detected by the probe located in the distance of d/2 from the sample edge.

Figure 1. Magnetic profiles of the sample measured at 2 K for increasing applied magnetic field. Dashed lines correspond to the edge and center of the sample. Points depict magnetic induction B across the sample at different applied magnetic field (different colors). Lines are a guide to the eyes. Shaded box highlights the evolution of B on a Hall probe at the chosen distance to the sample edge (see text for more details).
Download figure:
Standard image High-resolution imageTemperature dependence of Hp
was determined from B(H) curves measured at different temperatures from 0.45 to 9 K. They are shown in figure 2. To construct Hp
dependence, we used two distinct approaches. In the first direct approach, at a given temperature we consider Hp
to be the magnetic field H when induction B begins to deviate from zero. In order to highlight this deviation even more, we used the second approach and investigated the square root of the data. Both ways led to the same Hp
(T) dependence. Lower critical magnetic field Hc1 is related to Hp
through  [12], where d = 162 µm and 2w = 330 µm are the thickness and the width of the sample, respectively, a is related to the sample geometry. The sample length is comparable to its width, therefore we considered the sample to be of disc-like shape and used a = 0.67. Figure 3 shows the temperature dependence of the lower critical magnetic field Hc1 (black dots) as obtained from Hp
. It saturates near low temperatures to the value Hc1(0) = 29.2 mT. We checked also the probe next to the position A (probe No. 7)—the saturation value is different only by 2 mT and no significant difference in the course of the dependence was found. There is unfortunately no calculation of demagnetization factor for square-like geometry and the correct coefficient a probably lies between the one calculated for disks and the one obtained for infinite stripes (see for instance [13]). In this second limit (infinite stripes) one would have obtained Hc1 ~ 36 mT, being only about 20% higher than the value presented in the paper. Still it is important to note that this correction factor will absolutely not change the temperature dependence and hence the conclusions of the paper. Obtained temperature dependence of our local Hall probe method is practically identical with that observed in previous study [6] using global method of magnetization measurements. In that case, five crystals with random orientation were glued together in order to obtain reasonable signal, therefore no demagnetization effect was taken into account. Hence the saturation value Hc1(0) is reduced compared to our recent results. Minor contribution to this difference might also be related to the difference in the method, since global measurements averaging over the whole sample volume often lead to underestimation of Hc1.
[12], where d = 162 µm and 2w = 330 µm are the thickness and the width of the sample, respectively, a is related to the sample geometry. The sample length is comparable to its width, therefore we considered the sample to be of disc-like shape and used a = 0.67. Figure 3 shows the temperature dependence of the lower critical magnetic field Hc1 (black dots) as obtained from Hp
. It saturates near low temperatures to the value Hc1(0) = 29.2 mT. We checked also the probe next to the position A (probe No. 7)—the saturation value is different only by 2 mT and no significant difference in the course of the dependence was found. There is unfortunately no calculation of demagnetization factor for square-like geometry and the correct coefficient a probably lies between the one calculated for disks and the one obtained for infinite stripes (see for instance [13]). In this second limit (infinite stripes) one would have obtained Hc1 ~ 36 mT, being only about 20% higher than the value presented in the paper. Still it is important to note that this correction factor will absolutely not change the temperature dependence and hence the conclusions of the paper. Obtained temperature dependence of our local Hall probe method is practically identical with that observed in previous study [6] using global method of magnetization measurements. In that case, five crystals with random orientation were glued together in order to obtain reasonable signal, therefore no demagnetization effect was taken into account. Hence the saturation value Hc1(0) is reduced compared to our recent results. Minor contribution to this difference might also be related to the difference in the method, since global measurements averaging over the whole sample volume often lead to underestimation of Hc1.

Figure 2. B(H) curves at various temperatures (0.45, 0.6, 0.8, 1, 2, 3, 4, 5, 6, 7, 8, 9 K) for rising magnetic field H used for construction of temperature dependence of Hc1 (measured at position A of the magnetic profile; see figure 1). Initial linear slopes in the raw curves due to non-zero distance between sample and probes were subtracted.
Download figure:
Standard image High-resolution image
Figure 3. Temperature dependence of the lower critical field Hc1. Black points depict experimentally obtained values, while blue and red lines are theoretical fits for the coupling ratio 3.0 and 4.4, respectively. Green dashed line is the linear combination of two curves for coupling ratio  and 4.0 with weights 0.4 and 0.6, respectively.
Download figure:
Standard image High-resolution imageWe compared the data with a theoretical model for a single-gap as well as for a two-gap superconductor with the s-wave symmetry of the energy gap. In a dirty limit, temperature dependence of lower critical magnetic field can be described using the following formula [14]:
where λ is the penetration depth and Δ, the superconducting energy gap, is the only fitting parameter. For the two-gap model, the final curve is a sum of two contributions corresponding to the two energy gaps Δ1, Δ2, with weights ω1 and ω2, respectively, where ω1 + ω2 = 1.
The red line in figure 3 is a model curve corresponding to a single-gap superconductor with the coupling ratio  4.4, the value that was determined previously from the heat capacity measurements [9]. This curve does not describe the measured data well, as they tend to saturate at much lower temperatures than what would be expected from the theory. Such behavior usually implies that the energy gap of the system is much smaller. Indeed, the agreement of the data and the single-gap model is obtained for the coupling ratio
  3.0 (blue line in figure 3). However, this value is significantly smaller than the BCS weak coupling limit
  3.52. Good agreement with the data can be obtained also for the two-gap model. Green dashed line in figure 3 is result of the linear combination of two curves with coupling ratios
  2 and 4, and respective weights 0.4 and 0.6.
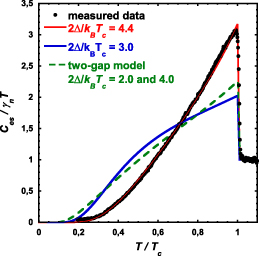
In figure 4 we show the experimental data of the electronic contribution to the heat capacity in superconducting state Ces
from [9] calculated as  (black dots) as well as the fits to the α-model which defines the heat capacity of the superconductor with the alpha staying for the coupling ratio
  as the fit parameter [15].
Figure 4. Electronic heat capacity from [9] (black points—only every 5th point is shown for clarity) compared to theoretical α-model (lines). Red and blue line: single-gap fits with the coupling ratio  and
and  respectively; green dashed line: two-gap model fit with coupling ratios of the two energy gaps
  2.0 and 4.0, and respective weights 0.4 and 0.6.
Download figure:
Standard image High-resolution image
Solid lines in figure 4 represent model curves of the heat capacity for different coupling ratios. Red line appertain to the single-gap model with the coupling ratio  4.4 and as presented previously [9] fits the data perfectly. Blue line is a fit with
  3.0 and green line is a linear combination of two theoretical curves corresponding to two energy gaps with coupling ratios 2.0 and 4.0, and relative weights 0.4 and 0.6, respectively. Obviously, the only possible fit of the data is that with a single s-wave gap with
  4.4.
4.4.
In our previous study [9], performed on the same crystal as is inspected here, we showed that in the sample small inhomogeneities exist due to which some physical properties exhibit two-gap-like behavior. As a matter of fact, we suppose there are two types of these inhomogeneities. The STM tunneling spectroscopy measurements in the study brought evidence that the surface of the same sample is covered by a distribution of the phases with superconducting energy gap strongly varying from 0.4 to 1.75 meV, and related to that with strong variation of local Tc . It was proposed that these impurities may be related to existence of several phases close to Mo8Ga41, and Mo6Ga31 is one example. However, these phases represent only negligible portion of the sample volume, since they are not reflected in the heat capacity measurements, nor they are observed in x-ray analysis. The ac calorimetry which we use is extremely sensitive capable to detect changes smaller than 1% of the total signal. As can be seen in the experimental data presented in figure 4, the superconducting transition is almost perfect without any hint of additional phases with lower Tc . On the other hand, heat capacity measurements in magnetic field reveal a presence of tiny additional bulk phase with the same critical temperature but different upper critical magnetic field, probably due to different purity, as diminished mean free path l leads to increase of Hc2. This is reflected in a minute peak/hump following the main heat capacity anomaly/jump at the transition temperature above 3 T. Both types of inhomogeneities, with different Hc2 or Tc , are characterized by lower Hc1 compared to the main phase. Penetration depth is usually found to increase with decreasing l leading to lower Hc1 for the former case. Also, for Mo6Ga31 it was verified experimentally in [16] that Hc1 is significantly reduced compared to that of Mo8Ga41.
The Hall probes used in our measurements have a size of 10 × 10 µm2 thus they average the signal over this area of the sample covering the probe. Measured Hc1 then depends on how the magnetic field penetrates the sample i.e. it will depend on how the phases are intertwined and where the Hall probe is located in respect to them. If, for example, there would be a boundary of different phases above the Hall probe, the probe would be sensitive to the phase with lower Hc1. In our previous spectroscopic measurements we observed that spectra taken at the boundary of two phases with the distinct gaps could be read as a text book example of two-gap tunneling spectra but it is just an (un)happy coincidence. We think that, similarly, the temperature dependence of the lower critical magnetic field reflects the effect of penetrating field at places with varying Hc1.
4. Conclusions
In conclusion, we performed local magnetometry study of superconductor Mo8Ga41 using miniature Hall-probe array, as a supplement to our previous thermodynamic and spectroscopic measurements of the system. Observed temperature dependence of Hc1, which is proportional to the superfluid density, reveals seemingly two-gap-like behavior. However, our previous detailed study and analysis of heat capacity and tunneling spectra provided clear evidence of conventional single-gap superconductivity in Mo8Ga41 hidden behind multiphase effects in the sample. Ignoring these effects leads just to misinterpretation of the data. We think that superfluid density measured in Mo8Ga41, but it may happen in other system with local inhomogeneities as well, does not reflect intrinsic properties of the sample and only mimics the two-gap behavior in a single-gap superconductor.
Acknowledgment
This work was supported by the EU ERDF (European regional development fund) Grant No. ITMS26220220186, by the Slovak Research and Development Agency, under Grant No. APVV-16-0372, by Slovak Scientific Grant Agency under Contract VEGA-0058/20 and by the U.S. Steel Košice, s.r.o.