

Abstract
The transport property ( ) and flux motion together with the superconductivity of
  Fe
Fe Se2 single crystals are studied. In the transport measurement, contrasting behavior is observed under two different magnetic field orientations, i.e.,
  and
and  , which is ascribed to different vortex configurations. In the flux motion study, the tail of the
  well fits the description of the vortex-glass (VG) critical behavior, which is confirmed by VG scaling. The strong pinning nature of
  Fe
Fe Se2 implies great sustainability under high magnetic fields and the potential for practical application of the system. The
  relation under Tc follows Arrhenius thermally activated flux flow (TAFF) behavior. The existence of a crossover behavior in a magnetic field is discovered via the magnetic dependence of the effective pinning barrier, which is related to the change in pinning strength of the point defects and the entanglements of the flux lines. Finally, a vortex phase diagram is proposed based on the evolution of upper critical field and other dynamic characteristics.
Export citation and abstract BibTeX RIS
1. Introduction
Since the discovery of SmOFeAs [1], the intense interest in iron-based superconductor research has lasted for a long time. On the one hand, the transition temperature(Tc) of Gd ThxFeAsO [2] has reached as high as 56 K, far surpassing the MacMillan limit, which makes iron-based superconductors the second system of high temperature superconductors (HTS). On the other hand, although the structure of the iron-based superconductors highly resembles that of cuprates, the transport property behavior differs. Therefore, iron-based superconductors are regarded as interesting subjects to explore, in the hope of increasing the understanding of the mechanism of superconductivity of cuprates. Amongst them, the FeSe compound, which is solely built by alternatively intercalating the FeSe layers, has the simplest structure. Because of the simple layered structure, it is considered as an ideal subject for doping and intercalation. In previous reports, we mentioned the potential application of AxFe
 Se2 (A = K, Rb, Cs, and Tl) superconductors. The series display great robustness against a magnetic field, with its
  reaching over 180 T [3], which is rather rare in HTS. This gives rise to both the great potential of practical applicability in extreme conditions, and important references for designing a new type of high
  superconductors. It is even more striking when one realizes that all compounds of this family share the feature of phase separation [4]. Actually, 80% of the volume is anti-ferromagnetic, displaying nonsuperconductivity, according to the Mossbauer experiment [5]. It seems both entrancing and confusing when one tries to comprehend the mechanism behind the surprisingly high
  with the superconducting phase occupying only 20% of the whole volume. All of the above renders it especially essential to investigate its flux behavior to understand the mechanism.
The vortex-glass (VG) model [6, 7] is usually applied to describe the flux behavior of strong pinning systems, and is obeyed by all cuprates found so far [8–10]. The theory proposes a critical temperature(TM). The superconductor undergoes a vortex-solid to vortex-liquid phase transition when temperature rises above TM, i.e. there exists a VG melting line, which draws the outline of the transition boundary. The line could be determined by the temperature-dependent irreversible line obtained from magnetization measurement. A scaling rule is often utilized to judge the suitability of the VG model for the material. It is worth mentioning that although the applicability of the VG theory is confirmed by cuprates, its suitability for superconductors other than cuprates, especially iron-based superconductors, has been doubted [11]. All of the above renders the clarification of the applicability of the VG model for the AxFe Se2 system is rather important and necessary to understand the mechanism of the flux dynamics of iron-based superconductors.
In this article, we present a comprehensive investigation of the transport property ( ) and current-voltage characteristics (I − V) of high quality single crystals
  Fe
Fe Se2. Measurements are performed with the magnetic field perpendicular and parallel to the ab-plane of the sample, respectively, within the field range of 0–14 T. Typical tail effects are observed, in accordance with the characteristic of strong pinning, which effectively hinders the flux flow. A phase diagram is drawn according to the analysis of the flux flow behavior and scaling of the I − V isotherms.
2. Experiment
Single crystals of  Fe
Fe Se2 were grown following the procedure mentioned previously [12] via the self-flux method. High-purity powder of iron (purity 3N) and selenium (purity 3N), and high-purity potassium slices (purity 3N), used as starting materials, were mixed stoichiometrically (K : Fe : Se = 1.0 : 1.8 : 2.0) and thoroughly ground. The mixture was then pelletized and sealed into an evacuated quartz tube. The tube was sealed into a larger quartz tube followed by evacuation, in case it cracked during heating. The furnace was heated to 600 °C, and maintained for 10 hours, then the temperature was raised to 1050 °C, and maintained for 24 hours. With a rate of 2 °C/h, the mixture was slowly cooled down to 600 °C before furnace cooling. The obtained crystals were shiny on the surface. They were characterized by both powder x-ray diffraction (XRD) and the single crystal XRD with Cu
  radiation at room temperature. With the aid of energy dispersive x-ray spectrometry (EDX), the actual composition of the sample is determined to be
  Fe
Fe As2. Four different areas were chosen in each sample when conducting the EDX measurement, and the average value was calculated to determine the actual composition. Via a standard four-probe method, the DC resistivity was measured with a constant current of 1 mA. In the resistivity measurement, the samples were first cut into rectangle shapes with typical dimensions of about 5 × 3 × 0.3 mm3. In the I-V measurement, one unavoidable issue is the Joule heat, which causes obvious lift of the temperature, and therefore, damages the reliability of the isotherm. In order to solve this problem, we tailored the single crystal into a proper size to restrict the resistance to a small value. All isotherms employed in the scaling remain in a narrow temperature range of less than 0.1 K.
3. Results and discussion
Figures 1(a) and (b) present the temperature dependence of the resistivity of the  Fe
Fe Se2 under a varied magnetic field ranging from 0–14 T, with the field oriented parallel and perpendicular to the c-axis. The detailed orientation procedure has been reported elsewhere [3]. In the zero field, with a criterion of 10%–90% of the normal state resistivity (
 ), the sample shows a superconducting transition at around 30.46 K, with a narrow transition width of less than 1 K. When
  , the curve near the onset of the transition is evidently broadened as the field increases. A typical tail effect is also easily observed near the completion of the transition, and becomes more evident under larger fields. Interestingly, none of the above phenomena exists when
  . The case highly resembles the condition of the iso-structure (Ba, K)Fe2As2 [13]. The tail effect is commonly seen in cuprates [14, 15], which could be ascribed to many reasons, e.g. the anisotropy of the superconductivity, the connectivity, and most importantly in this case, the vortex motion. As shown in the upper left insets of figures 1(a) and (b), the configuration of the vortex differs with different field directions [3]. The vortex appear as 'pancake' vortices when
  , and as vortex strings when
  . This profoundly affects the vortex dynamics and thermal fluctuations. Both the broadening behavior and the tail effect are tuned by thermal fluctuations, the magnitude of which is characterized by the Ginzburg parameter [16]. The intersecting point of the extrapolating lines of the normal state resistivity and the steep transition regime, Tc under different field strengths and orientations can be determined from figure 1, and therefore, the
  and anisotropic ratio (γ) are calculated. The temperature dependence of γ is displayed in the lower left inset of figure 1(b). γ monotonously decreases with descending temperature, which is in accordance with previous reports of both FeSe [17, 18] and FeAs-211 [13] samples. The
  and γ behavior is argued to be attributed to the Pauli paramagnetic effect, which is aroused and tuned by the Fe vacancies [19].
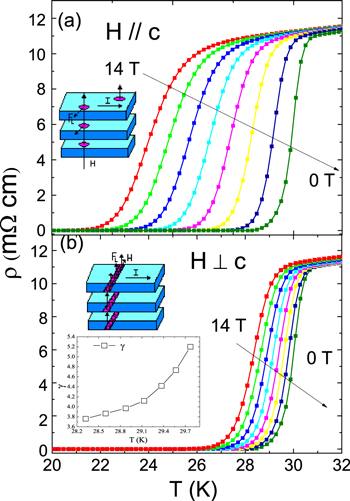
Figure 1. (a) and (b) The temperature dependence of the resistivity  of
of  Fe
Fe Se2 single crystals under a varied magnetic field (a)
  and (b)
  ranging from 0–14 T. The upper insets illustrate the vortex configurations under the corresponding field orientation. The lower inset of (b) displays the temperature dependence of anisotropic ratio γ.
Download figure:
Standard image High-resolution imageAnalysis of the ρ-T curves is based on the thermally assisted flux flow (TAFF). In this regime, the resistivity can be described by

where U is the thermally activation energy. Assuming the prefactor  to be temperature independent, we could simplify the equation to an Arrhenius relation
 , where
  is a temperature independent constant and
  is the apparent activation energy, which plays the role of effective pinning barrier. Moreover, it is noted that
  , which renders the linear relation of
  versus
  in the TAFF region with the slope equaling
  and the intercept equaling
  . It is worth noting that
  is often as large as 104 K for iron-based superconductors [20, 21], as in our case. By presuming a temperature-dependent prefactor [22],
  is even reported to reach 105 K. However, it must be mentioned that
  extracted from TAFF model is always one order greater than that determined by the irreversible region from flux creep or a modified VG model [23–25]. It it noted that
  is closely dependent on current density according to the results of the magnetization relaxation [23, 26], thus the current density of the measurement might exert an influence on the obtained effective
  values. Only when the superconducting current J = 0 in the flux flow region, should one expect
  deduced from TAFF model to be of the same order as
  (
( ) obtained from flux creep.
The Arrhenius plots of the  -
- relation under different magnetic fields, namely from 0.3–14 T, are displayed in figures 2(a) and (d), corresponding to
  and
and  , respectively. It is clearly observed that the Arrhenius relation fits the experiment data very well. Every two extrapolations of the
  lines cross at the same point, approximately equal to Tc, which is also seen in other iron-chalcogen superconductors [27]. In the upper right insets of figures 2(a) and (d), we display the linear fits of
  versus
  , from which we deduce the prefactor
  and Tc under two magnetic field orientations. Field dependence of the effective pinning barrier is investigated, the
  -T relation is shown in the lower left insets of figures 2(a) and (d).
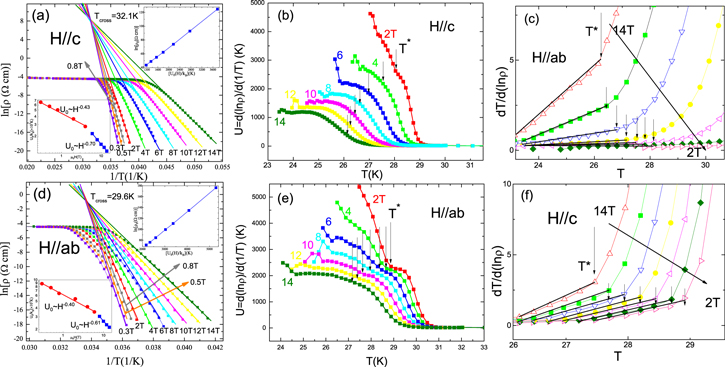
Figure 2. (a) and (d) The plots of the  -
- relation under various fields for (a)
  and (d)
  . The corresponding fitting lines are the Arrhenius fitting results. The upper right insets display the
  relations extracted from the fittings. The lower left insets show the magnetic field dependence of the activated energy
  . (b) and (e) The temperature dependence of the activation energy
  defined as slope of the Arrhenius fitting in figures 2 (a) and (d) for (b)
  and (e)
  .
.  is marked by an arrow for each curve, signifying the upper critical temperature of the VG critical regime. (c) and (f)
  versus T relation for (c)
  and (f)
  .
.  values are denoted by downward arrows. The slope of the linear region are shown in solid lines, which equals
  .
.
Download figure:
Standard image High-resolution imageWhen  , it is clear that the relation follows a power law of
  , with various α values as the magnetic field increases. Below 5 T, the dependence relation is described by
  , while
  when
when  is above 5 T. The case is similar when
  . It should be noted that such behavior highly resembles that which happens to anisotropic cuprates [28, 29] and NdFeAsO
 F
F single crystals [30]. For cuprates such as BSCCO, the behavior was well explained by the dimensional-crossover of the vortices, where the crossover field (H
 ) required for a 3D-2D cross was rather small, approximately 2 T. However, for the
  Fe
Fe Se2 sample, the
  is much larger. As
  , where γ is around 4–5 according to figure 1, and the superconducting interlayer distance δ is around 0.8 nm,
  for the
  Fe
Fe As2 sample should be around 500 T. Therefore, no dimensional-crossover happens during the
  measurement. On the other hand,
  undergoes an increase instead of a reduction as the magnetic field ascends, thus the
  -T relation cannot be explained under the presumption of elastic creep theory [31, 32]. Instead, a plastic creep model [33] offers a reasonable explanation. As a larger field is applied to the sample, the correlation length undergoes a reduction as a result of plastic deformation and vortex entanglement. Therefore, vortex coupling is weaken and
  needed becomes smaller. From the lower inset of figures 2(a) and (c), we can see it clearly. We would take figure 2(a) for instance. The vortices entangle in weakly pinned vortex-liquid when the field is weaker. As in the case of
  with smaller α,
  drops more slowly with an increasing field, which is shown as red circles. While it comes to strongly pinned vortex-liquid when a stronger field is applied and
  drops faster with larger α, as in the case of
  , which is displayed as blue squares. It has to be mentioned that in the cross of α value, the intrinsic pinning centers mainly composed of point defects play the crucial role, the entanglement of vortex lines around which introduce lateral vortex wandering in the strongly pinned vortex-liquid phase.
In isotropic FeSe and relatively slightly anisotropic doped Fe-chalcogenides, a tiny value of α is often seen in the low magnetic field regime (usually lower than 1 T) [34, 35], before a crossover appears at higher fields. It is often utilized as a rule to judge the mechanism of flux creep that if  in the low field region, and U0 remains almost irrelevant to H, then single flux creep is dominant in the regime. As the magnetic field ascends, U0 becomes highly dependent on H with a much larger α. The vortex spacing is significantly smaller than the penetration depth, and collective vortex creep becomes the main mechanism. According to our data, the crossover of α resembles that of SmFeAsO
 [36], as U0 is obviously related to H until 0.3 T.
In figures 2(b) and (e), the relations of activation energy versus temperature are displayed for  and
and  , respectively. U is extracted from the slope of the Arrhenius plot as
  . For any field value, one can observe that from a certain critical temperature
  , the corresponding U plot starts to climb fast with decreasing temperature, in accordance with previous reports for cuparates [37]. The upturn of U denotes the upper temperature limit of VG critical state region [37].
To further verify the  value, we plot the
  versus T relation in figures 2(c)and (f), corresponding to
  and
and  , respectively.
  under varied fields is marked by downward arrows, below which a linear behavior is observed for each field. The slope of the linearity renders the value of exponent
  for each field, where z is the dynamic critical exponent, and ν is the static exponent, while the critical temperature TM, as denoted by upward arrows, are determined by the 0 line of
  , which we will expand on a bit later.
The existence of a VG state in the  Fe
Fe Se2 sample is revealed by both the
  behavior and the upturn of the U-T curve. But to further confirm it, we investigate E-J isotherms under a varied magnetic field ranging from 2–14 T, in different field orientations. The data are displayed in double logarithmic coordinates in the insets of figures 3(a) and (b), for
  and
and  , respectively. As in the case of cuprates [8–10], a straight line could be found amongst the isotherms, which corresponds to the critical temperature TM. TM is around 25 K when
  , and 26.2 K when
  , as marked by arrows in the insets of figures 3(a) and (b). According to the VG model, the vortex-glass state melts into vortex-liquid once the temperature rises above TM. To clarify the existence of the phase transition, we apply a universal scaling to the isotherm data. Upon estimation of the dynamic critical exponent z, static exponent ν and dimension d (2 or 3), the E-
J isotherms under transformation collapse into two distinct branches, denoted by
, as marked by arrows in the insets of figures 3(a) and (b). According to the VG model, the vortex-glass state melts into vortex-liquid once the temperature rises above TM. To clarify the existence of the phase transition, we apply a universal scaling to the isotherm data. Upon estimation of the dynamic critical exponent z, static exponent ν and dimension d (2 or 3), the E-
J isotherms under transformation collapse into two distinct branches, denoted by  and
and  . It must be mentioned that the quality of the scaling, i.e. whether the isotherms with the same curvature sign are neatly scaled onto a single branch, highly depends on the choice of scaling parameters. The estimation of parameter ν is based on the behavior of the linear resistivity
  .
.  at the edge of entering into the VG phase, while z is deduced from
  near TM. The coordinates of the scaling are written as


Figure 3. (a) and (b) The VG scaling for the E-
J curves of  Fe
Fe Se2 by equations (2) and (3) under a 10 T field for (a)
  and (b)
  . The best fitting parameters are in the comments. The insets display the E-
J curves in their double logarithmic coordinates under a 10 T field for (a)
. The best fitting parameters are in the comments. The insets display the E-
J curves in their double logarithmic coordinates under a 10 T field for (a)  and (b)
  .
.
Download figure:
Standard image High-resolution imageDozens of different parameter sets were carefully tried out for each magnetic field value and orientation to obtain the best scaling. In figures 3(a) and (b), we only display the most appropriate scaling results for the isotherms measured under the 10 T field from  and
and  , respectively. As is easily observed, isotherms of temperature higher (lower) than TM all collapse onto
  (
( ) smoothly. Under a varied magnetic field ranging from 2–10 T, the critical exponents of the best scaling are all confined in the narrow regime of
  and
and  . It should be clarified that only isotherms under
  were used for the scaling, as marked in figures 2(b) and (d). The reason was explained above. Also, a threshold Eg was taken for the isotherms before scaling, as the VG model only describes the behavior in the regime neighboring the vortex-glass to vortex-liquid transition. Thus, the portion related to the high dissipation region, i.e. the portion of curves with corresponding
  should be excluded from the scaling [13, 38]. Actually, data with a higher E value belong to the region of the 'unpinned vortex-liquid state', where the influence mechanism of the pinning center towards vortex behavior is different.
It is necessary to point out that different from other iron-based superconductors, the E-J curves measured for  Fe
Fe Se2 seems to be based on filamentary superconductivity, as we could observe low Jc values as shown in figure 3. In the preparation of
  Fe
Fe Se2 single crystals, it was found that the relation between the superconducting and the insulating phase is very delicate. The fabrication of superconducting
  Fe
Fe Se2 samples demands strictly controlled procedures, either an overdose of iron or improper annealing will bring a larger percentage of insulating phase. Interestingly, superconductivity could be recovered by either iced quenching or vacuum annealing, reflecting the tuning effects of iron vacancies. According to previous reports, the weak coupling between the superconducting islands could be weakened severely under magnetic penetration in the high temperature region [4]. However, great robustness against the magnetic field is clearly detected in our sample, and VG behavior is revealed based on the superconducting filaments. All of the above makes the interpretation of the exact view of phase separation and its influence on the flux dynamics of the AxFe
 Se2 family both essential and urgent.
In figures 4(a) and (b), we display a static vortex phase diagram of  Fe
Fe Se2 extracted from the evolution of Hc and TM (HM) with the varying magnetic field. The diagram is similar to that of the cuprates, where effects of thermal fluctuation and pinning were both included.
  denoted by green triangles is determined by 90% of
  as mentioned, above which the sample enters into the normal state. Well below
  , a vortex-solid to vortex-liquid phase transition is observed. Marked by red squares, the characteristic magnetic field HM, which is deduced from the scaling, divides the VG critical state into vortex-glass and vortex-liquid regimes. The upper field limit of the VG model applicable regime is given by
  , as shown in yellow dots.
  is inversely obtained from
  , which is decided by
  versus the T curves, as displayed in figures 2(b) and (d). The
  line cut the vortex-liquid phase into the pinned liquid phase and unpinned liquid phase. The latter outranges the description of the VG theory, and therefore is excluded from the scaling. Finally, investigation of the
  -T relation reveals the existence of a crossover field, which is around 5 T when
  and around 7 T when
  . According to the plastic-flux-creep model, it separates the pinned vortex-liquid phase into a strongly and weekly pinned vortex-liquid phase by different dynamical characteristics.

Figure 4. Static vortex phase diagrams displaying the vortex-glass phase to vortex-liquid phase transition under varied magnetic fields ranging from 0–14 T (a) along and (b) perpendicular to the c-axis.  determined from 90% of
  is denoted by green triangles. The upper field limit of the VG critical regime
  is shown in yellow dots. The characteristic field HM marking the vortex-glass to vortex-liquid transition is shown in red squares, which is deduced from the scaling. The crossover field denoted by a line is determined by the magnetic field's dependence on the activated energy
  .
.
Download figure:
Standard image High-resolution image
4. Conclusion
To summarize, based on TAFF and the VG model, we have studied the vortex motion of  Fe
Fe Se2 single crystals under
  and
and  up to 14 T. Due to different vortex configurations, a drastic contrast exists between the transport property of the two magnetic field orientations. The investigation of E-J isotherms and the
  relation reveal the existence of a VG state. As in the case of cuprates, a vortex-glass to vortex-liquid state transition is observed well below
  in the phase diagram and confirmed by E-
J scaling under both field orientations. The
in the phase diagram and confirmed by E-
J scaling under both field orientations. The  curves clearly display Arrhenius behavior with a crossover field extracted from the
  -T relation, which divides the pinned vortex-liquid phase into weekly and strongly pinned regions according to a plastic-flux creep model. The former region is associated with weak vortex entanglements under lower fields, while the magnetic field increases, the point defects compose strong intrinsic pinning center, causing strong vortex entanglements and lateral vortex wandering. The effective pinning barrier extracted from the TAFF region is around 104 K, consistent with the strong pinning nature of the system. Variance of magnetic strength and orientations brings about a complex change in pinning, and therefore, abundant vortex behavior in AxFe
 Se2, which makes it a convenient system to study diverse vortex phases in layered superconducting systems.
Acknowledgments
This work was supported by the National Natural Science Foundation of China (NSFC) (Grant Nos. 11404002, 11404003 and 11074001) and the Scientific Research Foundation for the Returned Overseas Chinese Scholars from the State Education Ministry, and the '211 Project' of Anhui University (J01001319-J10113190007).