

Abstract
The transition dynamics in silicon rubber based isotropic magnetorheological (MR) elastomers in terms of the normal force induced by an external homogeneous magnetic field is experimentally addressed. The primary goal was to evaluate dynamic performances of the MR elastic isotropic composite using a transparently presented measuring system with known characteristics in contrast to few previous studies on the topic. It was found that an increase in the magnetic field leads to an increase in the induced force and a decrease in the response time of the MR elastomer. At the same time, both the use of coarse particles as magnetic filler and a significant reduction in the stiffness of the polymer matrix reduce the response time of the MR elastomer under study. The analysis carried out takes into account the dynamics of the electromagnetic coil and the eddy currents induced in the magnet circuit. The shortest response times obtained for various MR elastomer samples are in the range of 27–72 ms for the maximal used magnetic field with an induction of 230 mT. These times correspond to the fastest previously reported ones for MR elastomers and MR elastomer based systems. In addition, the obtained results indicate the presence of different mechanisms responsible for the measured magnetodeformational effect observed in MR elastomers.
Export citation and abstract BibTeX RIS

Original content from this work may be used under the terms of the Creative Commons Attribution 4.0 license. Any further distribution of this work must maintain attribution to the author(s) and the title of the work, journal citation and DOI.
1. Introduction
Magnetorheological (MR) elastomers represent an intensely explored class of controlled smart materials [1]. These composites are based on a soft elastic matrix with embedded magnetic microparticles. The application of an external magnetic field makes it possible to reversibly control the various properties of the MR elastomer. There are a great number of studies examining these composites from various perspectives [2]. In addition to magnetic field-dependent viscoelasticity, one very attractive feature of MR elastomer is the magnetodeformation effect [3]. The controllable change in dimensions of MR elastomer allows it to be used as an actuator, e.g. for valves etc [4, 5]. It is obvious that apart from quantitative and qualitative assessment of the changes in geometric dimensions as well as various macroscopic physical properties of the MR elastomer under the action of a applied magnetic field, the response time of the composite is extremely important for practical applications. Nevertheless, currently, the information about the transient response of MR elastomer on an applied field is rather limited and ambiguous. Generally, vibration isolation devices and rheometers are used to evaluate the response time of MR elastomer specimens or MR elastomer-based systems. In [6] a response time of the bushing with an integrated natural rubber based MR elastomer is measured. As demonstrated, the measured force rises exponentially with a characteristic time (response time) of about 9.5 ms when the current is applied to the electromagnetic coil of the device. It is also stated that a small part of the force grows and relaxes at longer time scales. This characteristic obtained in [6] is a specific value for the device considered by the authors under specific conditions and is not directly related solely to the physical parameters of the MR composite. In [7] a response time of a multi-layered MR elastomer base isolator has been investigated. Using various approaches the authors obtained the fastest force rise time of the studied system of 52 ms. In [8] a MR elastomer based actuator was analyzed and a response time of 350 ms was obtained for the force measurements. Again, in both last mentioned cases [7, 8], a complex systems was evaluated, not solely a specimen of MR elastomer of a certain composition. Thus, several independent studies give a range in the response time of MR elastomer-based systems of several orders of magnitude. Other researchers measured the transient response of a MR elastomer using a rheometer equipped with a magnetic cell. In [9] the authors evaluated the transient response using dynamic torsion at fixed excitation frequency and assume a step change of magnetic field excitation. The parameter estimated by the authors is the storage modulus and is proportional to the measured torque. It is reported that the MR elastomer has at least three characteristic time constants, while the fastest one is under 10 s. A similar method of assessing the transient dynamics in elastomers has been used in [10, 11]. In [10] the authors proposed a comprehensive model based on magnetic dipolar and viscoelastic parameters for an anisotropic MR elastomer. The reported shortest first-order time constant is longer than 3 s. In [11] the authors tried to improve the transient response of MR elastomers by using the particles synthesized in a special procedure (CIP@FeNi) and reported the shortest first-order time constant of 0.68 s. It should be noted, however, that using a plate-plate configuration in the context of rheometer studies of solid materials involves a number of critical issues and the absolute values of the physical quantities obtained in this way may not be correct [12–14]. In particular, there is a problem of adhesion of the sample to the measuring geometry and imperfect transfer of strain from the moving plate to the sample and hence imperfect transfer of torque from the sample to the plate. In an attempt to resolve this issue and avoid global or local adhesive failure, the researchers load the specimen with a significant normal stress (normal force up to several tens of N). This normal stress can significantly compress the sample and can be much greater than the shear stress, resulting in incorrect measurements. Furthermore, the shear modulus is not a parameter directly quantifiable by a rheometer. In fact, it is a matter of applying a sinusoidal strain and measuring the corresponding shear stress in oscillatory dynamics. The output modulus values are the result of processing the dynamic data by the corresponding rheometer firmware and software. An analysis of the raw data would be necessary for a correct assessment when using this method. On the whole, the method remains applicable only for small deformations, for which the behavior of the material is linear. There is no possibility to take a non-linearity into account, due to a non-uniform strain distribution in the plate-plate configuration. Thus, observed and reported within this configuration non-linear effects remain in doubts. In [15] the transient response of a MR elastomer is systematically tested using a rheometer under compression mode. The authors used the Maxwell model for the evaluation of the time constants. It is concluded that an anisotropic MR elastomer specimen has a better transient response than an isotropic one, and the MR elastomer sample under small compressive strain is faster than under a higher one. The shortest reported response time of the anisotropic sample is 12 ms. Noteworthy is the trend of the normal force-time curves demonstrating overshoot at all electrical currents, i.e. magnetic fields, used by the authors. No evidence is given that this is a feature of the material and not of the used rheometer system. Considering the above, the scattering of characteristic times of MR elastomers reported in the publications of various authors is not surprising.
The objective of this study is to evaluate the transition dynamics in MR elastomers in terms of the normal force induced by an external homogeneous magnetic field and using a transparently presented measuring system with known characteristics. The normal force refers to the magnetodeformation effect in MR elastomers. The effect is that, under the influence of an external magnetic field, the MR elastomer changes its original shape [16, 17]. According to known studies of highly filled MR elastomer specimens, the magnetodeformation effect corresponds to their elongation in the direction of the applied magnetic field [18–20]. From the theoretical point of view there are two main contributions to the magnetodeformation of the MR elastomers and they operate at different scales [3, 21, 22]. The first one is related to the general macroscopic properties of the composite, i.e. its shape and net magnetization, which determine demagnetizing field creating the surface magnetic pressure jump and some internal forces in the sample. The second one is microstructure related and crucially depends on the local spatial distribution of the magnetic particles in the composite matrix. Performed in [3] 3D modeling has shown that at low fields the magnetodeformation is determined by particles structuring and the macroscopic and microscopic contributions work against each other. Consequently, the deformation of the material is quite low. As particle structures emerge, the processes of rotation of structures in the direction of the field and orientation along the field become dominant. In this case both contributions work together and the deformation is significant. In [23], using a microscopically motivated continuum approach, the authors also claim particle motion in an elastic matrix as the main cause of the magnetodeformation effect in MR elastomers. The magnetodeformation effect is important in point of view of practical material applications, therefore, further motivation and the need to investigate the corresponding dynamic characteristics is obvious.
This work is organized as follows: first, we present the used test rig (section 2.1) and a detailed description of the methodological aspects of determining the transient time (section 2.2). This is followed by a summary presentation of the elastomer MR samples used in the measurements (section 2.3). The obtained results are presented and discussed in section 3, including the normal force data and the transient response of the MR elastomers. Additionally, an issue of the initial specimen pretension is addressed. A summary is given in section 4.
2. Materials and methods
2.1. MR elastomer samples
Three types of MR elastomer samples were fabricated for the study in this work. The two-component silicone rubber Elastosil RT623 (Wacker Chemie AG, Germany) was used as matrix. The liquid polymer was diluted with silicone oil M1000 (GE Bayer Silicones, Germany) to reduce the stiffness of the matrix, as the addressed effect is a feature of sufficiently soft composites [17]. Two types of iron powder were used as magnetic filler. The primary filler was CC grade carbonyl iron powder (BASF, Germany) containing spherical microparticles with an average size of ∼3–5 μm. Additionally, an iron filler with coarser particles (∼80–100 μm) obtained by fractionation of a highly polydisperse powder of particles with irregular shape on a sieve (Haver&Boecker, Germany) was used. Before mixing the filler with the initially liquid matrix components, the magnetic particles were treated with silicone oil for better compatibility with the matrix. Specifically, the microparticle powder was mixed with a solution of silicone oil in hexane, passed through a dispersant, and dried. The total filler concentration for all fabricated specimens was 80 wt.% which corresponds to about 35 vol.%. After mixing, the composition was vacuum degassed to remove air bubbles, poured into molds and polymerized for at least 2 h at 70 °C. As a result, disc-like MR elastomer specimens with a diameter of 14 mm and a height of 4 mm were obtained. Information on the magnetic powder content in the samples as well as on the elastic modulus of the polymer matrix is provided in table 1. Samples 1 and 2 have the same filler, but sample 2 has a significantly softer matrix, effectively being gel-like. The matrix of sample 3 corresponds to sample 1, but the magnetic filler is a mixture of the two types of powders mentioned above.
Table 1. Composition of the studied MR elastomer samples.
| Sample ID | Total filler concentration | BASF CC particles (∼3–5 μm) | Large particles (∼80–100 μm) | Ratio of the silicon rubber to silicon oil | Elastic modulus of the matrix |
|---|---|---|---|---|---|
| Sample 1 | ∼35 vol.% | 100% | 0% | 1:1 | ∼30 kPa |
| Sample 2 | ∼35 vol.% | 100% | 0% | 1:1.5 | ∼3 kPa |
| Sample 3 | ∼35 vol.% | 35% | 65% | 1:1 | ∼30 kPa |
Thus, sample 1 corresponds to a typical MR elastomer based on soft silicone rubber [17], sample 2 can be described as a soft magnetic gel, and sample 3 has an increased initial magnetic susceptibility due to the presence of a significant fraction of coarse particles [24, 25].
2.2. Test rig and methodology measurement
The experimental test rig is schematically presented in figure 1 and is composed of a magnetic circuit made of low-carbon steel (grey), an electromagnetic coil (orange), a non-magnetic sample holder (green) consisting of a statically fixed titan plate (lower part) and a shaft (upper part) made of thermoplastic polyester, and the MR elastomer sample (yellow). The air gap between the titan plate and the upper part of the magnetic circuit is 9 mm. The diameter of the part of magnetic circuit under the plate is 20 mm on top. The shaft of the sample holder is connected to a force sensor KM 1403 K 50 N (Megatron Elektronik Gmbh, Germany) that is fixed to the frame. A screw on the sample holder sets the initial sample pretension. The direction of the homogeneous external magnetic field B and the force F to be measured are coaxial. As mentioned above, the application of an external homogeneous magnetic field to the MR elastomer causes it to elongate in the direction of the field. In our test setup, the specimen is fixed between two parts of the sample holder and the controlled parameter corresponds to the elongation force F induced by the specimen under the action of the applied field B. A minimum initial force of 0.1 ± 0.01 N is applied to the specimen when it is fixed. The magnetic flux density B, which excites the sample, is measured by a Hall probe connected to a Gaussmeter (Lake Shore 460, Lake Shore Cryotronics, Inc., USA). A fast current controller is used for the excitation of the electromagnetic coil to improve the transient response. A laboratory power supply Gen300-17 (TDK Lambda Corp., Japan) powered the current controller. A signal generator HMF2550 (Rohde & Schwarz GmbH & Co KG, Germany) generates the voltage signal U as input for the current controller. A current clamp Fluke i30 (Fluke Corp., USA) monitors the electric current I, which excites the electromagnetic coil.

Figure 1. Experimental test rig: system block diagram (left) and schematic representation of the MR elastomer specimen (MRE) under experimental conditions (right).
Download figure:
Standard image High-resolution imageAll four signals (U, I, B, and F) are acquired to the DAQ system Dewe-50 (Dewetron GmbH, Austria) with a sampling frequency of 25 kHz. Each measurement is composed of six control signal step rises with a frequency of 0.2 Hz, see figure 2. Five rise ramps are used for the subsequent evaluation (number 2–6). The duration of the evaluated section is 2.5 s. A factor limiting the duration of the measurement is the gradual heating up of the system, due to electrical current applied to the coil. Within the framework of the methodology used, a heating of the sample under study was avoided.

Figure 2. An example for a measurement of a 1 A (∼96 mT) excitation of sample 2 to demonstrate the experimental procedure.
Download figure:
Standard image High-resolution imageThe standard deviation σ was determined from the selected measured or evaluated signals (force and time constants). The standard deviation σ was obtained using five consecutive measurements (excitations) on one sample. It should be noted that the presented data are from one MR elastomer specimen for each material.
2.3. Methodology evaluation of MR elastomer response time
Several definitions of transient response (response time, time constant, etc) of dynamic systems such as dampers, clutches, or elastomer isolators exist. The transient response of these devices is usually assumed to be a first-order dynamic system. According to available information, MR elastomers have more time constants [6, 9]. However, we focused on the shortest time constant and simplified the behavior of the MR elastomer as a first-order system. In the case of a step change of the input, the response time τ63 (time constant) is to be determined as the time for the increase to 63.2% of the steady-state value, see figure 3. Time constant τ63 represents the time it would take for the response to reach a steady state while maintaining the initial rate of change (tangent to the transient characteristic for t = 0: green line). On the other hand, the response time for 86.5% (2τ63), 90% (2.3τ63), 95% (3τ63) or 98.2% (4τ63) of the steady-state value are also commonly used in the transient analysis. In the current study, we utilize the criterium of 63.2% (τ63) and 90% (τ90 = 2.3τ63).
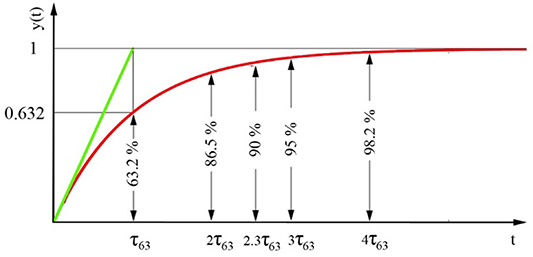
Figure 3. Response of a first-order system on a step input with the relevant time constants.
Download figure:
Standard image High-resolution imageThe experimental setup describe above contains several time constants that are due to (i) the dynamics of the electromagnetic coil  , (ii) the eddy currents induced in the magnetic circuit
  , and (iii) the MR elastomer itself τ. The main goal of our experiments was to obtain the time constant of the MR elastomer, i.e. τ. The electromagnetic coil inductance creates a time delay between voltage and electric current. From an electrical point of view, the used test rig can be simplified as inductance L connected in series with a resistance R. Therefore, the control current cannot make a step change since the electromagnetic inductance L needs time to store and release energy. The differential equation of an electric control circuit according to Kirchhoff's laws can be as follows:
where t is time, and U is voltage. In the case of voltage control, the time development of the electric current i(t) after the voltage is switched on can be expressed as:
In [7] is stated that the majority of the response time of MR elastomer isolator devices is consumed during the conversion from the control voltage command to the electric current. In this case [7], it was 73% of the overall response time of the device. Therefore, we used a fast current controller with an over-voltage method to improve the dynamics of the electromagnetic coil. More detailed information about this method is to be found elsewhere [26, 27]. We used a maximum voltage of 120 V. In our case, the longest time constant (worst case) of the electromagnetic coil was  4 ms; see figure 4(a). The electric current fluctuation between approximately 50 ms and 80 ms is due to the homemade current regulator principle function. The response time was slightly shorter for a lower final value of the electric current.
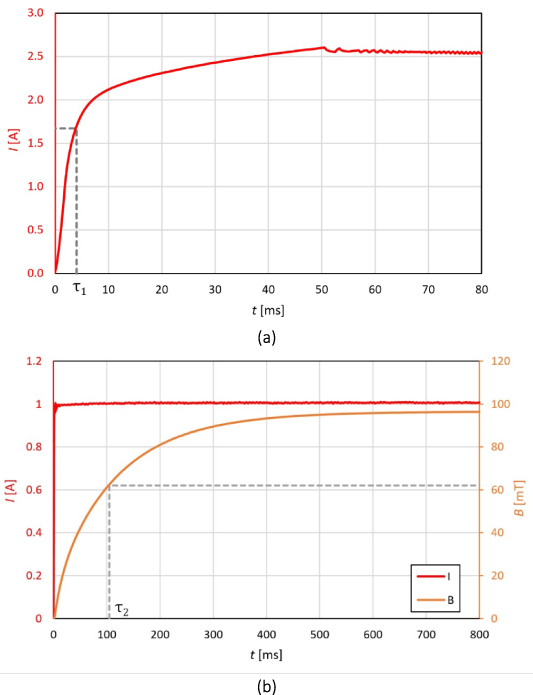
Figure 4. The temporal development of electric current for a step voltage excitation (a) and the temporal development of magnetic flux density (b) to evaluate time constants τ1 and τ2 and to show a corrected simplification of electric current step excitation.
Download figure:
Standard image High-resolution imageIn our experiments, a time lag between the trend of the electric current I and the trend of the magnetic flux density B can be recognized, which is caused by the eddy current induced in the magnetic circuit, see figure 4(b). Eddy currents flow perpendicular to the changing magnetic flux in the magnetic circuit. They induce a magnetic field that tends to oppose the changes in the field according to Lenz's law which creates a time lag (τ2). In our case, it can be assumed there is a step change (excitation) in electric current. Therefore, the time constant of the magnetic circuit, which is  , can be determined (see figure 4(b)). This value can be considered as independent of the electric current magnitude and from the type of MR elastomer sample. The focus of the current study is the MR elastomer time constant τ, which is given by the time delay between the magnetic field and the normal force, see figure 5.
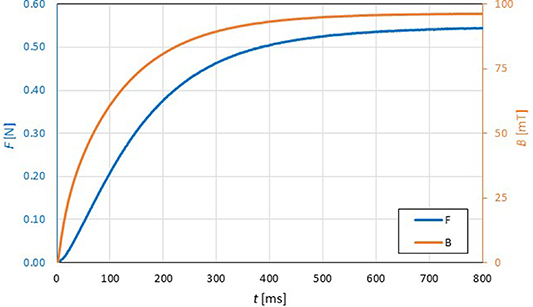
Figure 5. An example of the response of the magnetic flux density B and the force F on a step excitation in electric current to show a time delay related to MR elastomer.
Download figure:
Standard image High-resolution imageThe excitation of the MR elastomer by the magnetic field cannot be considered as stepwise. Therefore it is necessary to find the transfer function between the magnetic field and the induced normal force. The transfer function is considered as a first-order system in the form:
where Kp is proportional gain and Tp is time constant (Tp = τ63). The Matlab system identification toolbox is used for the identification of the constants Kp and Tp. It is necessary to note that the assumption of a linear dynamic system is a simplification. The response times listed in the results are determined as step excitation of the transfer function.
3. Results and discussion
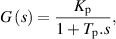
First we consider the effect of the applied magnetic field on the maximum normal force induced by the investigated MR elastomer specimens, i.e. the values corresponding to ∼100% of the steady state (at t> 1 s). Figure 6 shows the dependence of the measured stationary normal force Fstat on the magnetic flux density B. It should be noted that the values of the standard deviation σ are too small to be shown in the graphs. The Fstat (B) dependence is non-linear for all tested samples. The highest force exhibits the MR elastomer sample 3; the smallest one is found for sample 2 for the highest field used. At the same time, in a field up to ∼150 mT, the force Fstat induced by the sample 2 is slightly higher than that that for sample 1. The maximum effect observed for sample 3 is to be attributed to the increased initial magnetic susceptibility of the larger filler particles compared to the susceptibility of the other fillers. Similar results on the greater normal stress induced by MR composites with greater magnetic susceptibility were previously reported in [25, 28]. The dependence Fstat (B) obtained for sample 1 can be fit quite acceptably using a quadratic function Fstat ∼ B2 for the whole range of the field B used in the experiment, while for samples 2 and 3 a sufficiently good correlation can be found only up to ∼170 mT. The quadratic dependence of Fstat (B) is consistent with the quadratic dependence of the magnetic free energy on the applied field, for which the component of the proportionality factor is the magnetic susceptibility in accordance to electrodynamics of continuous media [29]. It is thus confirmed that the dependencies obtained for at least a limited range of magnetic fields can be explained considering the initial magnetic susceptibility, which is expected to be equal for samples 1 and 2 and is higher for sample 3.
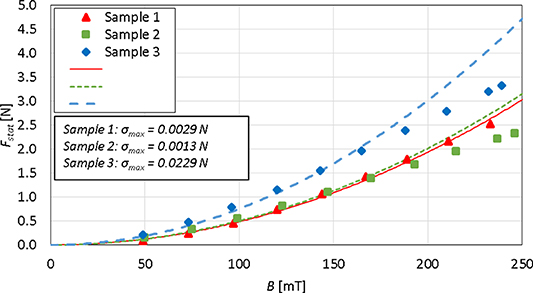
Figure 6. Dependence of the measured stationary normal force Fstat on the magnetic flux density B (points). The values of the standard deviation σ are too small to be shown in the graphs, therefore the maximal standard deviation σmax obtained is additionally provided. Dotted and solid lines correspond to the mathematical fitting of the data using a Fstat ∼ B2 function, with the B range of 0–170 mT taken into account for samples 2 and 3, while the full range of the used B-values was taken into account for sample 1.
Download figure:
Standard image High-resolution imageFrom a certain field (∼170 mT) the dependencies for samples 2 and 3 do not correspond to the function Fstat ∼ B2 , even though the magnetization curve for similarly filled composites is still linear in this range, i.e. the magnetic susceptibility is constant, see e.g. [16, 28]. Obviously, the physical processes which determine the behavior of complexly filled composites (sample 3) and very soft gel-like matrix composites (sample 2) should be quite different from those of the standard sample 1. As to be assumed, the different behavior of different samples can be attributed to both, macroscopic deformation and microstructural change processes involving different displacements and structuring of magnetic particles within the polymer matrix. From a microscopic point of view, perhaps a distinction should be made between the structuring process and the rotation or other movements of magnetic microparticles and particles structures within the matrix, as earlier observed in some studies of the microstructure of low concentrated MR composites [30, 31]. It is to be assumed that for a sample 3 with larger particles and therefore with higher interparticle dipolar forces, the microstructural effects are more pronounced than for sample 1. In the context of sample 2, one can speak of increased mobility of the particles and their aggregates inside the matrix. From a macroscopic point of view, various changes in the shape of the samples can be expected, e.g. changes in the effective contact area of the composite with the sensor shaft cannot be ruled out. However, the compact magnetic cell with a closed magnetic circuit unfortunately does not allow an accurate visual check of the shape of the sample in the experiment. Therefore, without appropriate macroscopic and microscopic visual observations, it would be incorrect to provide such specific explanations. The proposition and justification of a detailed magnetodeformation mechanism remains beyond the scope of this study and should be additionally considered.
Figure 7 shows the raw force response F to magnetic field excitations (B) exemplary given for electromagnetic coil excitations of 1 A and 2.5 A over time for all three MR elastomer samples under study. From the graphs, the differences in the transient dynamics observed for the different samples are evident. Notable is the change in the response of samples 1 and 2 for the higher field (I= 2.5 A, B∼ 230 mT) compared to their response to the lower field (I= 1 A, B∼ 95 mT). This change demonstrates an effect of the soft gel-like matrix. The softer composite (sample 2) reacts faster to the external field and for the low field the induced force is slightly higher than that observed for sample 1. When the external magnetic field reaches a certain threshold value (around 170 mT), the force induced by sample 1 becomes greater than the force induced by sample 2. The dynamics of the magnetic field growth must be as well taken into account here. In the initial part of the excitation, i.e. up to the intersection of the transient response of samples 1 and 2, the field B is still significantly lower than its steady state value. That is, in fact, in this part we still observe the response of the MR composite samples to the low field. The appearance of an intersection point in the response of samples 1 and 2, i.e. some threshold value of the magnetic field, is confirmed for other excitation currents (see figure S1 in supplementary).
Figure 7. Raw force response F to a magnetic field excitation B over time. Results are given for electromagnetic coil excitations of 1 A and 2.5 A which corresponds to steady-state magnetic flux densities of ∼95 mT and ∼230 mT. Additionally the magnetic flux density response is given.
Download figure:
Standard image High-resolution imageLet us now consider the effect of the magnetic field on the response time determined using the methodology presented above (see section 2.2). Figure 8 shows the dependencies of the response time τ63 (a) and τ90 (b) on the magnetic field B. The standard deviation is very low compared to the absolute values of the transient time and therefore is given in separate graphs in the supplementary (figure S2).
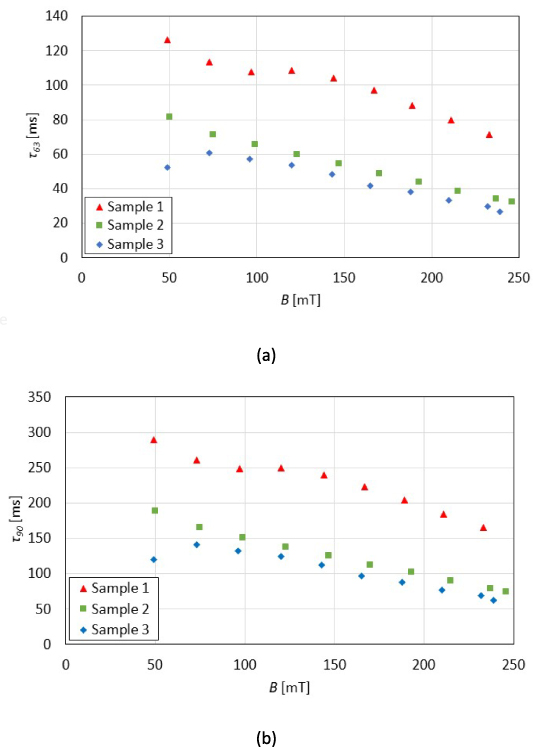
Figure 8. Response time τ63 (a) and τ90 (b) vs applied magnetic field B obtained for the MR elastomer samples under study.
Download figure:
Standard image High-resolution imageAs the value of the magnetic flux density B increases, the response time decreases for all samples. Sample 1 exhibits a significantly longer response time than the other samples (τ63 = 72 ms; τ90= 165 ms at I= 2.5 A, B∼ 230 mT). Sample 3 achieved the shortest response time (τ63 = 27 ms; τ90 = 62 ms at I= 2.5 A, B∼ 230 mT). That is, both, the use of coarse particles in the magnetic filler and a significant reduction in the stiffness of the polymer matrix reduce the response time of the MR elastomer. The response time curves for samples 2 and 3 are of a similar qualitative and quantitative nature, except for one point corresponding to the minimum field used (B = 50 mT). As in the case of the discussion of normal force induced by the magnetic field given above, a detailed understanding of the results obtained is only possible with accurate visual observations of changes in both, the microstructure and the macroscopic state of the samples under study. This was not realizable within the setup being used. It would also be practical to compare the experiment with a theoretical prediction. However, we are not aware of analytical theoretical approaches directly related to the transient dynamics of MR elastomers. As the microstructural changes induced by the applied magnetic field are related to the inter-particle dipolar forces, one can expect faster changes in sample 3 which have larger particles. On the other hand, these dipolar forces induce the counteraction elastic stresses depending on the properties of the polymer matrix. That is, it could be again a matter of particle mobility within matrix determining the structural changes. Accordingly, the response of sample 2 with a significantly softer matrix also differs from that observed for sample 1.
An issue that is to be addressed separately is the contact area between the surface of the sample and the surface of the sensor shaft. On the one hand, despite the careful preparation of the experiment, it cannot be ruled out that the contact between the sample surface and the axis is far from perfect due to deviations in their parallelism. On the other hand, the surface of the MR elastomer is not perfect and can have significant irregularities. It should also be noted that due to the shape of the sample, it is obvious that it is non-uniformly magnetized. Thus, specimen edge deformations in the magnetic field due to an induced gradient cannot be excluded. In order to preliminarily assess the possible influence of the contact area on the transient dynamics, measurements were taken at different pretension of the standard sample (sample 1). The results obtained regarding τ63 are shown in figure 9 and regarding τ90 they are to be found in the supplementary information (figure S3). The curve corresponding to the maximum applied pretension (0.6 N) is qualitatively similar to the curve for sample 3, it can be assumed that this is an indicator of a change in the contact between the composite and the sensor, for example, for one of the reasons mentioned above. But if so, the effect is only significant for the minimum field used. At the maximum field the difference is not so pronounced and does not exceed 10%. Without observation of the macroscopic shape and surface changes of the sample in situ as well as without corresponding theoretical predictions, possible explanations have rather speculative nature. Nevertheless, this is another open point for possible further research.

Figure 9. Response time τ63 vs applied magnetic field B for the sample 1 for different initial pretension.
Download figure:
Standard image High-resolution image
4. Summary
The fastest response times obtained (τ63 is in the range of 27–72 ms and τ90 is in the range of 62–165 ms at 230 mT for various samples) correspond to the fastest values known from the literature (see Introduction). This is primarily due to the fact that we have analyzed MR composite samples, rather than any complex systems based on them. We took into account the dynamics of the electromagnetic coil and currents induced in the magnetic circuit, and have access to raw data, unprocessed by any instrumentation filters. We have observed different behavior for MR elastomer specimens with different compositions. The presence of a magnetic filler fraction with larger microparticles leads to a higher force induced by the magnetic field and a shorter response time. The use of a softer matrix also reduces the response time of the composite, but can lead to a reduction in the induced force. The analysis of the results indicates that different physical mechanisms may be responsible for the measured magnetodeformational effect in MR elastomers. However, in order to assess them correctly, it is necessary to make visual observations of the shape of the composite and its microstructural state in situ, which was beyond the frame of the current research. Other points of this study which could be improved in the future are the limitations of the maximum magnetic field used (230 mT) and the first-order dynamic system assumptions used to evaluate the response time. An important task is also to develop a test rig that allows the magnetic field to change in step instead of used ramp excitation. This can be achieved when the time constant of the magnetic unit does not exceed a few ms. In addition, a systematic study of the effect of variations in MR elastomer composition on the transient characteristics of the material is needed to shed more light on the issue in question.
Acknowledgments
D B was supported by Deutsche Forschungsgemeinschaft (DFG) under Grant BO 3343/3–1. M K was supported by Czech Science Foundation under Grant 21-45236L and by Project FSI-S-23-8212.
Data availability statement
The data cannot be made publicly available upon publication because they are not available in a format that is sufficiently accessible or reusable by other researchers. The data that support the findings of this study are available upon reasonable request from the authors.
Supplementary data (1.0 MB PDF)