
Abstract
Acoustic black holes (ABHs) are structural features that can be embedded into plates to provide effective structural damping. However, the performance of an embedded ABH is limited by its size, which determines the ABH cut-on frequency. It is not always practicable to increase the size of an ABH to reduce its cut-on frequency, however, previous work has shown that active vibration control can instead be used to enhance the low frequency performance of an ABH beam termination. This paper presents an investigation into the potential performance benefits that can be achieved by implementing active control into an array of ABHs embedded in a plate, realising an array of active ABHs (AABHs). The potential performance advantage is investigated here through experimental investigations, where different configurations of passive and active control treatments are applied to both a plate with embedded ABHs and a constant thickness plate. The smart structures utilise piezoelectric patches to realise the control actuation and employ an active feedforward multichannel vibration control strategy that aims to minimise the structural response monitored by an array of accelerometers. The performance of each plate configuration is evaluated in terms of the attenuation in the structural response and the energy, or control effort required. The presented experimental results demonstrate that, compared to the constant thickness plate configuration, the AABHs provide considerable passive damping above the ABH cut-on frequency and significantly reduce the required control effort.
Export citation and abstract BibTeX RIS

Original content from this work may be used under the terms of the Creative Commons Attribution 4.0 license. Any further distribution of this work must maintain attribution to the author(s) and the title of the work, journal citation and DOI.
1. Introduction
In structures, acoustic black holes (ABHs) are tapered geometrical features that can provide effective damping at frequencies above the first local taper mode. They function by gradually reducing the velocity of an incident wave as it travels along the taper. Due to the low wave speed near the tip of the taper, the application of a small amount of damping to the taper results in significant absorption, particularly at frequencies where the local modes of the ABH are excited. ABHs are also extremely lightweight, generally requiring material to be removed from the host structure to create the necessary taper. In a plate, ABHs have been realised as both surface-attached vibration dampers [1–3] and embedded damping features [4–12]. This paper will focus on the embedded features, for which an example is shown in figure 1. This ABH has been defined using the height profile
where  is a scaling factor,
  is the minimum thickness of the ABH, hplate
is the thickness of the plate, h0 is the difference between the thickness of the plate and the minimum thickness of the ABH, rabh
is the radius of the ABH and µ is the power law used to define the taper gradient.
is the minimum thickness of the ABH, hplate
is the thickness of the plate, h0 is the difference between the thickness of the plate and the minimum thickness of the ABH, rabh
is the radius of the ABH and µ is the power law used to define the taper gradient.
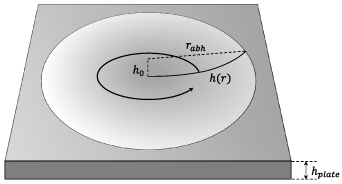
Figure 1. A diagram showing an ABH embedded into a plate.
Download figure:
Standard image High-resolution imageThe low frequency performance of a plate with embedded ABHs has been shown to be characterised by the local ABH modes [9, 13, 14] which, when excited, produce narrow bands of absorption in the structural response. At frequencies below the first local ABH mode, however, the structural response is similar to a constant thickness plate, since the effect of the ABH is rather limited. The frequency of the first local ABH mode has, therefore, been referred to as the cut-on frequency of an ABH and can be estimated as the frequency at which the flexural wavelength becomes comparable to the radius of the ABH taper [15, 16]. As frequency increases, the modal density and overlap increase [13, 14], which improves the broadband absorption of the ABH. Although the cut-on frequency of an ABH could be reduced by increasing the size of the ABH, this is not always practical due to constraints on the size of the host structure and potential adverse effects on the structural integrity. Alternatively, the low frequency performance can be increased by the addition of tuned masses to the ABHs, as reported in [17], however, the magnitude of improvement may be limited and the system system tuning is fixed after implementation.
To increase the low frequency performance of an ABH and also increase its potential adaptability, an active solution has been proposed in which an active vibration control system is integrated into an ABH beam termination [18]. This active ABH (AABH) utilises a feedforward wave-based control strategy, which can control the reflection coefficient in the beam using a piezoelectric patch actuator attached to the ABH taper. The AABH beam termination is shown to offer significant augmentation of the low frequency control performance compared to the passive ABH, but also compared to a constant thickness beam with an identical active termination. In addition, it is shown that the AABH has both lower power and computational requirements compared to the active termination applied to a constant thickness beam [18].
To extend the AABH concept from the beam application presented in [18], this paper presents an investigation into the performance benefits of embedding AABHs into a plate. This study not only extends the AABH concept from the 1D taper to the 2D case, but also explores the use of multiple AABHs embedded into a single structure, which builds on previous work on passive ABHs in plates [1, 5, 6, 9, 17, 19]. The paper is structured as follows: In section 2 the various plate configurations that will be investigated are described, which include the ABH embedded plate and the constant thickness plate, each with different passive and active treatments applied. The experimental setup that will be used to evaluate the behaviour of the plate configurations is also described in section 2. A multichannel feedforward control strategy, which is used to realise the smart structures, is presented in section 3. The passive performance of the various plate configurations is initially presented in section 4, before the active systems are evaluated in terms of the structural response and both the computational and power requirements. Finally, the conclusions of this work are presented in section 5.
2. Smart plate configurations and experimental setup
The plate used in these investigations has been manufactured from aluminium with the dimensions detailed in table 1. A diagram of the plate with embedded ABH features is also presented in figure 2 for reference. The plate features five ABHs, with one located at the centre of the plate and the other four located at the centre of each of the four quadrants. Each of the outer ABHs is offset from the central ABH by δl along the length of the plate and δw across the width of the plate. This layout is based on the layout of control actuators that can be used to effectively control low order plate modes [20]. The ABHs have been designed by initially taking the cross-sectional power law profile for the ABH radius, defined by equation (1) (also shown in figure 2), and revolving this profile by 360∘ to obtain the 3D profile of the ABH. The dimensions of the ABHs have been selected by considering similar examples in the literature [9, 10, 21] as well as with guidance from the parametric study presented in [14]. The cut-on frequency of the ABHs can be estimated as the frequency at which the wavelength in the ABH becomes comparable to the size of the ABH [9, 15, 16]. Using the method outlined in [15, 16], this gives a value of approximately 830 Hz for the ABH geometry considered here. In addition, the critical frequency of the plate can be estimated as the frequency where the flexural wavelength matches the acoustic wavelength, which in this case is approximately 2.2 kHz. In addition to the plate with embedded ABHs, a plate with a constant thickness profile was also manufactured to provide a comparison and the mass of the two plates are also given in table 1, which differ by 0.341 kg or 13% of the constant thickness plate mass.

Figure 2. A diagram showing the dimensions of the plate with embedded ABHs.
Download figure:
Standard image High-resolution imageTable 1. Dimensions of the plates used in the experimental setup.
| Variable | Value |
|---|---|
| Plate length | 475 mm ± 1 mm |
| Plate width | 375 mm ± 1 mm |
| Plate height (hplate ) | 6 mm ± 0.1 mm |
| ABH radius (rabh ) | 50 mm ± 0.1 mm |
| ABH minimum height (hmin ) | 0.5 mm ± 0.1 mm |
| ABH power law (µ) | 3 ± 0.1 |
| ε | 5.5 mm ± 0.2 mm |
| δl | 103 mm ± 1 mm |
| δw | 78 mm ± 1 mm |
| Plate mass with ABHs | 2.545 kg |
| Plate mass without ABHs | 2.886 kg |
In total, eight different variations of the experimental setup have been used. Each plate has been tested with no treatment, treatment with Henley's yellow damping compound [22], treatment with piezoelectric patches, and treatment with both Henley's damping compound and piezoelectric patches. The Henley's damping compound has been applied to cover the total area of the curved side of the ABH so that the piezoelectric patches could be applied to the flat side to reduce pre-stress. The piezoelectric patches, which share the same operating characteristics as the P-876.A12 piezoelectric patch described in [23], have been co-located with the centre of each embedded ABH. This central location gives better coupling between the patch and the plate due to collocation with the thin region of the ABH, and produces the optimal vibration absorption below the cut-on frequency of the ABH [5]. Figure 3 shows a diagram of the treatment locations for the plate with embedded ABHs for clarity and table 2 provides some information about each treatment. The same treatment locations have been used for the constant thickness plate, but the diagrams are left out for conciseness. The application of these treatments will change both the local mass distribution and local stiffness of each ABH. Classical ABHs assume that both the mass and stiffness decrease continuously as the thickness of the material is reduced, however, it has previously been shown that modifying the mass distribution or stiffness profile of the damping layer can change the characteristic behaviour of an ABH [24–27]. It has also previously been shown that the modes, and therefore bands of low reflection, for a beam based ABH termination occur at different frequencies when the ABH is treated with either Henley's compound or with a piezoelectric patch [18]. The larger mass and lower stiffness of the Henley's compound results in these frequencies being lower compared to the configuration with a piezoelectric patch, which is lighter and increases the effective stiffness of the taper. In this investigation, the treatment with Henley's yellow compound is considered to uniformly coat each ABH, which shifts the mass distribution towards the thinnest part of the ABH. The stiffness profile will also be changed, however, since Henley's compound is very soft compared to aluminium this change will be minimal. The treatment with a piezoelectric patch is also considered to have uniform thickness, however the patches only cover the central region of the ABH taper. The mass of the patches is small compared to the mass of the Henley's compound, as detailed in table 2, and so this is not expected to significantly change the behaviour of the ABH. Although the patches used are stiffer than the Henley's compound, they are softer than the aluminium that the ABHs are manufactured from and, therefore, this effect is also not expected to be large in this case. The effects that the different mass and stiffness profiles have on the structural response of each plate will be discussed further in section 4.1.
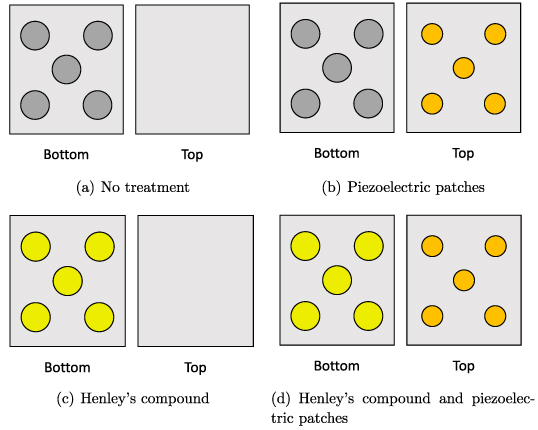
Figure 3. A diagram showing the four different configurations of treatment applied to the plate with embedded ABHs. These four configurations of Henley's compound and piezoelectric patches were also applied to the constant thickness plate in the same locations.
Download figure:
Standard image High-resolution imageTable 2. Information about plate treatments used in the experimental setup.
| Variable | Value |
|---|---|
| Henley's compound mass per ABH | 17 g ± 0.5 g |
| Henley's compound covering radius | 50 mm |
| Piezoelectric patch mass | 2 g ± 0.5 g |
| (4 g including resting wire mass) | |
| Piezoelectric patch radius | 25 mm |
| Piezoelectric patch thickness | 0.5 mm |
| Piezoelectric patch cut-on frequency | 250 Hz |
Figure 4 shows a diagram of the experimental setup used to test each of the plate configurations. For each configuration, the plate has been clamped to the top surface of the perspex box using a metal edge clamp, which reduces the effective surface area of the plate to 412 mm by 312 mm. The shaker has been connected to the plate using a stinger approximately 120 mm from the centre of the plate and the accelerometers have been attached to the top surface of the plate in a 4 × 3 grid using wax. This arrangement of accelerometers resulted in a separation distance of 100 mm, which corresponds to a flexural wavelength of 5.5 kHz in the plate. The upper frequency of interest in this investigation has been defined by setting the cut-off frequency of the low pass filters to 10 kHz. The lower frequency limit in this investigation is 250 Hz, which is set by the cut-on frequency of the piezoelectric patches. A photo of the final setup is shown in figure 5(a) for one of the smart panel configurations. A diagram of the top surface of the plate, including the locations of the accelerometers, piezoelectric patches and stinger mount, is shown in figure 5(b) to aid clarity.

Figure 4. The experimental setup consisting of the plate mounted on a perspex box. The plate can be driven by both the shaker, which is attached via a stinger, and each of the piezoelectric patches attached to the ABHs. The piezoelectric patches require a high voltage amplifier and both the sensor and drive signals are processed through low pass filters for anti-aliasing and reconstruction.
Download figure:
Standard image High-resolution image
Figure 5. (a) A photo of the plate with ABHs mounted on the perspex box with piezoelectric patches and accelerometers attached to the top surface. (b) A diagram showing the top surface of the plate during experimentation.
Download figure:
Standard image High-resolution imageThe primary disturbance has been generated by driving the shaker with white noise and the control actuation is provided by driving the piezoelectric patches via a feedforward control strategy that will be described in section 3. The structural response of the plate can be measured using the evenly distributed array of 12 accelerometers. Two sampling frequencies have been used in this investigation. The first, 22 kHz, has been chosen because it equates to a Nyquist frequency of 11 kHz and accommodates the 0–10 kHz frequency range of interest. The second, 4 kHz (equating to a 2 kHz Nyquist frequency), has been used to implement the control strategy that will be presented in section 3. A reduced sampling rate has been used to implement the controller because the passive performance of the ABHs is sufficient above 2 kHz, which will be demonstrated in section 4. Extending the control bandwidth further would result in limited improvement in the AABH smart panel and would be more computationally demanding to realise.
3. Controller formulation
The multichannel feedforward control system considered here consists of 12 accelerometer error sensors and 5 piezoelectric control actuators that can be used to control the vibration of the plate; the primary disturbance is provided by a single structural force excitation. A block diagram of the controller is shown in figure 6, where it can be see that the control filter, W , is adapted to minimise the vector of L error signals. Although the controller can be implemented adaptively using, for example, the FxLMS algorithm, the performance limits can be assessed offline by calculating the optimum matrix of control filter coefficients using the derivation shown in section 5.2.1 of [28]. In this investigation, only one reference signal is used and so the controller formulation is slightly simplified.
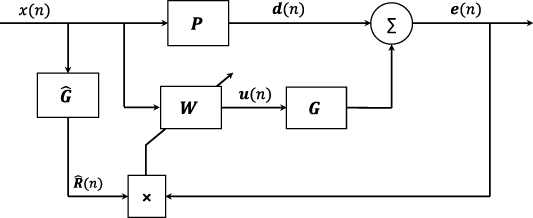
Figure 6. A block diagram showing the multichannel feedforward control system that has been used to control the structural vibration of the plate.
Download figure:
Standard image High-resolution imageThe vector of error signals measured at the L accelerometers can be expressed as

The elements of this vector, which correspond to the signals measured at the nth time step, can be expressed in terms of the summation of the disturbance signal at the lth error sensor,  , and the contribution from each of the M piezoelectric actuators, which are each driven by a control signal,
  , such that

where glmj is the jth coefficient of a Jth order FIR filter that represents the plant response between the mth piezoelectric patch and the lth accelerometer. As shown in figure 6, the control signals are generated by filtering the reference signal via the control filters and the mth control signal is given as
where wmi is the ith coefficient of the mth FIR control filter, which is Ith order. Substituting equation (4) into equation (3) gives the error signal at the lth accelerometer as
which, by making the assumption that the control filter is time-invariant [28], can be re-written as
where the reference signal filtered by the estimated plant response between the lth error sensor and the mth control actuator is
Equation (6) can be expressed more succinctly in vector form as
where

and

The multichannel generalisation of equation (8) can be expressed as

where the matrix of filtered reference signals corresponding to all M control sources and all L error sensors can be written as
and the vector of MI control filter coefficients can be written as

With the error signal expressed according to equation (11), it is possible to derive the optimal broadband set of control filter coefficients that minimise the cost function defined as the weighted summation of the mean-squared error signal and the sum of the squared control filter coefficients,

The inclusion of the term in the cost function that is proportional to the sum of the squared control filter coefficients, or the control effort, has a number of practical benefits, which include constraining the control effort and improving the robustness of the control system, as discussed in section 3.4.7 of [28]. This control effort term has been included here specifically to enable a constraint to be imposed on the peak-to-peak magnitude of the control signals to avoid overdriving the piezoelectric patch actuators.
Substituting equation (11) into equation (14) gives the full cost function as
The optimum vector of control filter coefficients that minimise this cost function can be calculated by partial differentiation of equation (15) with respect to w and then equating the result to zero and rearranging to give

Finally, although the optimal solution could be reached using an adaptive version of the FxLMS algorithm [28],  will be implemented directly to ensure that the limitations on the maximum control performance are clearly demonstrated, rather than highlighting at this stage any limitations imposed by convergence of the adaptive implementation.
4. Results
In this section, the results from the investigation into the performance of the various plate configurations described in section 2 are presented. Initially, the plant responses of the control system are shown and a plant modelling study has been carried out to determine the FIR filter lengths required to accurately model the plant responses corresponding to each plate. Following this, an investigation has been carried out to examine how the broadband average level of structural vibration varies with control filter length. Finally, the performance of the plate with AABHs is presented over frequency in terms of structural response and control effort. These results are then compared to the performance of an equivalent active plate with a constant thickness profile.
4.1. Primary responses
To first evaluate the passive performance of the eight plate configurations introduced in section 2, their primary responses have been measured using the setup described in section 2. The primary disturbance shaker has been driven with broadband white noise at a sampling frequency of 22 kHz and the response has been measured at each accelerometer. The power spectral density (PSD) of the signal measured at each accelerometer has then been calculated using the Welch method. The global structural response of the plate has then been estimated by summing the PSDs corresponding to each accelerometer signal and these results can be seen in figure 7 for the different configurations of both the constant thickness plate and the plate with embedded ABHs. These consist of the plates without damping, with Henley's compound, with piezoelectric patches and with both Henley's compound and piezoelectric patches.
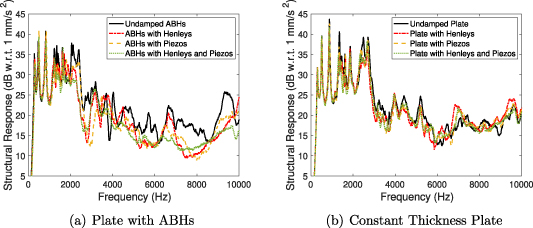
Figure 7. The structural responses of the plate with ABHs and the constant thickness plate with each type of damping applied.
Download figure:
Standard image High-resolution imageFrom the primary responses presented in figure 7(a), it can be seen that all configurations of Henley's compound and piezoelectric patches reduce the vibration level of the plate with ABHs. Table 3 summarises the results presented in figure 7 by showing the broadband average structural response level for each plate configuration and this shows that individually, each treatment provides a broadband reduction of 2 dB and when combined the treatments provide 3 dB of attenuation. Over frequency it can be seen that none of the configurations provide significant attenuation below 1.4 kHz. Above 2 kHz, the structural response is considerably damped by the ABHs with all three treatment configurations. It can also be seen that the structural response is slightly shifted in frequency for each of the different treatments. The application of Henley's compound tends to produce a slight shift down in frequency due to the higher mass distribution towards the thinnest sections of the ABHs and the application of piezoelectric patches produces a slight shift up in frequency due to the increase in stiffness towards the thinnest sections of the ABHs.
Table 3. The broadband level of vibration for each plate configuration with respect to 1 mm s−2.
| Plate type | Treatment type | Broadband level (dB) |
|---|---|---|
| Plate with ABHs | No damping | 27 |
| Henley's compound | 25 | |
| Piezoelectric patches | 25 | |
| Henley's comp. and piezoelectric patches | 24 | |
| Constant thickness plate | No damping | 28 |
| Henley's compound | 26 | |
| Piezoelectric patches | 27 | |
| Henley's comp. and piezoelectric patches | 26 |
In contrast, the primary responses presented in figure 7(b) show that all configurations of Henley's compound and piezoelectric patches provide lower levels of attenuation on the constant thickness plate. This is also shown by the broadband levels presented in table 3. Over frequency, it can be seen that each of the configurations provides up to 2 dB of attenuation in the structural response, but it is also worth noting that the response of the constant thickness plate without any damping treatments applied is greater than the untreated ABH plate. The shift in the structural response that was noted for the plate with ABHs is less prominent in these results, which can be attributed to the weaker coupling between the different treatments and the thicker plate material.
Overall, these primary structural responses have shown that, in the case of the ABH plate, an active solution should focus on the 0 Hz–2 kHz frequency band, where the passive damping of the ABHs is less effective. In contrast, an active solution for the constant thickness plate would be required over the full frequency range presented, or a greater quantity of passive damping treatment would be required to match the passive performance of the ABH embedded plate.
4.2. Plant modelling
In this section, a plant modelling study is presented which aims to determine the differences in the plant modelling filter requirements for the plates with and without ABHs. The accuracy of the plant models is critical to the performance of the controller and, therefore, this study will ensure that appropriate plant modelling filters are applied for all active plate configurations. Previous work on AABHs applied to beams demonstrated that an ABH terminated beam required a shorter plant modelling filter than an equivalent constant thickness beam [18] and this study will assess whether this is also true for the AABH plate configurations considered here. In this study, and the following control implementation, a sampling frequency of 4 kHz has been used, which has been selected based on the passive performance of the ABH embedded plate at frequencies above ~2 kHz, as shown in section 4.1. Control will be implemented over a bandwidth of 250 Hz–2 kHz, which captures the resonances that fall above the cut-on frequency of the piezoelectric patches, but is below the frequency at which the passive damping becomes considerably effective. Going forward, for clarity, the 250 Hz–2 kHz bandwidth will be referred to as the control bandwidth whilst the 0 Hz–10 kHz bandwidth will be referred to as broadband.
The plant responses have been measured between each of the piezoelectric patches, numbered 1–5, and the accelerometers, numbered 1–12, as shown in figure 5(b). Each of the five piezoelectric patches have been driven separately with white noise and the frequency response functions between each piezoelectric patch and each accelerometer have been calculated using the H1-estimator. Examples of two of the measured plant responses are shown in figure 8; the first is the plant response between piezoelectric patch 1 and accelerometer 1 and the second is the plant response between piezoelectric patch 2 and accelerometer 1. Accelerometer 1 has been chosen because it is located near the corner of the clamped plate and will thus detect a greater number of structural modes than, say, the centrally located accelerometer; piezoelectric patch 1 is located at the centre of the plate, whilst piezoelectric patch 2 is located towards one corner of the plate, thus providing an overview of the different plant response characteristics.
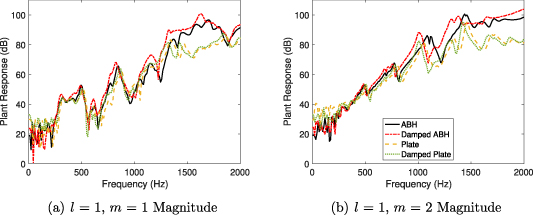
Figure 8. The plant response between (a) piezoelectric patch m = 1 and accelerometer l = 1 and (b) piezoelectric patch m = 2 and accelerometer l = 1 for each of the plate configurations.
Download figure:
Standard image High-resolution imageFrom the results presented in figure 8(a) it can be seen that the centrally located piezoelectric patch (m = 1) effectively excites the plate at frequencies above 250 Hz, which corresponds to the cut-on frequency of the piezoelectric patches. However, it can be seen in figure 8(b) that piezoelectric patch m = 2, which is located closer to the edge of the clamped plate, is less effective at exciting the lower frequencies. In particular, in comparing the results shown in figures 8(a) and (b), it can be seen that the centrally located actuator strongly excites the first mode of the plate, which is expected from its location, but actuator m = 2 couples less effectively into this plate mode.
In general, from the results shown in figure 8, it can be seen that the plant responses for the constant thickness plate configurations are relatively insensitive to the application of the passive damping material, which is consistent with the primary response results presented in section 4.1. For the ABH embedded plate configurations, the responses are relatively similar below 1 kHz, but then differences between the damped and undamped responses appear at higher frequencies. Of particular note is that the ABH plant responses are up to 20 dB higher at frequencies above 1 kHz compared to the constant thickness plate, which indicates that the ABHs are more receptive to energy input from the piezoelectric patches. Thus, based on both the structural responses due to the primary excitation, shown in figure 7, and the secondary plant responses, the ABH embedded plate offers both higher passive damping at higher frequencies and greater coupling between the piezoelectric patch actuators and the structural response when compared to the constant thickness plate.
For each plate setup with piezoelectric patches, the plant responses have been modelled as FIR filters, as required for the implementation of the FxLMS controller. In order to examine the effect of plant modelling accuracy, these FIR filters have been calculated with between 2 and 150 coefficients (corresponding to durations of 0.5 to 37.5 ms at the 4 kHz sample rate). The frequency response of each filter has been compared to the respective measured plant response and the normalised mean-squared error (NMSE) between the measured and modelled responses has been calculated, which is an average over frequency and both the control actuators and error sensors, expressed as
where  is the frequency response of the FIR filter modelling the plant response between the mth control actuator and lth error sensor and gml
is the corresponding identified plant frequency response.
is the frequency response of the FIR filter modelling the plant response between the mth control actuator and lth error sensor and gml
is the corresponding identified plant frequency response.
The NMSE has been calculated for each of the four different plate configurations with piezoelectric patches attached (with and without Henley's compound) and the results from this study are presented in figure 9 on a decibel scale. From these results it can be seen that as the number of FIR coefficients increases, the error in the plant model decreases for all cases, as expected. More interestingly, it can also be seen that for both configurations of the constant thickness plate, the NMSE is approximately the same for all FIR filter lengths. The NMSE for both configurations of the plate with ABHs is similar below 45 FIR coefficients and is also lower than the NMSE for both configurations of the constant thickness plate. For filter lengths greater than 45 coefficients, the change in the error for the plate with ABHs plateaus and increasing the length of the plant model further does not give any significant improvement in the plant modelling accuracy. For the plate with ABHs and Henley's compound the NMSE is lower than obtained for all of the other configurations up to 80 filter coefficients, but the error plateaus for longer filter lengths and becomes comparable to either of the constant thickness plate configurations. It should be noted that the plateau in the error for the plate with ABHs occurs at approximately 2 dB higher than for the other plate configurations. This can be related to the fact that the configurations with ABHs have both plate modes and local ABH modes, which increases the complexity of the plant responses and contributes to the higher minimum NMSE for the ABH configurations; this is particularly true when there is no added damping to suppress the local ABH modes.

Figure 9. The NMSE between the identified and modelled plant responses for the four different smart plate configurations.
Download figure:
Standard image High-resolution imageThe general similarities in the NMSE for the four plate configurations may be attributed to damping added by clamping the plates to the box, which results in a similarly damped response at frequencies below 2 kHz as shown by the plant responses in figure 8. In addition, the control frequency range considered here does not extend significantly above the cut-on frequency of the ABHs and so the additional damping provided by the ABHs is relatively small over the considered bandwidth. In all cases, the accuracy of the plant modelling is not improved significantly by increasing the filter length beyond 128 coefficients and so this filter length will be used in the control performance evaluation that follows.
4.3. Control performance
Having established the filter length requirements for the plant response models in the previous section, this section will present two sets of performance results. The first set of results correspond to an investigation into how the broadband average attenuation across the control bandwidth varies as the number of FIR coefficients in the control filters is varied. Subsequently, a comparison between the broadband control performance of the different active plate configurations is presented when the ideal length of control filter is used.
4.3.1. Control filter length.
Having established the plant modelling requirements for each plate configuration as 128 FIR filter coefficients, the effect of the control filter length can now be investigated. To understand how the number of control filter coefficients influences the control performance, the attenuation in the structural response at each frequency has been calculated for a range of control filter lengths as
where  is the matrix of cross and power spectral densities of the disturbance signals and
  is the matrix of cross and power spectral densities of the error signals. In each case, the optimal control filter has been calculated according to the formulation presented in section 3. The mean attenuation across the control bandwidth has been calculated for a range of between 2 and 80 FIR filter coefficients and in each case the peak-to-peak voltage of the control signal has been constrained to the same operating limit using the β weighting parameter shown in equation (16).
Figure 4.3.1 shows how the mean control bandwidth attenuation in the structural response relative to the constant thickness plate with no damping treatment applied varies with the number of control filter coefficients used. From these results it can be seen that the two constant thickness plate configurations reach a slightly higher level of mean attenuation across the control bandwidth than either of the ABH plate configurations, however, this is at most 1 dB. It can also be seen that in all cases, the mean control bandwidth attenuation increases most significantly between 0 and 10 control filter coefficients, above which the attenuation plateaus. Increasing the control filter beyond 32 FIR coefficients gives less than 0.1 dB performance benefit and so this filter length will be used in the broadband performance evaluation that follows.

Figure 10. The mean attenuation over the control bandwidth achieved with respect to the untreated constant thickness plate, using a control filter with between 2 and 80 FIR coefficients.
Download figure:
Standard image High-resolution image4.3.2. Broadband performance.
The control strategy described in section 3 has been implemented offline to determine the performance of each of the plates under ideal conditions using filtered white noise between 250 Hz and 2 kHz as the primary disturbance. The plant model filters for each case have been implemented with 128 FIR coefficients based on the study presented in section 4.2 and the control filters have been set to contain 32 FIR coefficients based on the study presented in section 4.3.1. The maximum peak-to-peak voltage of the control signals has been constrained to the same limit for both configurations by using the β weighting parameter in equation (16), which is consistent with the control filter length study. The results are presented in figure 11 over the full broadband frequency range, taking into account both the active and passive vibration control strategies. Figure 12 presents the control effort required for each implementation over the control bandwidth and table 4 presents the mean broadband vibration level of the plates with and without control.
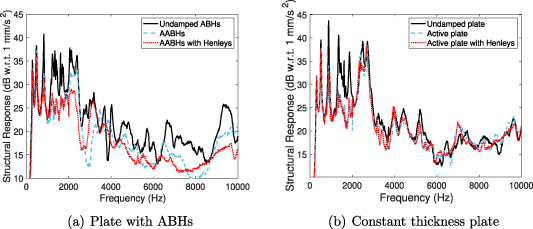
Figure 11. The global structural response over the full bandwidth when a combination of active and passive control is used.
Download figure:
Standard image High-resolution image
Figure 12. The control effort required for each control case.
Download figure:
Standard image High-resolution image
Table 4. The mean broadband (0–10 kHz) level of the structural vibration of each plate when different treatments are applied.
| Plate type | Treatment type | Broadband level (dB) |
|---|---|---|
| Plate with ABHs | No damping | 27 |
| Piezo patches—control off | 25 | |
| Piezo patches—control on | 23 | |
| Henley's comp. and piezo patches—control off | 24 | |
| Henley's comp. and piezo patches—control on | 22 | |
| Constant thickness plate | No damping | 28 |
| Piezo patches—control off | 27 | |
| Piezo patches—control on | 25 | |
| Henley's comp. and piezo patches—control off | 26 | |
| Henley's comp. and piezo patches—control on | 25 |
From the results presented in figure 11(a), it can clearly be seen that the AABHs provide an effective control solution and provide significant structural damping over the full bandwidth presented. Particularly, the AABH configuration with Henley's compound offers the greatest performance. Conversely, the constant thickness plate (figure 11(b)) is only damped over the bandwidth that active control is applied. Table 4 shows that the mean broadband vibration level is reduced from 27 to 22 dB in the AABH plate with Henley's compound and from 28 to 25 dB in both active constant thickness plates. These results demonstrate that the plate with AABHs and Henley's compound achieves a 3 dB performance benefit over both constant thickness active plates and a 6 dB performance benefit over the uncontrolled and undamped constant thickness plate.
Finally, it is also important for an active treatment to assess the electrical power requirements and, too this end, figure 12 shows the control effort for the ABH and constant thickness plates, which is approximately proportional to the electrical energy required to implement control. From these results it can be seen that the control effort is approximately the same for both of the constant thickness plate configurations. Generally, the control effort is higher for both configurations of the ABH plate below 830 Hz, which is the cut-on frequency of the ABHs. This is due to the constraint imposed on the peak-to-peak voltage of the control signal, which limits the control effort for the constant thickness plate at lower frequencies. Above 830 Hz, the control effort required by both AABH plate configurations decreases compared to the control effort required by the constant thickness active plates. This decrease is particularly considerable for the AABH plate configuration with Henley's compound. The average control effort has also been calculated for each configuration and the plate with AABHs and Henley's compound requires 4 dB less energy over the control bandwidth compared to the constant thickness plate configurations. Taking into account both the superior performance of the plate with AABHs at higher frequencies and the considerably reduced control effort, these results have clearly highlighted the performance benefits gained from embedding AABHs into a plate.
5. Conclusions
This paper has presented a detailed investigation into the implementation of five embedded AABHs to reduce vibration in a plate. A combination of control strategies has been used, taking advantage of the passive ABH effect at higher frequencies, whilst addressing their limited performance at lower frequencies through active control. The AABHs have been implemented by attaching circular piezoelectric patches to the flat side of the ABHs and Henley's compound to the curved side. The same treatment has also been applied to the constant thickness plate. Before investigating active control, it has been shown that the mass of the plate with AABHs is lower than the mass of the constant thickness active plate by around 13%. In addition, the passive damping provided by the ABHs has been shown to significantly attenuate the structural response of the plate above the cut-on frequency of the ABHs. To address the limited performance of the ABHs at lower frequencies, a feedforward multichannel control strategy has been considered and applied over a control bandwidth of 250 Hz–2 kHz. The feedforward controller drives piezoelectric patches to minimise the global structural response of the plate as estimated from an array of accelerometer error sensors. The characteristic behaviour of the plate with AABHs has then been compared to the constant thickness active plate.
In the first instance, the presented comparison has demonstrated that the number of FIR filter coefficients required to model the plant responses is similar for the configurations tested. However, for shorter filters, the plant responses for the plate with AABHs are more accurate, particularly when Henley's compound has been applied to the AABHs. In terms of the control performance, it has been shown that the number of control filter coefficients required to achieve optimal control is approximately the same for all plate configurations. Critically, it has been shown that the structural response of the plate with AABHs and Henley's compound is 3 dB lower than the structural response of the constant thickness active plate with Henley's compound over the full 10 kHz bandwidth examined. The control effort required by the plate with AABHs is also, on average, 4 dB lower than the control effort required by the constant thickness plate. Therefore, this work has demonstrated that a hybrid control approach, where AABHs are used to control across a wide bandwidth via a combination of active and passive control, is very effective. In addition, the energy required to implement this control strategy is lower compared to a constant thickness active plate, but the computational requirements are similar for the considered configuration.
Acknowledgments
This work was supported by an EPSRC iCASE studentship (Voucher Number 16000058) and the Intelligent Structures for Low Noise Environments (ISLNE) EPSRC Prosperity Partnership (EP/S03661X/1).
Data availability statement
The data that support the findings of this study are available upon reasonable request from the authors.