

Abstract
Conductive hydrogels are soft materials which have been used by some researchers as resistive strain sensors in the last years. The electrical resistance change, when the sensor is stretched or compressed, is usually measured by the two-electrode method. This method is not always suitable to measure the electrical resistance of polymers-based materials, like hydrogels, because it could be highly influenced by the electrode/sample interface, as explained in this study. For this reason, a signal conditioning circuit, based on four-electrode impedance measurements, is proposed to measure the electrical resistance change when the gel is stretched or compressed. Experimental results show that the tested gels can be used as resistance force/pressure sensors with a quite linear behaviour.

Original content from this work may be used under the terms of the Creative Commons Attribution 4.0 license. Any further distribution of this work must maintain attribution to the author(s) and the title of the work, journal citation and DOI.
1. Introduction
In the last years many researchers are focusing on hydrogel strain sensors. The interest of the scientific community about this type of sensors has grown exponentially from 2017, as remarked in a recent review [1]. It is due to the particular properties of these soft materials based on polymers that make them unique, such as self-healing, good biocompatibility, good adhesion and high stretchability. Besides, if the electrical conductivity is added to the previous properties, the resultant hydrogel can be used as a strain sensor whose electrical resistance changes when the hydrogel is stretched or compressed. The electrical resistance of a material at constant temperature is defined by the following equation (assuming the cross section is uniform and a linear, homogeneous, and isotropic medium),
where ρ, l and S are, respectively, the electrical resistivity, the length and the cross-sectional area of the sample. The derivative form of (1) is
where Ro , ρo , Lo and So are the original values. Therefore, the resistance change may be due to changes in ρ, L and S. Depending on which of these parameters is the one that changes the most when the material is stretched or compressed, the strain sensor is named differently (piezoresistor, strain gauge, percolative and quantum tunnelling device) as remarked in [2].
In [3] the authors review the different types of conductive hydrogels out there. According to this study, hydrogel strain sensors could be classified as conductive-polymer-based hydrogel sensor [4–10], carbon-based hydrogel sensor [11–17], metal-based hydrogel sensor [18, 19], and ionic hydrogel sensor [10, 20, 21]. Most of the previous studies use the hydrogel strain sensor for monitoring human joint movements [6, 8, 10, 11, 13, 16, 17, 20, 21], other ones as pressure sensor [4, 5, 15], or both [7, 9]. Regardless the type of conductive hydrogel used and the proposed application as strain sensor, all authors measure the electrical resistance change when the hydrogel is stretched or compressed by using the resistance measurement technique based on the two-electrode method. This method is highly influenced by the interface impedance between the electrodes and the sample, as remarked in [22, 23], since the same electrodes are used for both injecting the electric current through the sample and measuring the voltage. The contact impedance (interface impedance) between the electrode and the polymer (sample) cannot be disregarded, as demonstrated in [24–27]. Other authors have also reached the same conclusion studying the electrode-gel-skin interface impedance in electrical impedance tomography [28, 29]. In [30] the authors use a four-probe measuring setup to reduce the effect of the electrode impedance in the alginate hydrogels electrical impedance measurement. In view of these studies, it is advised to use the four-electrode method for electrical impedance measurement of polymers-based materials like ones studied here.
In this study, the influence of the electrode-gel interface impedance is demonstrated when comparing the two-electrode with the four-electrode impedance measurement method. Besides, a signal conditioning circuit, based on the four-electrode impedance measurement method, is proposed to measure the electrical resistance change of a gel-based strain sensor when it is stretched or compressed. Different gels based on polyacrylamide polymer were designed by the authors to validate experimentally the proposed method.
2. Description of the tested gels
Chemically crosslinked gels have been designed by the authors. The process consists of mixing the monomer (acrylamide), the initiator (responsible for initiating polymerization from the monomer), and the crosslinker (N, N-methylenebisacrylamide, MBA, in charge of crosslinking the polymer networks to build a 3D polymeric structure) in a solution. This mixture is polymerized for some time under thermal activation or UV-irradiation. Following the described process in [12], hydrogels (water solvent) and organogels (organic solvent) were designed by the authors to analyze their electrical behaviour. In the first case (hydrogel), the synthesis of the polyacrylamide hydrogels (AM hydrogels) was carried out by radical polymerization of acrylamide (2.82 mmol) using MBA as crosslinker (0.0013 mmol) and potassium persulfate (KPS) (0.0015 mmol) as an initiator. Both monomer and crosslinker were dissolved in deionized water (1 ml), and then KPS was added, and the polymerization took place at 75 ∘C for 1 h. In the second case, the synthesis of the polyacrylamide organogels (AM organogels) was carried out by photoradical polymerization of the same monomer and crosslinker dissolved in dimethylsulfoxide (DMSO) (1 ml) but using IRGACURE 2959 (0.0430 mmol) as an initiator. The polymerization took place after irradiation at 365 nm for 15 min. All chemicals were purchased from Sigma-Aldrich as reagent-grade materials.
Figure 1 shows a photograph of both gels, designed in a cylindrical shape (diameter of 4 mm). The gels' structural characterization was performed by scanning electron microscopy (SEM) as described in [31] using a GEMINISEM 500 from ZEISS. Figure 2 shows representative SEM images of both gels showing the typical porous structure of this kind of materials. It is seen that there are some differences on the structure of AM hydrogel and AM organogel. This structural difference is caused by the following reasons. First, their synthetic approach is completely different: the AM hydrogel is thermally polymerised with KPS, while the AM organogel is UV-photoactivated. Additionally, these reactions use different polymerisation initiators and different reactions times. These differences produce slightly different random polymerisation reaction and interlacing of the polymeric networks, which reflects on the differences on their mechanical properties described below. Mechanical properties were carried out using a Mecmesin Multitest 2.5-I dynamic mechanical analyzer. For compressive studies, cylindrical-shaped AM gels with a diameter of 15 mm and an initial thickness of 10 mm were moulded. From the stress–strain curve in the compressive, the Young's Modulus is calculated as the slope in a strain range between 2% and 10% (figure 3). While the mechanical properties of the hydrogel and the organogel are diverse, both materials have Young's modulus around 104 Pa in compressive stress, values found in soft tissue-like materials moduli [32], allowing their application in human interfacing devices. Figure 4 shows the stress–strain curve up to the breaking point in the tensile test. For tensile studies, cylindrical-shaped AM gels with a diameter of 4 mm were moulded.

Figure 1. Photographs of the tested gels: (a) AM hydrogel and (b) AM organogel.
Download figure:
Standard image High-resolution image
Figure 2. Representative SEM image of (a) AM hydrogel and (b) AM organogel.
Download figure:
Standard image High-resolution image
Figure 3. Compressive stress–strain curves until 40 of strain of AM hydrogel and AM organogel; the absorbed energy (Eads) is calculated from the area underneath the curve from the 0%–20% compression range; the Young Modulus (YM) is calculated as the slope from the 2% to 10% strain compression.

Download figure:
Standard image High-resolution image
Figure 4. Tensile stress–strain curves of AM hydrogel and AM organogel.
Download figure:
Standard image High-resolution imageAlthough polyacrylamide polymer is a neutral (non-conductive) polymer and electrical conductivity is not expected, a conductive behaviour was observed in the experimental tests, as explained below. The studies carried out by Shamsudeen et al [33] on polyacrylamide hydrogels conductivity shed some light on the matter. As in this case, the hydrogels were swollen in deionized water, no conductive particles were introduced in the matrix, and even the same crosslinker agent (N,N-methylenebisacrylamide, also referred to as MBA) was used. Amide groups are very polar, i.e. provide a high electric dipole moment due to an uneven distribution of charges. Authors proved that in dry state, where no water influence can interfere, hydrogels made from higher concentrations of crosslinker (therefore, higher number of amide polar groups) provided higher conductivity, concluding that conductivity is dependent on the presence of polar groups. Once the hydrogels were hydrated to equilibrium with deionized water, conductivity analysis showed that higher conductivity was obtained for lower MBA concentrations. Authors explained that, as it was stated previously, lower amounts of crosslinker enable hydrogels to absorb higher quantities of water, and it is the presence of polar groups, and high-water content combined that enhances conductivity. As a first approach, this could explain and endorse the hydrogels' conductivity here tested, which depends on the quantity of water.
In the case of the organogel, DMSO is a polar aprotic solvent in which the charge separation resonance structure of the amide group is less stable than in water [34] and, for that reason, a lower conductivity value should be expected for this material. Moreover, an essential difference between both gels is that the DMSO solvent does not evaporate at room temperature (boiling point of 189 ∘C under standard conditions), unlike the water solvent. Therefore, the swelling ratio of the organogel does not change with time, and neither does their electrical and mechanical characteristics. This fact allows us to work with steady-state gels for long periods at room temperature.
3. Four versus two-electrode method for electrical impedance measurement of gels
The concept of electrical impedance is defined in the context of linear time-invariant circuits and sinusoidal steady-state response. Specifically, the electrical impedance between two points of a material is defined by the ratio , where and are the voltage and current phasors, respectively, ω is the angular frequency in rad s−1 (, where f is the frequency in Hz), and . Notice that the electrical impedance is, in general, a complex value that changes with the frequency, , where is the resistance, and is the reactance. Figure 5(a) shows a schematic of the setup used to measure the electrical impedance of a material by using the two-electrode method. This method uses two electrodes for both, current injection (input) and measurement of the voltage (output) in the sample and a driving-point impedance is therefore obtained. Figure 6(a) shows the equivalent electric circuit of the previous setup. The voltmeter impedance is assumed to be infinite, and therefore the electric current does not flow through the voltmeter. The voltage measured by the voltmeter is the sum of the voltages across the electrode impedances, and , the electrode-sample interface impedances, and , and the sample impedance Zs . Therefore, the impedance measured by this method is the sum of the impedances previously mentioned. This method is useful to measure the sample impedance when the electrode impedance and the electrode-sample interface impedance are several orders of magnitude lower than the sample impedance, and they can therefore be neglected. In general, the electrode impedance meets this requirement, but the same is not the case with the electrode-sample interface impedance. When this is the case, the common method used to measure the impedance of a material is the so-called 'four-electrode method'. In the four-electrode method, the electrodes that measure the voltage (inner electrodes) are placed between the electrodes that inject and collect the current (outer electrodes), as shown in figures 5(b) and 6(b). In general, all four electrodes are placed forming a straight line. Assuming that the voltmeter impedance is infinite, thus avoiding the current flows through the voltmeter, the voltage measured by the voltmeter matches the voltage across the sample impedance. Therefore, the impedance measured by this method (a transfer impedance) is ideally that of the sample impedance. To conclude, when the aim is to measure the sample impedance and the electrodes-sample interface impedance cannot be neglected with regard to the sample impedance, the four-electrode method should be used to reduce errors in the measurement. This is what happens with the tested gels as explained below.


Figure 5. (a) Schematic of the setup used to measure the electrical impedance of a material by using the two-electrode method. (b) Schematic of the setup used to measure the electrical impedance of a material by using the four-electrode method.
Download figure:
Standard image High-resolution image
Figure 6. (a) Equivalent electric circuit of the two-electrode method. (b) Equivalent electric circuit of the four-electrode method.
Download figure:
Standard image High-resolution image4. Signal conditioning circuit
As seen below in the experimental tests, the electrical impedance of the tested gels reduces to a pure electrical resistance. The main aim of this study is to design a reliable signal conditioning circuit for gel-based strain sensors, which measures the resistance change when the gel is deformed by an applied force. Figure 7 shows a schematic of the electronic circuit proposed for this purpose. This circuit is composed of the following stages:

Figure 7. Signal conditioning circuit.
Download figure:
Standard image High-resolution image4.1. Operational amplifier (op-amp) based alternating current source
This setup allows us to control the electric current through the sample. The electric current, from electrode (1) to electrode (4), is defined as
where the input voltage is defined as , being V the amplitude of the signal in volts and t the time in seconds. Notice that although the input impedance of the op-amp is very high (typical values range from MΩ to TΩ), there is a small leakage DC current (bias current) at the inputs of the op-amp (typical values range from nA to pA). The bias current can be neglected if the current through the sample is several orders of magnitude greater than the bias current. This can be achieved if V and R are properly chosen.

4.2. Voltage follower (op-amp voltage buffer)
The aim of this stage is to isolate the sample (sensor) from the rest of the circuit (readout electronics). By using the four-electrode method, previously described in section 3, the voltage between the inner electrodes (2) and (3), connected to the non-inverting inputs of the op-amps, is defined as

where is the electrical resistance of the sample between electrodes (2) and (3) before being deformed, and is the electrical resistance change after being deformed. As previously explained, the bias current at the inputs of the op-amps can be neglected if the current through the sample is several orders of magnitude greater than the bias current.


4.3. High-pass filter
It cancels unwanted offset in the output voltage of the op-amps.
4.4. Differential amplifier
It is used to amplify the difference between v2 and v3 according to the following equation, providing a suitable voltage level at the input of the full wave rectifier.
4.5. Full wave rectifier circuit
It converts alternating current into direct current according to the following equation.

4.6. Differential amplifier with DC voltage compensation
The output signal of this stage is defined as follows
where Vx is the output voltage of the potentiometer R6, given by the following equation
where x is the position of the potentiometer, taking values in the range 0,1.


From (3) to (7), and assuming that ,

where .

4.7. Low-pass filter
Choosing Rlf and Clf so that . Therefore the output voltage vo can be expressed as

Finally, if Vx is adjusted to be , (10) can be rewritten as


Notice that the adjust of Vx must be done before the sample is deformed, that is, when is zero. At that time, Vx should be adjusted by the potentiometer to bring the output voltage vo to zero. After that, if the sample is deformed between the inner electrodes (2) and (3), the output voltage is proportional to the electrical resistance change of the sample, according to (11).

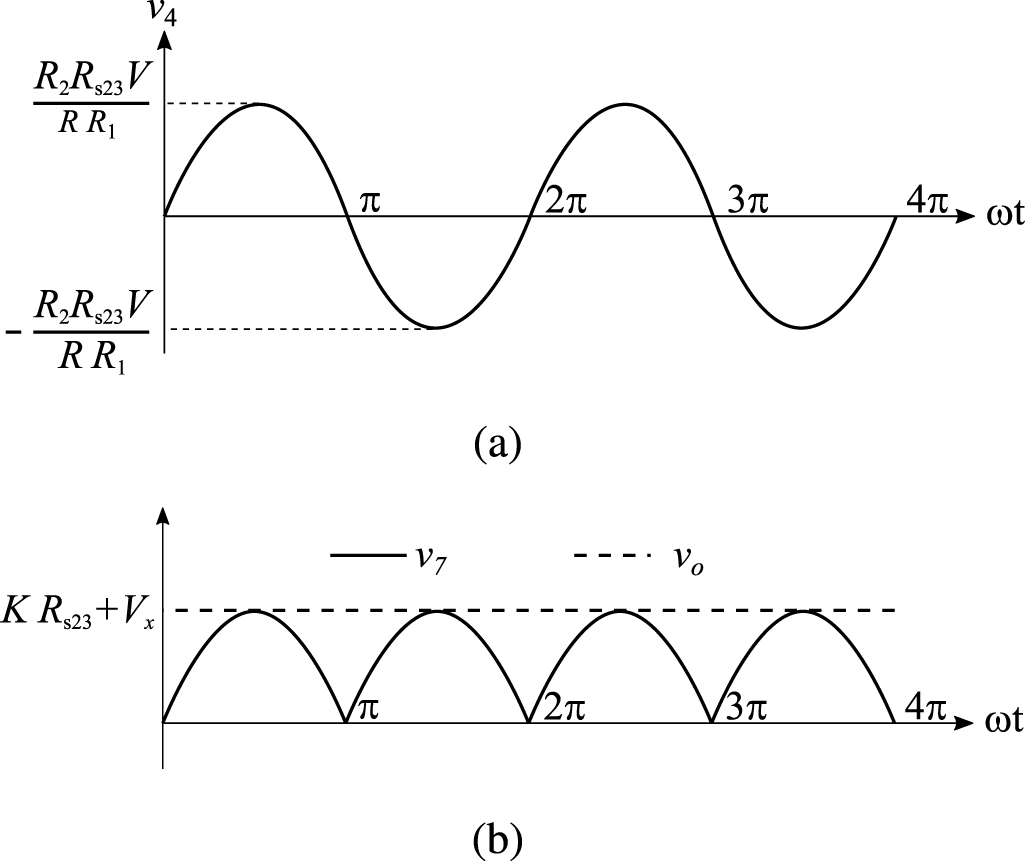
Figure 8 shows the shape of the signals obtained in some stages of the circuit before the sample is deformed and before Vx is adjusted to bring vo to zero.

Figure 8. Voltage signals in some stages of the circuit before the sample is deformed and before Vx is adjusted to bring vo to zero: (a) voltage signal v4; (b) voltage signals v7 and vo .
Download figure:
Standard image High-resolution imageIt is important to note that depending on the type of gel used, the electromechanical properties will be different. Therefore, the strain–stress relation and the gel's electrical resistance-stress relation will be different. This fact may affect the proper operation of the circuit if some parameters are not adjusted properly as explained below. The input voltage of the rectifier (v4) must meet the following condition for a suitable circuit operation, where Vd is the forward voltage of the diode (around 0.7 V), and Vsat is the saturation voltage of the op-amp located before the rectifier that roughly matches the power supply voltage of the op-amp. If , the rectifier will not operate properly. If , the op-amp of the differential amplifier located before the rectifier will saturate. On the other hand, v4 depends on the electrical resistance of the gel between electrodes (2) and (3) (R23) and its variation, the resistors R, R1 and R2 and the input voltage vi , as it is deduced from (3) to (5). Therefore, depending on the value of the electrical resistance of the gel and its variation when it is deformed, parameters R, R1, R2 and vi must be adjusted properly to satisfy the condition . R, R1, R2 can be adjusted by using variable resistors (potentiometers). In addition, the electric current through the gel, defined by (3), should be small enough to avoid damaging the gel. Therefore, it must be considered when vi and R are adjusted. The maximum current supported by the gel depends on the type of gel. In this case, the chosen value has been 1 µA.


5. Experimental validation
First, the electrical impedance of the gels described in section 2 was measured by using the two methods previously explained in section 3, and the results are compared. Second, some experimental tests were performed to prove that the tested gels can behave as resistance force/pressure sensors by using the signal conditioning circuit described in section 4. All tests were performed at room temperature. The main results are shown below.
5.1. Electrical impedance testing
Figure 9(a) shows the equipment used for testing. This impedance analyzer can be used to run two-electrode or four-electrode measurements with just a simple wire setup rearrangement. A Solartron 1260 frequency response analyzer connected to a Solartron 1294 impedance interface system are used to obtain the impedance measurements. These impedance measurements are given in the form of both, real–imaginary and magnitude-phase forms, for each frequency studied. Both instruments are controlled by a computer and driven by SMaRT software, that enables the user to configure the analysis parameters, such as the frequency range and the electric current amplitude. Platinum needle electrodes are used. Each electrode is 10 mm long and 0.3 mm in diameter (Grass Technologies, right-angle needle electrode, model F-E7). The electrodes are equally spaced (4 mm), forming a straight line, as shown in figure 9(b).

Figure 9. Experimental testing setup: (a) impedance analyzer equipment; (b) needle electrodes immersed in the sample.
Download figure:
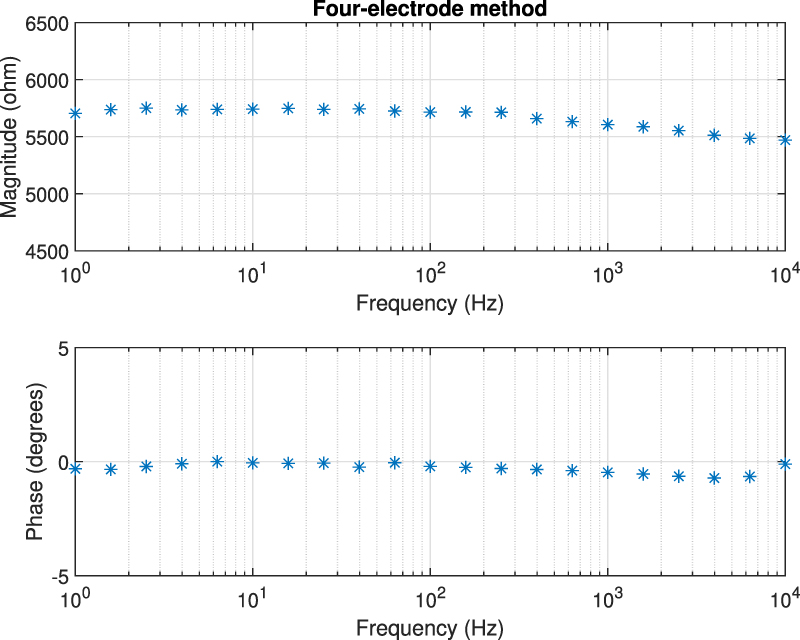
Standard image High-resolution imageThe electrical impedance of the gels described in section 2 was measured with the equipment previously described, comparing the two-electrode method with the four-electrode method. Figure 10 shows, as an example, the results of a test performed with the AM hydrogel. The current amplitude was chosen to be 1 µA and the frequency range from 10 kHz to 1 Hz. Three tests were performed with each method on each sample to check repeatability. When the two-electrode method is used, the magnitude and the phase of the electrical impedance changes with the frequency, as shown in figure 10(a). On the other hand, when the four-electrode method is used, the magnitude remains close to constant (in this particular case is approximately 4.5 kΩ) and the phase remains close to zero over the frequency range analyzed, as shown in figure 10(b). This pattern of behaviour is repeated in all tested gels. Analyzing the results, it can be concluded that the difference in the measurement between both methods is due to the electrode-sample interface impedance. That is, when the two-electrode method is used, the measured impedance is the sum of the sample impedance Zs
and the electrodes-sample interface impedances and (assuming that the electrodes impedances, and , are negligible), as explained in section 3. In


Figure 10. Electrical impedance of the AM hydrogel measured by: (a) the two-electrode method; (b) the four-electrode method.
Download figure:
Standard image High-resolution imageAfter performing the previously described tests, the AM hydrogel was stretched by 30 of its original length, and the electrical impedance was measured by the four-electrode method, as shown in figure 11. This test was repeated three times to check repeatability. The result of one of the tests is shown in figure 12. It is seen that the electrical resistance is approximately increased by 25 of its original value. From (2) is deduced that the resistance change can depend on the resistivity change and the geometrical change of the material. Although the sample is stretched, the measured effective length coincides with the distance between the inner electrodes, which measure the voltage, and therefore there is no change in length. Consequently, (2) is reduced to . On the other hand, the transverse strain is calculated as , where ν is the Poisson's ratio and εaxial is the axial strain. Taking into account that the geometrical shape of the tested hydrogel is cylindrical, the previous expression can be rewritten as , where D and L are, respectively, the diameter and the length of the sample. The transverse strain is related to the cross-sectional area change by the following expression , and therefore . If the Poisson's ratio of the tested hydrogel can be assumed to be approximately 0.45 [35, 36], and the sample is stretched by 30 of its original length, is approximately −28%. Therefore, it seems obvious that the electrical resistance change (approximately 25) is largely due to the cross-sectional area change and the influence of the electrical resistivity change can be disregarded. Similar results were obtained with AM organogel. Additionally, the relation between the electrical resistance and the strain of the gels was analyzed during the stretching-relaxation cycle in a strain range of 0%–30. Ten measurements of electrical resistance were taken at different strain points (0%–5%–10%–15%–25%–30%) during the stretching-relaxation cycle. Figure 13 shows, as an example, the results of the test performed with AM organogel. The mean value and the standard deviation have been represented at each strain point. It is seen that the relation is quite linear during the stretching-relaxation cycle with a correlation coefficient of 0.98, although it has a hysteresis of 13, calculated as . Additionally, it is also seen that the electrical resistance change is approximately 25 when the sample is stretched by 30, corroborating the theoretical analysis carried out previously.


Figure 11. Needle electrodes immersed in the stretched sample.
Download figure:
Standard image High-resolution image
Figure 12. Electrical impedance of the AM hydrogel when the sampled is stretched by 30 of its original length.

Download figure:
Standard image High-resolution image
Figure 13. Electrical resistance of AM organogel during the stretching-relaxation cycle.
Download figure:
Standard image High-resolution image5.2. Force/pressure sensor testing
The gel chosen for testing was AM organogel, described in section 2. DMSO was chosen as solvent because does not evaporate at room temperature, and therefore the swelling ratio of the organogel does not change with time, and neither does their electrical and mechanical characteristics. This fact allows us to work with steady-state gels for long periods at room temperature. The testing was performed by using the electronic circuit described in section 4. The model of the operational amplifier used in the electronic circuit is Texas Instrument TL052CP. Diode 1N4001 is used in the full-wave rectifier. The capacitance and resistance values of the capacitors and resistors were chosen as follows: , , , , , and . The amplitude of the input voltage V and its frequency ω were chosen to be 3 V and 1 kHz. All the test results shown below are oscilloscope screen captures. The oscilloscope model used is RS IDS-6052-U.


Figure 14 shows the voltage signals vi (blue) and v4 (yellow) when the sample is not deformed, that is, when . Both signals are in phase, corroborating the electrical resistance behaviour of the gel, as concluded in section 5.1. Notice that the voltage v4 is proportional to vi , as it can be deduced from (3) to (5). The oscilloscope scales in the x-axis (s/div) and the y-axis (V/div) are displayed at the bottom of the oscilloscope screen captures.


Figure 14. Voltage signals Vi and V4.
Download figure:
Standard image High-resolution imageFigure 15 shows the output voltage when the sample is pressed by applying small impulse forces on the sample sensitive area, that is, between the inner electrodes (2) and (3). The output voltage increases with the applied force. Notice that the tested gel is a soft material and, therefore, a very small force is needed to deform it. Figure 16 shows the little plastic bar used to manually apply the force. Analyzing the results, it can be concluded that when the sample is pressed by a force, the electrical resistance changes because the cross-sectional area also changes, and therefore the output voltage changes, according to (11). It is also important to note that the transverse strain (cross-sectional area change) between electrodes (2) and (3) is assumed to be uniform.

Figure 15. Output voltage when impulse forces are applied.
Download figure:
Standard image High-resolution image
Figure 16. Plastic bar used to manually apply the force into the sensitive area, between electrodes (2) and (3).
Download figure:
Standard image High-resolution imageAdditionally, it should be noted that the orientation of the strain (tensile or compressive) is given by the sign of the output voltage (vo ). The sign of the output voltage depends on the sign of the electrical resistance change of the gel () according to (11). On the other hand, the electrical resistance change depends only on the transverse strain (cross-sectional area change) with the sign changed, , as deduced in this study with the proposed method. Therefore, if the transverse strain decreases, , that is, the cross-sectional area decreases, the electrical resistance increases and viceversa. So, the output voltage is positive when the transverse strain decreases and viceversa.


Figure 17 shows a test where an oscillating force, with a frequency approximately of 2.5 Hz, is manually applied for 5 s. Figure 18 shows other test where a steady force is manually applied for 2.5 s. These results demonstrate that static and dynamic force measurements can be performed with the tested gel by using the proposed signal conditioning circuit described in section 4.

Figure 17. Output voltage when an oscillating force is applied.
Download figure:
Standard image High-resolution image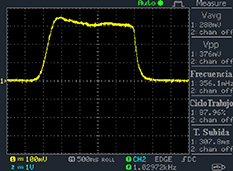
Figure 18. Output voltage when a pulse force is applied.
Download figure:
Standard image High-resolution imageBased on these results, a new experimental setup was prepared to study the relation between the output voltage (proportional to the electrical resistance change) and the applied force, as shown in figure 19. The sample was load with different weights (forces). The weights (nuts of 10 g) were loaded on a lightweight plastic plate supported on two identical gels, as shown in figure 19, up to 50 g. The inner electrodes (2) and (3) were spaced 28 mm to place the plate between them. Notice that the load is distributed equally in both gels, and therefore the tested gel (in which the electrodes are immersed) supports the half of the load. It is also important to note that the transverse strain (cross-sectional area change) between electrodes (2) and (3) is assumed to be uniform. The test was repeated 20 times for each load. Figure 20 shows the results of the tests. The mean value and the standard deviation have been represented at each load. It is seen that the standard deviation increases with the load, but the relation is quite linear. The equation of the fitted least-square regression line is , where vo is the output voltage in milivolts, and F is the applied force in newtons. The correlation coefficient is 0.99. Notice that the output voltage vo is proportional to the resistance change of the gel, according to (11). Therefore, this result suggests that the tested gel can be used as a resistance force/pressure sensor. It is also important to note that the applied force is small enough so that the relation between the force and the transverse strain (cross-sectional area change) is assumed linear (strain range of 0%–10% approximately).


Figure 19. Experimental setup to study the relation between the output voltage and the applied force.
Download figure:
Standard image High-resolution image
Figure 20. Output voltage as a function of the applied force.
Download figure:
Standard image High-resolution image6. Conclusions
Electrical impedance of polyacrilamide polymer gels have been measured by using the four-electrode method. The results show that the electrical impedance of the tested gels is reduced to a pure electrical resistance. It has also been proven that the electrical resistance changes when the gel is deformed and this change is largely due to the cross-sectional area change.
Based on these results, a signal conditioning circuit, based on the four-electrode method, has been designed to measure the electrical resistance change when the gel is deformed due to an applied force. Finally, the resistance change has been related to the applied force by using the proposed signal conditioning circuit, obtaining a quite linear relation. To conclude, it could be said that this type of gels has great potential to be used as resistive strain sensors as long as a suitable signal conditioning system is used.
Acknowledgments
This study was funded by the Ministerio de Economía, Industria y Competitividad (Projects MTM2016-80539-C2-1-R and CTQ2017-88158-R), the Consejería de Educación, Cultura y Deportes of Junta de Comunidades de Castilla-LaMancha (Projects SBPLY/17/180501/000204 and SBPLY/17/180501/000380), and the European Regional Development Fund (fondos FEDER).
Data availability statement
All data that support the findings of this study are included within the article (and any supplementary files).
Appendix.: Electrode-hydrogel interface impedance
A simple EC for an electrode-AM hydrogel interface is proposed in this appendix. Two-electrode impedance measurements were carried out on polyacrilamide hydrogels, to characterize the electrode-hydrogel interface. The impedance analyzer, described in section 5.1, was used to measure the impedance. Tests were run using a 1 µA of amplitude sinusoidal current input, over a frequency range from 10 kHz to 1 Hz, taking five frequencies each decade. A typical Nyquist plot, vs. , for an electrode-AM hydrogel interface (refer to figure 21) shows an incomplete but well-known depressed semicircle. Each plotted experimental impedance point, represented by an asterisk, corresponds to a certain frequency, being the rightmost points the ones corresponding to the lowest frequencies.


Figure 21. Electrode-sample interface impedance for acrylamide hydrogel.
Download figure:
Standard image High-resolution imageA CPE-Rp Randles-type circuit model [37, 38], as shown in figure 22, is used to fit the experimental data. This EC consists of a resistor R (resistance of the sample) with the parallel combination of a non-ideal capacitor (constant phase element, CPE) and a polarization resistance Rp . This parallel combination () models the electrode-AM hydrogel interface.


Figure 22. CPE-Rp Randles-type circuit model.
Download figure:
Standard image High-resolution imageMathematically, the impedance of a CPE, is given by:

where Q and α are the parameters of the CPE. α is a dimensionless value (fractional capacitor) and the unit of Q is [37, 38]. If α = 1, CPE behaves as an ideal capacitor of capacitance C = Q, and if α = 0, CPE behaves as a resistance .


From circuit theory, the impedance of the EC of figure 22 can be written as:

The fitting procedure was carried out using the software ZView. The result was: , , , and α = 0.82. Both the fitted values (circles) and experimental data (asterisks) are simultaneously plotted in the complex impedance plane, as shown in figure 21. As it can be seen, fitted values resemble experimental data well.

It is worth noting that this interface impedance calculated, as might be thought, is going to be distributed between the two existing interfaces, one at each electrode. If the two electrodes are considered identical, as in this case, half of the impedance calculated will correspond to each electrode.