
Abstract
Energy harvesting devices based on the inverted flag configuration have recently attracted attention as a viable option to power small electronics and remote wireless sensors from wind excitation. Despite showing high potential, relatively little research has considered how the dynamics and power generation performance of these devices vary with planform geometry. This study considers composite inverted flags constructed using flexible polyvinylidene difluoride strips as active elements sandwiching a stainless-steel shim as elastic structural support, a configuration allowing for enhanced ability to tailor mechanical and geometrical properties (and hence responses) of the flag. We explore the effect of three key parameters (planform aspect ratio, mass ratio, second moment of area) on flag dynamics (amplitude, flapping frequency) and operational characteristics (power, velocity range). Twelve flags have been manufactured and tested under controlled wind excitation, selected to cover aspect ratios in the range of 0.9–7 and mass ratios in the range of 7–14. Our results expose a number of useful insights into how these devices perform. First, we show that for a given mass ratio, flapping amplitude, frequency, power, and power density are all inversely proportional to aspect ratio and proportional to second moment of planform area. Second, we show that second moment of planform area is a better indicator parameter to assess the flags performance, as compared to the aspect ratio. Third, we show that as mass ratio increases higher power densities and wider operational velocity ranges are allowed; however, this is on the expense of the flag being more sensitive to variations in operating conditions and the possibility of experiencing some unfavourable motion behaviour such as the 'one-sided' low-amplitude high-frequency low-power flapping mode.
Export citation and abstract BibTeX RIS

Original content from this work may be used under the terms of the Creative Commons Attribution 4.0 license. Any further distribution of this work must maintain attribution to the author(s) and the title of the work, journal citation and DOI.
1. Introduction
Wireless sensor networks are composed of spatially dispersed sensor nodes (varying in number from a few to several hundreds or even thousands) used to monitor different physical conditions of the environment by measuring parameters such as temperature, pressure, humidity, sound level, light intensity, chemical concentration, wind speed, etc. These sensors autonomously configure themselves into networks through which their measurements can be transmitted and collected, enabling a broad range of applications in science and engineering. Example applications include machine [1] and process [2] monitoring, air [3] and water [4] quality analysis, wildfire detection [5] and natural disaster prevention [6], agriculture management [7], healthcare monitoring [8], and wildlife animal tracking [9]. Wireless sensor networks are also an enabling technology for the Internet of things [10], which is one of the key emerging fields in the so-called 4th industrial revolution.
The sensor nodes that comprise a wireless sensor network normally have sensing, computing and communication abilities, and therefore typically include the sensor itself, a basic processing and radio transceiver unit, and a power source usually in the form of a battery. When the sensor network is intended for mobile applications or for deploy-and-forget operation in remote or harsh environment, or when it comprises a very large number of sensor nodes, the periodic replacement of the batteries may become challenging or impractical. In these cases, batteries can be replaced with energy harvesting modules which convert ambient energy into electric power [11–15]. Ambient energies that can be harvested from the environment include kinetic energy from wind [16–18], waves [19], water flows [20–22] and ambient vibration [23–27], thermal energy in the form of temperature variations in space or time [27–29], solar radiant energy [30], electromagnetic energy from radio and television broadcasting [31], chemical energy from salinity or other concentration gradients [32], and combinations thereof such as wind and wave [33], wind and vibration [34, 35], wind and solar [36, 37] and vibration and solar [38].
For low-power and portable applications such as wireless sensor networks, harvesting ambient wind energy with piezoelectric materials is currently regarded as a particularly effective option [18]. Piezoelectric wind energy harvesters typically comprise a flexible structural element (such as a beam or a plate) that is either realized by using an integrated piezoelectric material or that is bonded to a piezoelectric patch. These harvesters are designed to undergo flow-induced motion when exposed to wind flow, in such a way that the flow-induced motion periodically bends the piezoelectric material which, in turn, converts mechanical strain into usable electric energy. The flow-induced motion, in particular, can be sustained through different fluid-structure interaction mechanisms such as aeroelastic flutter [39–43], wake galloping [44–47], vortex-induced vibration [48], or turbulence-induced vibration [49].
Among the available piezoelectric materials, flexible piezoelectric polymers such as PVDF (polyvinylidene difluoride) are particularly attractive for wind energy harvesting because of their high flexibility, light weight, long endurance in cyclic operation, low cost, and widespread availability [26, 50]. To maximize the output power, piezoelectric polymers should undergo sustained periodic motion with large-amplitude deformations. In fact, a sustained periodic motion assures a continuous electrical output without interruptions, whilst a large-amplitude deformation yields large strain levels and, therefore, large electrical output.
The focus of this work is on inverted flags: a particularly attractive configuration for wind energy harvesting with flexible piezoelectric polymers. As schematically shown in figure 1(a), an inverted flag is fixed at the downstream trailing edge and free to flap at the upstream leading edge, which is basically the opposite of regular flags which are fixed at the upstream leading edge and flap at the downstream trailing edge. Depending on their geometry, their mechanical properties, and on the wind velocity, inverted flags may exhibit four main dynamic responses, as schematically shown in figures 1(b) and (c): (a) in-line with the incoming flow; (b) a large-amplitude limit-cycle flapping oscillation; (c) a relatively small-amplitude vibration around a fully deflected configuration; and (d) a deflection [51]. Clearly, the most appropriate dynamic response for energy harvesting is the large-amplitude limit-cycle flapping oscillation, which combines the periodic motion and the large-amplitude deformation which are required for adequate operation of flexible piezoelectric polymers. An additional advantage is that, during limit-cycle flapping, the instantaneous configuration of the inverted flag is a cylindrical surface that is entirely concave or entirely convex, thereby ensuring no electrical charge cancellation during operation with piezoelectric materials.

Figure 1. (a) Difference between regular and inverted flag. (b) Schematic representation of the dynamic responses of an inverted flag: in-line with the incoming flow; large-amplitude limit-cycle flapping oscillation; low-amplitude one-sided deflected flapping; and full deflection. (c) Example of recorded envelopes of motion at different wind speeds for flag 12 presented in the current study.
Download figure:
Standard image High-resolution imageThe feasibility of harvesting wind energy with piezoelectric inverted flags has been recently demonstrated by Orrego et al [52], who experimentally investigated 12 inverted flags constructed by stacking together PVDF strips. Their flag geometries covered an aspect ratio (i.e. length to width ratio) range of 0.5–2 and a mass ratio (defined in equation (1) later on) range of 3–5. Their tests were carried out both indoor in a wind tunnel and also outdoor with ambient wind. During testing under controlled flow conditions inside the wind tunnel, their inverted flags exhibited large-amplitude limit-cycle flapping at wind velocities in the range of about 3–9 m s−1. During outdoor testing with ambient wind their inverted flags were capable of harvesting sufficient energy to power a temperature sensor, thanks to a purpose-built self-alignment mechanism that kept the inverted flag aligned with the wind direction therefore compensating for the changing wind direction. These results clearly demonstrate the feasibility of piezoelectric inverted flags for powering remote sensors, which typically operate in the micro-Watt to milli-Watt power range.
Inverted flags entirely realized using PVDF strip such as those explored by Orrego et al [52], which will be referred to as non-composite/homogeneous inverted flags in the following, are clearly attractive for their design simplicity. One intrinsic limitation of this design, however, originates in the mechanical properties of PVDF strips: because of their high flexibility but limited elasticity, PVDF strips are quite effective at producing energy but, at the same time, cannot provide a good structural support. As a consequence, the elastic response of an inverted flag entirely realized using PVDF strips is limited, thereby restricting the wind velocity range where large-amplitude limit-cycle flapping can be sustained to low wind speeds. Moreover, inverted flags entirely realized using PVDF strips typically show a pronounced hysteresis at the transition between flapping and deflection [37]. A potentially superior design would be a composite inverted flag which, as schematically shown in figure 2(b), in addition to the PVDF strips also includes an elastic structural support to increase the elasticity of the inverted flag. An additional advantage of the composite inverted flag is that it is possible to have two layers of PVDF strips, one for each face of the flag, thereby increasing the power output in comparison with inverted flags entirely realized using PVDF strips which include only one layer of active elements.
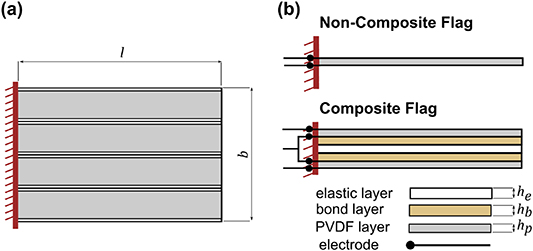
Figure 2. (a) Side view schematic of a PVDF inverted flag construction (the fixed pole of the flag is located on the left in the figure and is vertically oriented); the example shown includes four PVDF strips. (b) Top view schematics comparison between a non-composite and a composite inverted flag construction.
Download figure:
Standard image High-resolution imageComposite inverted flags have been previously considered only by Silva-Leon et al [36], who experimentally investigated three composite inverted flags constructed using a stainless-steel shim as elastic structural support. During testing under controlled flow conditions inside a wind tunnel, their composite inverted flags exhibited large-amplitude limit-cycle flapping at wind velocities in the range of about 9–25 m s−1. The focus of Silva-Leon et al [36] was the simultaneous harvesting of wind energy and solar radiant energy, so they did not seek to provide a systematic assessment of composite inverted flags under pure wind excitation. As such, the influence of the geometric parameters of the composite inverted flag on its dynamics and power generation remains unknown. The objective of this work is, therefore, to provide such an assessment. In particular, we have realized 12 composite inverted flags of different geometries (three lengths and four widths), and have systematically investigated their dynamics and power generation under controlled excitation in a wind tunnel. The present composite inverted flags cover an aspect ratio range of 0.9–7 and a mass ratio range of 7–14. To the best of the authors' knowledge, this represents the broadest range of experimentally reported values for wind energy harvesting with composite inverted flags to date.
The novel contribution of this work is that it is the 1st study to provide a systematic assessment of the performance, under pure wind excitation, of composite inverted flags constructed using flexible PVDF strips as active elements and a stainless-steel shim as elastic structural support. Previous studies have focused on non-composite homogeneous flags with only one layer of flexible PVDF strips, e.g. [52] (see figure 2); however, no attempt has been made to assess the variation of performance with planform geometry for composite flags. It is essential at this point to re-iterate that composite flags offer operational advantages compared to other configurations. In fact, the existence of the metal shim (elastic layer) enables high degree of freedom in tuning/tailoring the mechanical and geometrical properties of the flag allowing a much wider range of planform geometries and mechanical properties to be investigated. This, in turn, increases wind speed operational ranges of these flags and leads to reduced hysteresis during operation (as will be discussed in section 3). As such, the current study enables a more comprehensive investigation of both the dynamic response and power generation performance of inverted flags over wider ranges of operational speeds and planform parameters that have not been considered previously. Moreover, this study managed to identify the second moment of planform area as a promising power indicator parameter suitable to inform future optimization studies.
As described later, our composite inverted flags exhibit large-amplitude limit-cycle flapping at wind velocities in the range of 6–23 m s−1 and produce up to 0.45 mW of electrical power, which is enough to meet the demand of low-power sensor systems operating in the micro-Watt to milli-Watt power range. The present work is of experimental nature; therefore, no attempt is made here to extend the available theoretical models developed for non-composite homogenous flags (see [51] and the relevant literature cited therein) to composite inverted flags. This goes beyond the scope of the present work and will be considered in future studies. The rest of this paper is organized as follows: the fabrication of the inverted flags and the experimental procedure are described in section 2, whilst the results are presented and discussed in section 3. Section 4 then provides closing concluding remarks.
2. Materials and methods
2.1. Harvesters configurations
We adopted a composite inverted flag configuration that is essentially that of a bimorph comprising two piezoelectric layers, as shown in figure 2. These two layers are made from discrete PVDF elements and sandwich an elastic layer made from a stainless-steel shim by Precision Brand (www.precisionbrand.com; density: ρe = 7900 kg m−3; Young's modulus: Ye = 180 GPa; thickness: he = 0.1 mm). The two piezoelectric layers are bonded to the stainless-steel shim using thin double-sided adhesive tape by Tesa (www.tesa.com; density: ρb = 1100 kg m−3; thickness: hb = 0.1 mm). The PVDF elements used are from TE connectivity-model DT4-028K (www.te.com; density: ρp = 2280 kg m−3; Young's modulus: Yp = 2.8 GPa; piezo strain constant:  = 23 × 10−12C N−1; thickness: hp = 0.064 mm). Each PVDF element has silver ink screen-printed electrodes, all wrapped in a thin mylar film for protection. The inclusion of the elastic layer (core metal shim) was essential to allow a meaningful structure as the used PVDF elements were extremely flexible/loose. More importantly, and as discussed in the introduction, the inclusion of a metal core increases the elasticity of the flag thereby reducing any possible material memory effects (more on the memory effect will be discussed in section 3.1).
Despite of its less favourable power generation piezoelectric characteristics compared to other piezo-ceramic materials options, we identified PVDF as the most suitable piezoelectric material for inverted flag devices, owing to its high flexibility. In fact, so far, it has been the only piezoelectric material used for inverted flags construction (e.g. [36, 37, 52]). The specific PVDF element model used is currently the longest commercially off-the-shelf available product on the market, with dimensions of 171 × 22 × 0.064 mm (length × width × thickness). We were then able to produce harvesters of shorter length by trimming the PVDF elements to the desired length. The cutting of the PVDF element was done using a new scalpel each time to avoid potential contamination which could result in damage of the PVDF element. We have fabricated a total of 12 energy harvesting flags, three lengths and four widths. The three length values are 155 mm (flags F1–F4), 118 mm (flags F5–F8), and 78 mm (flags F9–F12). Note that 155 mm was the maximum length achievable after fixing PVDF elements within custom made clamps designed to provide a cantilever boundary condition at the trailing edge. The clamp rigidly fixed the trailing edge of the flags in a sandwich arrangement and was fabricated from laser cut Perspex (Hobarts Laser Supplies, Leybourne, UK (https://hobarts.com); model: AC.CLR0000.03.3020). Once the batch of longest flags was fabricated, a 2nd batch was fabricated at three-quarter length, i.e. 118 mm, then a 3rd batch was fabricated at half length, i.e. 78 mm. For each length value, the width was modified by modulating the number of PVDF elements added on both sides of the core metal shim. Here we realised four flags per each length value by allowing up to four PVDF elements on each side. This allowed us to have four different widths in total: 22, 44, 66, and 88 mm (note that 22 mm is the width of a single PVDF element). The 12 flags realised and their clamps are shown in figure 3, and the significant geometric parameters are summarized in table 1.
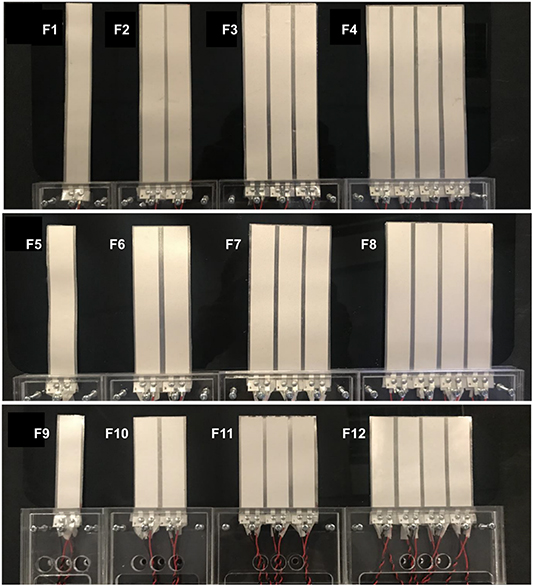
Figure 3. Harvesting flags realised for this study; top row: 155 mm length; middle row: 118 mm length; and bottom row: 78 mm length. Four width values were employed for each length by including one, two, three, and four PVDF elements on each side. A custom-made C-shape clamp was used to restrict the motion to a cantilever condition at the root (full clamp shown in bottom row). The parts of the PVDF elements within the clamps were completely restrained, hence cannot generate any mechanical strain, and therefore do not contribute to the power output.
Download figure:
Standard image High-resolution imageTable 1. Characteristics of the harvesters considered in this study.
| Flag | Mass ratio, 
| Length,  (mm)
(mm)
| Width,  (mm)
(mm)
| Aspect ratio, 
| Second moment of planform area, 1/3bl3 (cm4) | Optimum resistance, Ropt (kΩ) | Capacitance (nF) |
|---|---|---|---|---|---|---|---|
| F1 | 7 | 155 | 22 | 7.05 | 2731 | NA | 18.1 |
| F2 | 155 | 44 | 3.52 | 5462 | 1100 | 37.0 | |
| F3 | 155 | 66 | 2.35 | 8193 | 680 | 55.7 | |
| F4 | 155 | 88 | 1.76 | 10 923 | 450 | 72.9 | |
| F5 | 9.2 | 118 | 22 | 5.36 | 1205 | 1700 | 13.8 |
| F6 | 118 | 44 | 2.68 | 2410 | 700 | 28.0 | |
| F7 | 118 | 66 | 1.79 | 3615 | 350 | 42.8 | |
| F8 | 118 | 88 | 1.34 | 4820 | 210 | 58.2 | |
| F9 | 14 | 78 | 22 | 3.55 | 348 | 700 | 9.63 |
| F10 | 78 | 44 | 1.77 | 696 | 320 | 19.1 | |
| F11 | 78 | 66 | 1.18 | 1044 | 140 | 28.3 | |
| F12 | 78 | 88 | 0.87 | 1392 | 120 | 39.5 |
A key non-dimensional parameter to characterise the dynamic response of inverted flags is the mass ratio ( ), defined as [52–54]:
where ρs is the structural density of the flag,  is its thickness, ρf is the fluid density (in our case is air), and
  is the inverted flag length. The mass ratio represents the non-dimensional mass of the structure, which determines whether the structural motion is primarily inertia-driven or driven by the flow (i.e. relative magnitude of flag inertia to fluid inertia). For the 12 flags tested, all values in equation (1) are constant except for length, which thus implies that each batch of flags with the same length have the same mass ratio value, see table 1. Ideally, it would be useful to vary the mass ratio through changing the relative density as well; however, we were limited to the densities of the PVDF elements commercially available in the market. To ensure consistent functionality of each harvester, before testing in the wind tunnel all PVDF elements within each flag were individually tested and verified to be delivering the same power output. Then, these PVDF elements were connected to a load resistance in a parallel connection. As is well known, PVDFs generate electric power with comparatively high voltage and low current. Since low-power sensors typically operate on small voltages, the preferred connection of PVDF elements for final applications is parallel, whereas a series connection is of lesser practical interest and was therefore not explored. Following the common practice, the value of the optimum resistance that would allow a maximum power generation from a harvester was empirically determined. A variable resistance (by Time Electronics (www.timeelectronics.co.uk); model: 1040 Resistance Decade Box) was used to efficiently change the value of the resistance and subsequently measure the corresponding power generated. A power scan was hence conducted allowing the identification of the optimum load resistance value. Note that we were not able to identify an optimum resistance value for flag F1 as this flag did not demonstrate any steady flapping motion (more discussion to follow in section 3.1), meaning that this flag cannot generate continuous power.
The capacitance of the flags was measured using a multimeter (Testo Ltd, Alton Hampshire, UK (https://testo.com); model: Testo 760-2). The measured capacitance varies in proportion to the number and length of the PVDF elements present on each flag, as shown in table 1. Consider for example flags F1–F4: which have equal length and are comprised of two, four, six, and eight PVDF elements, respectively. Their capacitance increases in proportion to the number of PVDF elements, as expected for a parallel connection. A similar trend is noted for flags F5–F8 and F9–F12. On the other hand, when considering the set F1, F5, and F9—which are comprised of two PVDF elements of different length—capacitances are observed to increase in proportion to the length of the PVDF elements. This is also as expected since the amount of charge that a single PVDF element can store varies proportionally to its volume, which for fixed width and thickness is proportional to the PVDF element length. Similar trends can be noted for flags F2, F6, and F10; F3, F7, and F11; and F4, F8, and F12.
2.2. Experimental set-up
A schematic of the experimental set-up designed to characterize the dynamics and power output of the 12 harvesters is shown in figure 4(a). The clamped edge of the inverted flags was attached to a vertical pole located midway through the wind tunnel (Armfield Limited, Ringwood, UK (www.armfieldonline.com)). The wind tunnel has an octagonal cross-section with dimensions of 350 mm × 350 mm (height × width), figure 4(b). Before any tests were carried out, the free-stream airflow in the wind tunnel was characterized using a calibrated hotwire anemometer. The turbulence intensity was on average 0.6% for the range of air flow velocities from 1.5 to 25 m s−1 of interest for this study; the boundary layer thickness was within 5 mm at all air flow speeds tested; and the velocity profile (excluding the boundary layer) was uniform to within 1%, thereby assuring that the inverted flags were exposed to a fully-developed velocity profile during the tests. During testing, the airflow average velocity in the wind tunnel was measured using static/dynamic pressure ports connected to a calibrated pressure transducer (Sensirion (www.sensirion.com); model: SDP816) to within ±5% error. The ambient conditions during the tests were always around (298 ± 1)K and (101 ± 1)kPa.
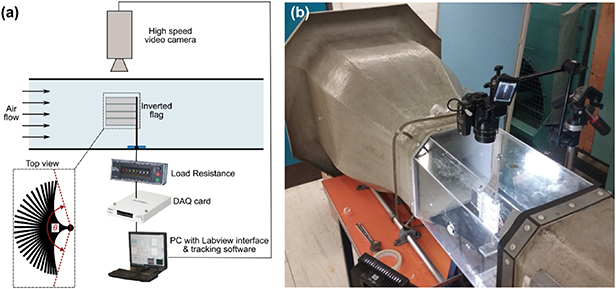
Figure 4. (a) Schematic of the experimental setup used to characterize the dynamics and power output of the piezoelectric inverted flag harvesters. (b) Test section of the wind tunnel with camera mounted on top.
Download figure:
Standard image High-resolution imageThe motion dynamics of the harvesters was recorded using a digital camera (Sony (www.sony.com); model: alpha 6300) located on top of the wind tunnel transparent testing section. The Camera was fitted with a Sony E PZ 16–50 mm F3.5–5.6 OSS lens, and videos were recorded at 100 fps with a resolution of 1920 × 1080 pixels (corresponding to a space resolution of 0.2 mm pixel−1). A black cardboard was attached to the bottom of the wind tunnel (from outside) to improve accuracy in optical tracking. A LED light was directed to the transparent testing section of the tunnel to improve the lighting conditions whilst recording the motion. All recorded videos are available via the open access repository Figshare through the link: https://doi.org/10.6084/m9.figshare.14540613. The videos were post-processed with Tracker version 5.1.3 (https://physlets.org/tracker/), a free open-source video analysis and modelling tool. The motion of the flag was characterized by identifying the oscillation flapping frequency at each specific wind speed, as well as the angular amplitude of motion,  , (measured within
  ). The angular amplitude of motion is defined as the angle between the two flapping extreme positions and the pole as seen from the top, see figure 4(a). This definition provides a typical representative measure of the flag's displacement which possesses a variable curvature when deflected [36]. For each flag, measurements were repeated several times with increasing and decreasing wind flow velocity, observing good repeatability (i.e. differences within measuring errors).
The power output from the inverted flag harvesters was collected using an external DAQ device (by National Instruments (www.ni.com); model: NI-USB-6225) and LabVIEW 2017 was used to process the data. The data acquisition program was written as a Virtual Instrument (VI) in LabVIEW 2017 using the standard DAQ-mx library. The program gathered, saved, and displayed real time data to allow an instantaneous power output to be seen, and to adjust the load resistance to its optimum value. Note that the optimum resistance value for each flag was identified and recorded separately before proceeding with the main experiment. The sampling rate was set at 1 kHz to allow sufficient resolution of data through a flapping cycle.
At the beginning of the tests the wind speed was low and the flag was aligned with the incoming flow. During the tests, the wind speed was gradually and step-wise increased until the flag became fully deflected; after that the wind speed was gradually and step-wise decreased until the flag resumed its configuration aligned with the incoming flow. As such, during all decreasing speed measurements, the initial state of the flags was the same in terms of dynamic response.
3. Results and discussion
In the follow subsections we start by providing a description of the three set of flags tested (mass ratio of 7, 9.2, and 14), before proceeding to analyse the ensemble of results to identify trends and common behaviours. The main dynamic states of motion described in the introduction section are clearly observed (see figure 1(b)). At low wind velocities the inverted flags remain in an in-line position, i.e. equilibrium configuration aligned with the incoming flow. As the wind speed increases, there is an onset speed (Uonset) after which the steady flapping mode is triggered. Beyond this speed, the inverted flags immediately become unstable and start to exhibit large-amplitude periodic limit-cycle oscillations which are characterized by side-to-side symmetrical motion of the flags. After a certain offset speed (Uoffs) the final state, deflected, is reached at which point the flag becomes fully deflected to one side with no or very small vibration around this deflected position. The three aforementioned states are the main states observed in all our experiments; however, there were cases where one-sided flapping was also evident and these will be discussed whenever relevant. Full data of the onset and offset speeds for each flag will be provided in section 3.4. As shown by Orrego et al [52], the dynamics of non-composite homogeneous inverted flags is well captured by the bending stiffness, a dimensionless parameter that depends on the Young's modulus and Poisson ratio of the flag material. Unfortunately, the bending stiffness has not yet been generalized to composite inverted flags, where the determination of the Young's modulus and Poisson ratio is not obvious and still being debated. In what follows, therefore, the data are provided in raw format as a function of the wind speed. Given that the focus of this work is to characterize the performance of inverted flags, and not to characterize the performance of individual PVDF elements, the measured results are here presented referring to inverted flags, and not to the individual PVDF elements included in each flag. Since the number of PVDF elements included in each flag is provided (see figure 3 and related discussion), the contribution of each PVDF element comprising a given flag (should this be of interest) can be figured out by simply dividing the flag total power (or power density) provided herein by the number of PVDF elements included within that flag. It is worth remembering that PVDF strips were trimmed to fit into flags of different lengths, and this should be considered when referring to individual PVDF elements.
3.1. Flags with mass ratio = 7
Figure 5 shows the measurement results for flags with mass ratio  (F1–F4; long flags) including the maximum angular amplitude of motion, the frequency of oscillation, and the power output, all presented as functions of the incoming wind velocity. Results are displayed for both increasing and decreasing wind speed. Measurements during the decreasing speed phase, and particularly their resemblance to the increasing speed curve, helps to identify the presence of any hysteresis effects, or the degree of material memory effect. If a memory effect is present, upon reaching a fully deflected status at high speed during the increasing phase, the limited elasticity of the flag will prevent it to return to the same oscillation state once speed has been decreased again. The investigation of both the increasing and decreasing phases is of significant importance in assessing the practicality of a flag in real-life applications.
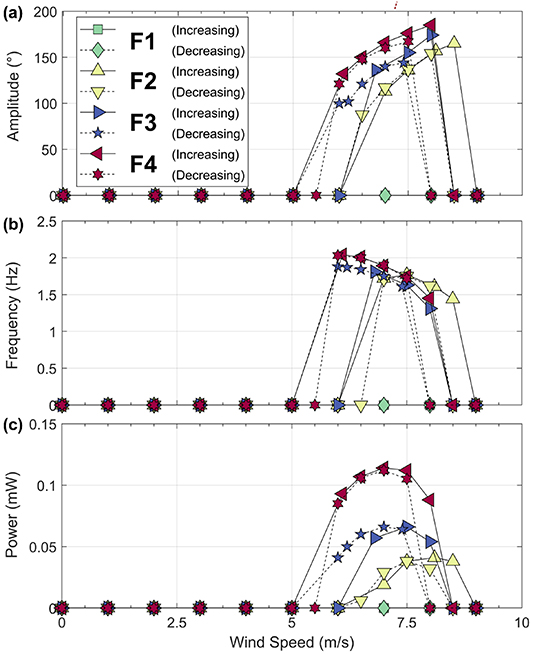
Figure 5. Dynamics and power generation characteristics of harvester flags of mass ratio of 7: (a) maximum angular amplitude of motion,  , vs wind speed; (b) flapping frequency vs wind speed; and (c) root mean square power output vs wind speed.
Download figure:
Standard image High-resolution imageIn figure 5, a strong correspondence between the increasing and decreasing curves in observed. The main difference between the two occurs at the transition between the in-line and the steady flapping modes. This is a typical behaviour of such flags [36], and suggests that the in-line configuration may be susceptible to finite-amplitude perturbations, such that the onset speed is dependent to minor imperfections in the flag configuration and/or disturbances in the incoming flow. This is a key to consider when designing these devices, since real conditions are constantly changing, as it can have an influence on the operational range. It can also be seen that to recover the flag from the deflected state to the flapping state, the speed needs to be reduced below the offset speed of the increasing curve before the flag is able to resume to large-amplitude limit-cycle oscillations. The reason for this phenomenon can be attributed to the mechanical properties of the components used in the fabrication of the flags. In particular, the relatively high flexibility of the flags needed for the large-amplitude flapping sacrifices their elasticity, which in turn implies that it is hard to recover the steady flapping state from the deflected state at large wind velocity, unless the wind velocity is reduced considerably. Nevertheless, the observed material memory effects are deemed to be minimal for this set of results, and serve to further demonstrate the role of the core metal shim in resisting this effect and thereby increasing the practicality and reliability of such functional devices.
During the steady flapping state, and as the wind speed is further raised beyond the critical value for onset of flapping mode, the angular amplitude undergoes a steady growth, whilst the flapping frequency gradually decreases. This was observed for all flags aside from F1 which did not exhibit a steady flapping mode; instead it transitioned directly from in-line straight to deflected mode. Correspondingly, as observed in figure 5, this flag has no recorded amplitude, no frequency, and thus no power output.
The dynamic motion of the steady flapping state arises from the imbalance between the destabilizing fluid pressure force and the restoring elastic force of the flag. The magnitude of the fluid pressure forces depends on the wind velocity (via the dynamic pressure) and on the projected area of the flag that is exposed to the incoming flow, with these factors being directly proportional to the flag amplitude of motion. On the other hand, the restoring elastic force depends on the elasticity of the flag (independent of wind speed) and, upon initiation of the flapping regime, the deformation of the flag. The latter is of course dependent on the amplitude of flapping motion, analogous to a spring which generates a restoring elastic force proportional to its compression. As the wind velocity is gradually increased, so then would the dynamic pressure and, in a continuous positive feedback loop, the fluid pressure force also increases, leading to an increase in the flag amplitude of motion. In turn, this increased range of motion raises the projected area of flag, i.e. that which is exposed to the incoming flow, and simultaneously infers an increase of the restoring elastic force. The gradual increase of the flapping amplitude with increasing wind velocity observed in figure 5(a) indicates that the destabilizing fluid pressure force increases with wind speed faster than the restoring elastic force. On the other hand, the decrease in flapping frequency with increasing wind velocity shown in figure 5(b) can be the consequence of dynamic damping [36]. With respect to power output, F2–F4 all have a peak power output at a particular wind speed within the large-amplitude limit-cycle oscillation range. Power is known to be dependent on flapping amplitude and frequency, and because one is increasing whilst the other is decreasing, a peak for the output power is not unexpected. Clearly, wider flags (i.e. comprising multiple PVDF elements) generate more power output, due to the larger active PVDF area undergoing deformation.
Figure 5 also reveals that the angular amplitude is larger for a harvester with smaller aspect ratio. This is also the case for frequency and maximum power output. The reason for the growth in angular amplitude with decreasing aspect ratio is closely related to the projected area that the flags exposes to the oncoming flow. Given that this batch of flags has a constant length, the projected area is therefore larger for a flag with smaller aspect ratio (wider flag). At any given wind velocity, a wider harvester therefore encounters a stronger destabilizing fluid pressure force, yielding larger flapping angular amplitude. On the other side, the additional PVDF elements present in a wider flag, together with a larger flapping amplitude, act in combination to increase the restoring elastic force of harvesters, leading to more intense competition between the destabilizing fluid pressure force and the restoring elastic force of the flag, and thus to the increase of flapping frequency. However, it is important to stress that this increase in frequency is much smaller when compared to the increase in flapping angle or power.
3.2. Flags with mass ratio = 9.2
Figure 6 shows the measurement results for flags with mass ratio,  (F5–F8) including the maximum angular amplitude of motion, the frequency of oscillation, and the power output all presented as functions of the wind velocity, for both measurements of increasing and decreasing wind speed. Again, the three main dynamic responses of inverted flags discussed in section 3.1 (in-line, steady flapping, and deflected) are clearly noticeable as the wind speed is gradually changed. Nevertheless, there are several minor differences in these results when compared with flags with
  . First, it is evident that the higher mass ratio needs larger onset speed to trigger the transition from the in-line configuration to the steady flapping. The onset speed to transition from steady flapping to deflected mode is also increased with respect to flags with
  . Similarly, for the decreasing stage, onset wind speeds for the two inverse transitions from deflected to steady flapping and then to in-line mode have also both increased. All values of onset and offset speeds for both increasing and decreasing measurements will be summarised in section 3.4.
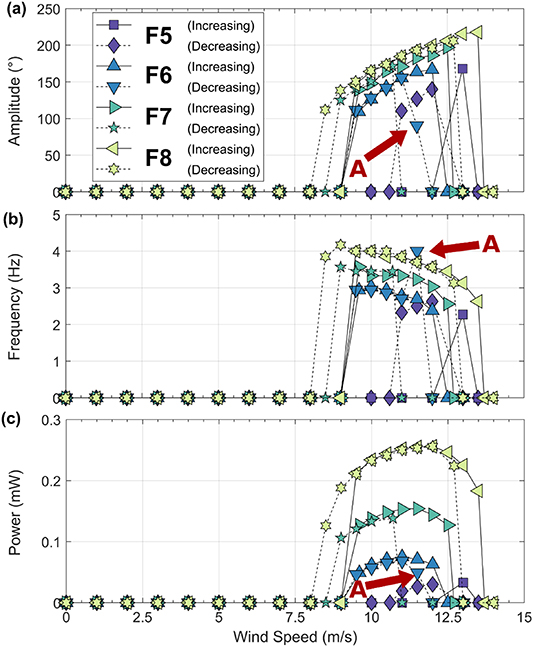
Figure 6. Dynamics and power generation characteristics of harvester flags of mass ratio of 9.2: (a) maximum angular amplitude of motion,  , vs wind speed; (b) flapping frequency vs wind speed; and (c) root mean square power output vs wind speed.
Download figure:
Standard image High-resolution imageGenerally, transitions between different dynamic modes are delayed to higher wind velocities. As a result, the hysteresis observed at the transition between the in-line mode and the steady flapping mode is slightly wider for this batch. The most significant difference we observed was for flag F5, the most slender flag in this batch, which displayed a particularly small operating velocity range from 13 to 13.5 m s−1 when increasing wind speed, and a slightly larger operating velocity range from 12 to 11 m s−1 in the decreasing phase. This drop in performance vs other flags in this batch is an indicator that higher aspect-ratio flags may be a less favourable choice for the design of energy harvesters.
Of particular note in this batch is the occurrence of additional 'pseudo state' of motion, in the form of an uncharacteristically large frequency and small amplitude for flag F6 (flag with aspect ratio 2.68, labelled 'A' in the figure). During the decreasing speed phase, at the expected point of transition from the deflected to steady flapping, this flag entered a one-sided flapping state prior to entering the steady flapping state (see figure 1(b)). In the one-sided flapping mode, the flag enters into a steady, periodic oscillation about a deflected equilibrium position, where oscillations have smaller amplitude and higher frequency. Although rare, the existence of this state was verified by repeat tests and was also previously reported in a numerical study by Huang et al [55].
Compared to the  flags, the current flags with
  exhibit consistently larger flapping amplitudes (reaching ∼
 ) and flapping frequencies are almost doubled. Correspondingly, a larger curvature was observed adjacent to the clamped edge which, in turn, leads to higher mechanical strain and thus to higher power output from PVDF elements. A similar correlation with aspect ratio is observed for this set of flags as for the previous set. As aspect ratio decreases, both angular amplitude and flapping frequency increase modestly, while power generated demonstrates a larger increase.
3.3. Flags with mass ratio = 14
Figure 7 shows the measurement results for flags with mass ratio  (F9–F12) including the maximum angular amplitude of motion, the frequency of oscillation, and the power output all presented as functions of the wind velocity, for both increasing and decreasing speed phases. Comparing figures 6 and 7, the angular amplitude of the flags with
  is similar in the steady flapping mode to those with
  . However, and as expected, the flapping frequency for this batch of short flags increased significantly. Furthermore, the prevalence of the one-sided flapping increased, indicating that short flags are more prone to enter into this pseudo state during the transitions between steady flapping and deflected mode. Figure 7 also shows a larger 're-start' lag between increasing and decreasing wind speed measurements for the same transition point. This indicates that the hysteresis effect is more pronounced for short inverted flags. It seems that flags with high mass ratio require a higher onset speed to trigger the transition to steady flapping; though once triggered, these flags have a significantly wider working range of wind speeds. Again, figure 7 demonstrates the same correlation of aspect ratio on the angular amplitude, flapping frequency, and power output.

Figure 7. Dynamics and power generation characteristics of harvester flags of mass ratio of 14: (a) maximum angular amplitude of motion,  , vs wind speed; (b) flapping frequency vs wind speed; and (c) root mean square power output vs wind speed.
Download figure:
Standard image High-resolution imageComparing figures 6 and 7, it is evident that flags with mass ratio of 14 generated much more power than their counterparts with mass ratio of 9.2. Whilst the angular flapping amplitudes of the harvesters in the two groups are similar, the flapping frequencies are significantly increased, which is the reason why power output is increased largely. The more active region of piezoelectric material is the small part close to the clamped edge, irrespective of the flag length. From a practical viewpoint, this indicates that the design of a composite inverted flag may be optimized by sizing the passive elastic layer to achieve the desired interaction with the wind; locating active PVDF strips only where the curvature of the flag is more pronounced. However, this optimization of the composite inverted flag configuration goes beyond the scope of the present study, and is therefore not considered further at this stage.
3.4. Summary of flags characteristics
The results presented and discussed in the previous three sections are condensed and summarized in figure 8 to provide a global overview of the flags dynamics and power generation throughout the parameter space. Results are shown for aspect ratio vs amplitude, frequency, and power density with results from different mass ratios plotted on the same graph for both increasing and decreasing wind speed. The identified dynamic states (four including the one-sided flapping state) are also included via symbols. Several important trends are apparent in this global view. As observed in the previous sections, for a given mass ratio, the maximum amplitude occurs at the end of the steady flapping mode, while the maximum frequency occurs at the start of this mode. Here, power density (i.e. power divided by PVDF layers volume) is plotted instead of power to facilitate a fairer comparison. Maximum power density is conveniently reached at the centre of the operational steady flapping range. Furthermore, when plotted together in this manner, the power density generated by the  flags is seen to be considerably larger than that for the other two cases, by a factor of at least three.

Figure 8. Summary of all flag performance tests. Plots of aspect ratio vs speed (increasing then decreasing) for (a) amplitude, (b) frequency and (c) power density. Islands of colour contours represent the three mass ratios tested as labelled where legends provide corresponding magnitudes. Superimposed state maps representing observed flag behaviour: in-line (.), steady flapping (+ symbol), one-sided flapping ( ), deflected (∘). Red arrows indicate direction of increasing wind speed.
Download figure:
Standard image High-resolution imageFigure 8 also provides a visual means to compare the relative operational range of each flag, corresponding to the occurrence of the steady flapping state, represented by the width of the contour regions for both increasing and decreasing phases. The width of the range clearly increases as mass ratio increases, and also increases with reducing aspect ratio for any given mass ratio. Secondly, as the mass ratio increases there is a strong shift towards higher velocity values, i.e. flags with higher mass ratio are more suitable for operation at higher wind speeds. Interestingly, the flags tested in this study, when taken as a complete set, offer almost continuous coverage across the wind speed range of 6–23 m s−1, which would comfortably encapsulate most ambient wind speed brackets. Towards the goal of a more stable and continuous source of power, this observation then motivates the future development of a device which incorporates either a set of flags with variable length, or a single flag capable of dynamically modifying its length according to different conditions. Finally, figure 8 provides a means to evaluate the hysteresis effect. It is reconfirmed that there is, in general, a small shift in the range towards lower speed values for decreasing measurements, and that this shift increases as the mass ratio increases. This implies that flags with higher mass ratios, despite demonstrating larger power density values (see figure 9), are more sensitive to varying flow conditions which may be a practical concern in real-life applications.
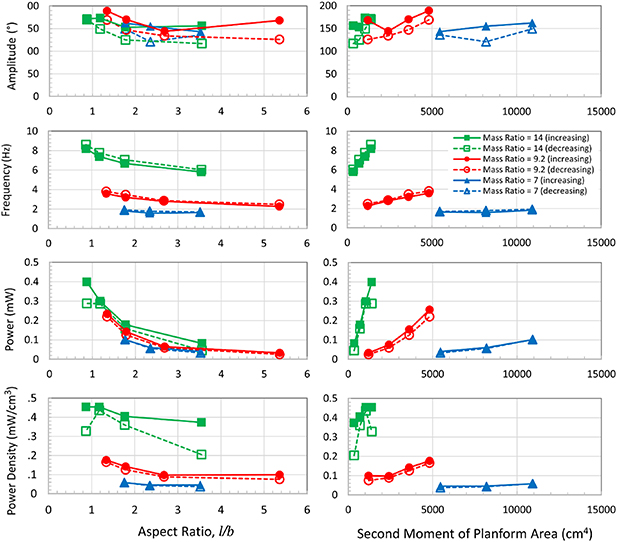
Figure 9. Dynamics response and power generation characteristics as function of (left) aspect ratio and (right) second moment of planform area for different mass ratios. Filled markers represent values averaged from increasing speeds while empty markers represent values averaged from decreasing speeds. Rows demonstrate average angular amplitude of motion; average flapping frequency; average power output; and average power density. Data are based on values of tables 2 and 3.
Download figure:
Standard image High-resolution imageTable 2. Dynamics and power characteristics of the harvesters for increasing measurements.
| Flag |

|

| Uonset (m s−1) | Uoffset (m s−1) |
θavg
( ) )
| favg (Hz) | Pavg (mW) |
|---|---|---|---|---|---|---|---|
| F1 | 7 | 7.05 | NA | NA | 0 | 0 | 0 |
| F2 | 3.52 | 7 | 8.5 | 143 | 1.64 | 0.04 | |
| F3 | 2.35 | 6.8 | 8 | 155 | 1.58 | 0.06 | |
| F4 | 1.76 | 6.1 | 8 | 162 | 1.83 | 0.101 | |
| F5 | 9.2 | 5.36 | 13 | 13.5 | 168 | 2.27 | 0.033 |
| F6 | 2.68 | 9.6 | 12.5 | 144 | 2.8 | 0.065 | |
| F7 | 1.79 | 9.6 | 12.7 | 170 | 3.2 | 0.142 | |
| F8 | 1.34 | 9.5 | 13.7 | 189 | 3.58 | 0.234 | |
| F9 | 14 | 3.55 | 19.5 | 21.5 | 156 | 5.81 | 0.082 |
| F10 | 1.77 | 17.6 | 23 | 153 | 6.68 | 0.178 | |
| F11 | 1.18 | 15.5 | 21.5 | 173 | 7.38 | 0.299 | |
| F12 | 0.87 | 15.5 | 23 | 172 | 8.18 | 0.399 |
Table 3. Dynamics and power characteristics of the harvesters for decreasing measurements.
| Flag |

|

| Uonset (m s−1) | Uoffset (m s−1) |
θavg
( ) )
| favg (Hz) | Pavg (mW) |
|---|---|---|---|---|---|---|---|
| F1 | 7 | 7.05 | NA | NA | 0 | 0 | 0 |
| F2 | 3.52 | 8 | 7 | 136 | 1.69 | 0.033 | |
| F3 | 2.35 | 7.4 | 6 | 121 | 1.79 | 0.056 | |
| F4 | 1.76 | 7.5 | 6 | 149 | 1.91 | 0.102 | |
| F5 | 9.2 | 5.36 | 12 | 11 | 126 | 2.49 | 0.025 |
| F6 | 2.68 | 11.5 | 9.5 | 134 | 2.86 | 0.059 | |
| F7 | 1.79 | 10.7 | 9 | 147 | 3.49 | 0.125 | |
| F8 | 1.34 | 12.7 | 8.5 | 169 | 3.81 | 0.22 | |
| F9 | 14 | 3.55 | 19 | 16 | 117 | 6.04 | 0.045 |
| F10 | 1.77 | 19 | 16.5 | 125 | 7.06 | 0.158 | |
| F11 | 1.18 | 18 | 14.5 | 149 | 7.78 | 0.287 | |
| F12 | 0.87 | 19 | 13.5 | 170 | 8.61 | 0.288 |
Key characteristics from our tests are summarised in tables 2 and 3 for increasing and decreasing wind speed, respectively. These characteristics include: (a) Uonset which is the wind speed for transition from in-line to flapping in the increasing phase and the transition from deflected to flapping in the decreasing phase; (b) Uoffset which is the wind speed for transition from flapping to deflected in the increasing phase and from flapping to straight in-line in the decreasing state; (c) θavg, favg, and Pavg which are the average/mean value for flapping amplitude, flapping frequency, and power generated during the large-amplitude limit-cycle oscillation steady flapping mode. Note that we decided to represent the power generation performance through the average power value rather than the peak power value. Whilst the peak will demonstrate higher power capability, we believe that the average is fairer and more representative of the flag performance over the whole operational range.
3.5. Aspect ratio and second moment of planform area effects
Analysis of average performance values provides a broader analysis of the results and accordingly these are plotted in figure 9. For example, it can be seen that for a given flag, the angular amplitude and power output during increasing wind speed measurements are slightly larger than those during decreasing wind speed measurements, whereas the frequency during increasing wind speed measurements is a bit smaller than that during decreasing wind speed measurements. This observation actually matches our previous discussion: as wind speed increases during the flapping mode, the angular amplitude increases whilst the flapping frequency decreases. When decreasing wind speed, the harvesters work within lower wind velocities, which is the reason why the stage of decreasing wind speed exhibits smaller amplitude and higher frequency.
Figure 9 shows the average values of angular amplitude of motion, flapping frequency, power output, and power density, all presented as functions of both aspect ratio (a key variable in quantifying the aerodynamic response of bodies to external air flow, e.g. wings [56–59]) and the second moment of planform area, as explained later on. Results are plotted for both increasing and decreasing speed phases. It is evident from figure 9 that all flags (with the exception of F1) exhibit large-amplitude oscillation during both increasing and decreasing wind speed measurements, and the values of the average angular amplitude are similar between flags. For increasing wind speed measurements, the average angular amplitude had a range of  , whereas these values were a bit lower for decreasing wind speed, ranging within
  . In general, for a given mass ratio, the average angular amplitude demonstrates a relatively slow non-linear decreasing trend as aspect ratio increases. This is in line with the results reported by Tang et al [60] who reported a numerical investigation for non-energy harvesting flags with aspect ratio up to 2, showing that smaller aspect ratio flags achieve larger flapping amplitudes. Remarkably, mass ratio does not have a strong impact on the angular flapping amplitude values when plotted against aspect ratio. A decreasing trend is also evident with respect to the average flapping frequency, i.e. for a given mass ratio, larger aspect ratios lead to lower flapping frequencies. Nevertheless, mass ratio has a more pronounced effect on flapping frequency when plotted against aspect ratio, such that the average frequency is greater for larger mass ratios.
In terms of the average power output, for a given mass ratio flags with lower aspect ratios generated more power for both increasing and decreasing wind speed measurements. On the other hand, increasing mass ratio allows an improvement of the power output. Clearly, the aspect ratio has more influence on the power generated when compared to mass ratio. It is evident that the power density increases with mass ratio in a very similar fashion to the variation of flapping frequency with mass ratio. There is also generally a slight decrease of power density with aspect ratio. These trends of power density against mass ratio and aspect ratio agree with the results by Orrego et al [52] which were for non-composite homogeneous flags with smaller range of mass ratio ( ) and aspect ratio (
 ).
).
Considering the fact that some flags share similar aspect ratio (such as F2 and F9 as well as F4, F7, and F10) whilst demonstrating quite different dynamic responses, it is convenient to introduce another geometric parameter capable of characterising the performance of the different flags more precisely [61]. For this purpose, we have used the second moment of planform area (values and formula provided in table 1), which measures how the points of the flag surface are distributed in space with respect to the fixed trailing edge. The rationale for using the second moment of planform area to characterize the performance of inverted flag harvesters can be summarized as follows. Not all regions along an inverted flag harvester deform and produce energy at the same rate. The strain, and thereby the piezoelectric power generation, is highest close to the fixed trailing edge and gradually decreases along the flag as the distance to the trailing edge increases. This suggests that a parameter capable of concisely characterizing the performance of inverted flag harvesters should be constructed in such a way that each portion of the harvester area is weighted based on its distance to the fixed trailing edge. This is precisely what happens with the second moment of the planform area, where each portion of harvester area is weighted based on the square of its distance to the flag root. Even though the second moment of planform area is a dimensional parameter, it allows much more distinct values for the flags considered in this study (i.e. values in table 1 are sufficiently different). This is immediately evident from figure 9 which demonstrates that for each given mass ratio, as second moment of area increases the angular amplitude, the flapping frequency, the power output, and the power density all increase in a near-linear fashion, for both increasing and decreasing wind speed. Additionally, the higher the mass ratio, the steeper the increase in flapping amplitude, frequency, power output, and power density. It is, therefore, evident that the second moment of planform area provides a clear distinction between the different mass ratio curves. The same distinction was not that evident when aspect ratio was used, demonstrating the convenience of using the second moment of area as a parameter to quantify planform effects on the performance of inverted flags.
3.6. Comparison with previous designs from the literature
In order to put the present results into perspective, we now compare the power output of our inverted flags against previous results available in the literature. For consistency, the comparison is limited to studies where PVDF elements were tested in bending mode under controlled conditions inside a wind tunnel. Vatansever et al [62] tested a single PVDF strip (model: LDT4-028K) whose end was fixed to the wind tunnel wall, measuring a maximum power density of 0.16 mW cm−3 at a wind speed of 10 m s−1. Hobeck and Inman [49] studied an in-line piezoelectric harvester array comprising six PVDF strips (model: LDT2-028K/L) in a so-called artificial piezoelectric grass arrangement, which produced 1.2 μW per cantilever at 7 m s−1 corresponding to a power density of around 0.0051 mW cm−3. Note that these previous studies, whilst employing PVDF elements in wind flow, differ in terms of the actual orientation of the PVDF strips with respect to the incoming wind flow. Orrego et al [52] tested non-composite homogeneous inverted flags realized with PVDF strips (model: LDT4-028K/L) measuring a maximum power density of 0.7 mW cm−3 at a wind speed of 9 m s−1. Note that, for consistency of comparison with other studies, the previous power density value from Orrego et al [52] is here re-calculated based on the total volume of the PVDF elements rather than the active volume. Silva-Leon et al [36] tested composite inverted flags realized with PVDF strips as active elements (model: LDT2-028K/L) and a stainless-steel shim as elastic support, measuring a maximum power density of 0.48 mW cm−3 at a wind speed of 26 m s−1.
Compared to the previously discussed concepts, the present composite inverted flag design is a viable concept that within the limits of the present study is capable of generating up to a peak power value of about 0.45 mW total power (based on F12), corresponding to a power density of 0.6 mW cm−3 at a wind speed of 18 m s−1, quite enough to supply low-power remote sensors or small-scale portable electronics. This shows that the concept presented herein, despite differences in PVDF model and geometry, achieves power densities comparable/similar to previous inverted flag concepts. Moreover, in comparison with a non-composite homogeneous flag, a composite flag construction provides design/operational benefits that are summarised in table 4.
Table 4. Comparison of non-composite vs composite inverted flag configurations.
| Point of comparison | Non-composite (homogeneous) inverted flag (no shim) | Composite inverted flag (shim) | Comment |
|---|---|---|---|
| Ability to tune flexibility/elasticity | Low—constructed from a single PVDF layer providing limited options in controlling mechanical properties. | High—the presence of an elastic layer allows for wider range of possibilities in tailoring mechanical properties to desired responses. | — |
| Ability to modulate planform geometry | Low—the high flexibility of the PVDF layer poses limitations on feasible dimensions/aspect ratios that can be realized whilst retaining acceptable structural integrity, e.g. Orrego et al [52] explored an aspect ratio range of 0.5–2. | High—the presence of the elastic layer allows structural support for the highly flexible PVDF layers enabling wider ranges of dimensions/aspect ratios to be explored, e.g. the current study tested an aspect ratio range of 0.9–7. | The degree of modulation that can be achieved in planform geometry directly influences the range that can be tested for other relevant parameters such as mass ratio and second moment of planform area. |
| Range of operational wind speeds | Limited—due to limitations in mechanical and/or geometrical characteristics that can be realized, e.g. flags of Orrego et al [52] operated at wind speed ranges of 3–9 m s−1 hence are more suitable for lower speed applications. | Wide—due to higher ability to tune mechanical and/or geometric characteristics, e.g. flags of the current study operated at wind speed ranges of 6–23 m s−1 hence are more suitable for higher speed applications. | This refers to the range of wind speeds over which the flag is capable of continuous steady flapping operation. |
| Hysteresis | High—see hysteresis assessment of non- composite flags conducted by Cioncolini et al [37]. | Low—as shown in the current study (see discussions in section 3 of the current study). | Hysteresis is assessed by the degree of resemblance between measured responses when testing under increasing and decreasing wind speed conditions. |
3.7. Composite vs non-composite inverted flags
To demonstrate the benefits of including the metal shim, we tested 12 non-composite inverted flags, using the same PVDF elements model (DT4-028K/L) but without the metal shim; in this case the length and width are identical but with less thickness. Figure 10 shows one of these flags at rest, where it is evident that without the metal shim, the flag does not possess sufficient rigidity to maintain a vertical alignment without folding over on itself. We tested these new flags in the wind tunnel covering the same flow speeds considered for the composite flags. None of these non-composite inverted flags could produce a flapping motion suitable for the energy harvesting application.
Figure 11 displays a comparison of previous studies, both experimental (including energy harvesting and bare inverted flags) [36, 37, 52, 63, 64] and numerical (for bare inverted flags) [60, 65], as well as the results from the present study for the best performing flag, with and without the metal shim. The best performing flag in the present study is flag F12 as it has demonstrated the highest power and power density values as evident from figure 7(c) and tables 2 and 3. Hence, in figure 11, the energy harvesting inverted flags are represented by points corresponding to peak power density operation. Previous studies, summarized in [51], indicate that the dynamic flapping state exists within a narrow instability range of bending stiffness  of approximately 0.1–0.4, whereas it is largely insensitive to the mass ratio
  , represented as a grey band in the figure.
It is important to note that to date, successful demonstration of flapping and power generation by PVDF inverted flags have only been realized using the LDT models of PVDF (by TE connectivity), as documented in Orrego et al [52] and in our previous work [37]. In these cases, the PVDF model configuration incorporates a thick mylar covering, which provided sufficient structure integrity to allow operation in the instability range discussed above and shown in figure 11. As shown in figure 10, the stiffness of flags tested without the metal shim is too low to operate in the instability range. The inclusion of the metal shim is necessary in order to reach the critical stiffness range, to enable successful flapping and hence power generation. The additional mass from the shim results in an increase in mass ratio as indicated in the figure.
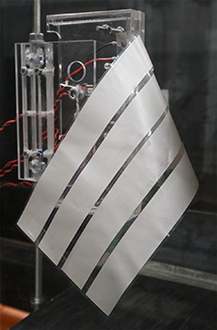
Figure 10. Example non-composite flag with four PVDF elements and length of 155 mm. Clearly, the absence of metal shim hinders the flag to be able to point towards the flow direction, hence the concept of the inverted flag is inapplicable with such construction.
Download figure:
Standard image High-resolution image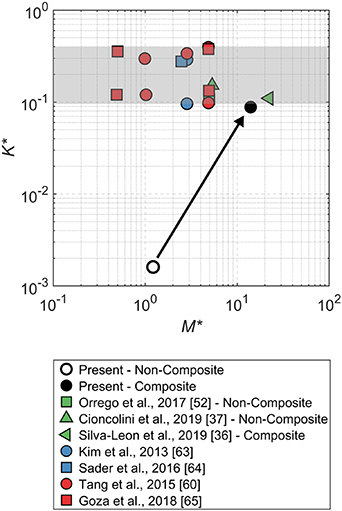
Figure 11. Bending stiffness  (definition from Orrego et al [52]) vs mass ratio
  (equation (1)), for range of energy harvesting inverted flag experimental data (green filled markers), bare inverted flag experimental data (blue filled markers) and bare inverted flag numerical data (red filled markers), compared to present results for best performing flag (black circles), both with (filled) and without (empty) shim. Grey transparent region corresponds to instability range as summarized by Yu et al [51]. Arrow added to emphasise shift in parameter space due to addition of shim.
Download figure:
Standard image High-resolution image
In summary, the incorporation of the metal shim enables for the 1st time the successful incorporation of the thinner DT PVDF models (by TE connectivity) for the purpose of inverted flag energy harvesting configurations. Note that both LDT and DT models have the same PVDF film thickness (28 µm), while the former is encapsulated in a much (approximately four times) thicker mylar coating than the latter. Furthermore, the metal shim provides a practical demonstration of the operational benefits of higher  configurations. Higher
  flags are advantageous compared to lower
  flags, since they are able to maintain a stable flapping state over a wider range of wind speed. The metal shim also increases the resilience of the flag, reducing hysteresis and structural fatigue, thus extending flag operational lifespan.
4. Concluding remarks
In this paper we conducted a parametric experimental investigation into the influence of planform geometry and excitation effects on the dynamic response and wind energy harvesting performance of PVDF-based inverted flag harvesters of composite design. Twelve inverted flag harvesters (divided into three batches with three different lengths and four different widths) were realised and tested for wind velocities between 1.5 and 25 m s−1 allowing an investigation of mass ratios ranging between 7 and 14 and aspect ratios ranging between 0.9 and 7, which are ranges that have not been tested before. The measurements conducted exposed the influence of aspect ratio, mass ratio, and second moment of area on the flapping amplitude, flapping frequency, power generation, and operational velocity ranges. High-aspect-ratio flags (e.g.  and
and  ) exhibited undesirable performance in the sense that they only had a very narrow working range of wind speed, or could not flap at all (directly underwent full deflection). For the other flags with lower aspect ratio, it was found that as wind speed increases during flapping mode, the angular amplitude increases steadily whilst the flapping frequency shows a trend of reduction, hence the power output displays a peak. It was found that for a given mass ratio, the average values for amplitude, frequency, and power output and density of the flags all decreases in a non-linear fashion as aspect ratio increases. We have also shown that the second moment of planform area can be used to assess the planform effects of the inverted flags. In fact, we demonstrated that the second moment of area can provide better distinction for the different flag performance characteristics compared to aspect ratio. For a given mass ratio, the average values for amplitude, frequency, and power output and density of the flags all increases in a near-linear fashion as second moment of planform area increases. Mass ratio was found to have a significant impact on operating ranges of the flags. On one hand, harvesters with higher mass ratios have a wider working range of wind speed and higher power densities. However, on the other hand, flags with higher mass ratios show a larger lag between increasing and decreasing wind speed measurements implying that they are more sensitive to variations in operating conditions. Finally, for higher mass ratio, the increase in flapping frequency and power output is more rapid as second moment of planform area increases. We believe that the findings from this study are insightful for researchers looking into the design and sizing of this kind of devices. Equally important, we believe that the comprehensive data sets provided represent an opportunity for researchers developing numerical tools to simulate such devices to validate, test, and calibrate their developed tools against a wide set of cases.
Acknowledgments
The authors are grateful to Andrew Kennaugh and Samuel Weigert from the Department of Mechanical, Aerospace and Civil Engineering of the University of Manchester for their help during the realization and testing phases of the work.
Data availability statement
All data that support the findings of this study are included within the article (and any supplementary files).