

Abstract
Magnetorheological (MR) foam, which is comprised of magnetic particles inside the matrix phase, is capable of changing its physical and rheological properties corresponding to the applied magnetic field. However, the performance of this material seems unsatisfactory due to the nonuniform distribution of magnetic particles throughout the composite area resulting in uneven magnetic properties. Since uniform magnetic properties are significant regarding MR foam, in situ fabrication using a polyvinyl chloride mould can be used to achieve the targetted improvement. MR foam was prepared with various amounts of carbonyl iron particles (CIPs), 0, 35, 45 and 55 wt%, and investigated at three different positions (top, middle and bottom parts) with a vibration sample magnetometer. The results showed that the hysteresis loop at all CIP concentrations of 35, 45 and 55 wt% exhibited superparamagnetic properties with magnetic saturation. The Ms of the top, middle and bottom positions were almost the same with a small standard deviation below 2 Am2 kg–1. Moreover, it is observed that the effect of porosity results in the enhancement of the magnetic saturation and remanence values. These results reveal the promising uniform magnetic properties of MR foam, which can benefit the industry by helping produce a consistent MR foam.
Export citation and abstract BibTeX RIS
1. Introduction
Foam has a high energy absorption capacity, making it suitable for use as an absorber material for shock damping [1], and it is widely used in many industries, for example furniture, mattress and automotive applications. The demand for foam has been increasing, since it can be produced with a wide range of properties by modifying parameters such as the chemical ratio and stirring speed [2], stirring time [3], mould temperature and pressure [3] and curing process [4]. Other than that, composite foam has been developed by using several fillers like melamine [3], carbon, graphite and graphene [4] in order to improve its mechanical properties. Due to its versatile properties, a lot of new research has been initiated in developing the material, including magnetorheological (MR) foam, for example.
MR foam is a controllable material that reacts to a magnetic field, where in the presence of magnetic fields, MR foam bulk dimension, solubility, mechanical strength and stiffness can change due to the arrangement of magnetic particles [5]. Usually, magnetic particles like carbonyl iron particles (CIPs) are used as a filler and added to a polymer/metal matrix during fabrication using two methods. The first method is called ex situ, in which cured foam is immersed in a fluid (hydro carbon oil) that contains CIPs in order to suspend the latter in the pores of foam, as shown in figure 1(a). The other method, as illustrated in figure 1(b), is called in situ since the CIPs are embedded in the polymer foam matrix in the strut rather than in the pores after the curing process. The in situ method promises a low percentage of magnetic particle sedimentation because the particles have been locked in the matrix rather than being suspended in the foam pores [6, 7]. However, the nonuniform dispersion of magnetic particles and the collapse in MR foam morphology using the in situ method have been observed and are a risk for production [7, 8].
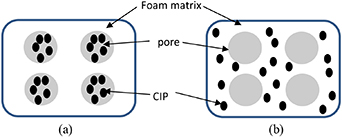
Figure 1. The distribution of magnetic particles through (a) the ex situ and (b) the in situ methods.
Download figure:
Standard image High-resolution imageThe researcher Schumann and co-workers [8] studied the pore distributions in MR foam, which was prepared using the in situ method. They found that increasing CIPs in the MR foam led to a decrease in the perimeter of the foam pores. In the meantime, the CIP content has a drawback effect on the foam. Indeed, from the prepared bulk MR foam, only the middle part was valid for use. The CIPs affected the reaction of the foaming process causing a collapse in the morphology of the top and bottom parts of the MR foam thus invalidating it for use. They concluded their study highlighting the importance of verifying the procedures that led to a uniform dispersion of CIPs in the MR foam. A similar issue has been observed in two polyolefin elastomer MR foams, namely ethylene octane copolymer foam and ethylene vinyl acetate copolymer foam prepared by Volpe et al [7]. A foam injection moulding method was used to mix the polymers and CIPs. Unfortunately, this method produced nonuniform MR foam morphology at different positions of MR foams. The difference in morphology is proportional to the difference in densities at different positions, which was possibly affected by the nonuniform dispersion of CIPs. Their advanced study on magneto-elastic behaviour responding to a magnetic field shows that different positions of the MR foam exhibit different magneto-elastic behaviour due to the difference in the distribution of CIPs. Thus, it is crucial to make sure the dispersion of the MR foam is uniform to ensure that all the prepared bulk MR foam has the same functioning response in order to optimise production.
The challenge of producing foam without it collapsing relates not only to MR foam but also to other composites. Konig et al [3] mentioned the collapse in foam structure when the filler concentration was high and the size larger than 100 μm. The high concentration of filler increases the viscosity of polyol and the heating capacity of the foam, leading to a decrease in the expansion of carbon dioxide gases; thus the foam structure collapsed. In another study, where talc is used as a filler in polyurethane (PU) matrix foam, Sung and Kim [9] found that poor interfacial bonding between the matrix and the talc surface contributed to the collapse of the foam. Even though increasing the talc concentration would accelerate the foaming process, a collapse in foam structure and the nonuniform distribution of filler is also possible. Previously, a study by Ding et al [10] found a method to overcome the collapse issues occurring in MR foam. The author fabricated a flexible carbonyl iron carbon nanotube polydimethylsiloxane composite with several steps such as a spray-drying process, vulcanisation, immersion and sonication. The method was able to produce foam without collapsing its structure. However, close equipment control is required in order to control the temperature and pressure making it an unpopular way to produce MR foam. This is because a more complicated chemical reaction occurs by increasing the filler, drastically changing the temperature and pressure of the reaction during the foaming process [1, 3, 9]. This phenomenon also drags the foam matrix during expansion, impacting the nonuniform structure especially due to the foam sticking to the mould. In order to avoid this issue, boron nitride was coated on the surface of the aluminium mould, although the structure of foam was still poor [8].
Therefore, in this study, first in order to avoid the issue of sticking, the mould was created using a polyvinyl chloride mould with a smooth surface. Secondly, the preparation was done at room temperature to avoid rises in temperature during the reaction. For the polymer matrix, flexible PU foam was introduced due to the elasticity property offered by this matrix which is easy to control. MR foam is fabricated using an in situ fabrication. The aim of this research is to produce MR foam with uniform magnetic properties. The analysis focuses on the distribution of the micrograph and magnetic properties at three different positions of the bulk MR foam. Furthermore, the concentration of CIPs is varied in order to increase the magnetic properties, and their effect on on this is emphasised in the discussion. This research aims to provide a new method of preparation and is an exciting opportunity to advance the knowledge of the magnetic properties of MR foam.
2. Methodology
2.1. Material and preparation
PU foam consisting of two parts, polyol and diisocyanates, produced by Smooth-On Inc. USA, and magnetic particle CIPs with a median diameter of 3.8–5.3 μm, supplied by CK Material, Korea were used in this study. One control sample without CIPs (referred to as PU foam), and three samples of MR foam with 35, 45 and 55 wt% of CIPs were fabricated. The PU foam was prepared by using the weight ratio 1:1; PU polyol to diisocyanates, while for the MR foam, the concentration of CIPs was measured from the total weight of polyol and diisocyanates. The CIPs were mixed into the polyols and stirred for 20 s with a constant speed of 550 rpm. Then diisocyanates was added to the mixture and it was stirred again for 20 s at the same speed. The final mixture was then poured into a cylindrical mould 29 mm in diameter and kept for a day at room temperature in order to produce bulk PU and MR foams. It was observed that all bulk foams were successfully prepared without sticking to the mould. The samples were then taken from the bulk foams at three different positions, top, middle and bottom.
2.2. Characterisations
In this work, a vibrating sample magnetometer Microsense FCM10, USA, was used for the magnetisation test. All samples were punched into circles with a 6 mm diameter having an average weight of 1.20 ± 0.10 g. Then, the samples were mounted in a transducer under varied magnetic fields of −15 to 15 kA m−1. Eight points were characterised for each position. The average value and standard deviation were evaluated by the instrument.
The porosity of the magnetic foam samples was studied using an ASTM D792. The dry sample density was calculated by the mass and volume. In this study, the samples were immersed in distilled toluene for a day. The wet mass of the immersed samples was weighed, and the porosity was calculated using the equation shown below. Vbulk represents the solid volume without pores and Vpore is the volume of pores in the MR foam. The average value and standard deviation were evaluated.

The morphology was ascertained using an optical microscope, Axio Lab A1, to observe the structure of the PU foam and MR foam. A circular sample with a radius of 29 mm was scanned at different points and positions under a lens magnification of 10× and it was illuminated with transmitted light using a halogen 35 W.
3. Results and discussion
3.1. Distribution of magnetic properties in the MR foam
Figure 2 depicts the consistency and hysteresis loop of MR foam with 35 wt% CIPs at different positions: top, middle and bottom. The hysteresis trend in all positions showed the superparamagnetic behaviour of the material, which also exhibited a small hysteresis loop area [11, 12]. The top inset in figure 2 shows the magnetic saturation, Ms , at different positions. It is observed that the Ms for all three positions of MR foam was around 50 Am2 kg−1. This can be attributed to the uniform dispersion of CIPs in the foam during the foaming process by referring to almost the same value of magnetic properties throughout the bulk MR foam [8]. However, the bottom inset of figure 2 shows an intercept of the x-axis and y-axis that represents the coercivity, Hc , and remanence, Mr , respectively. Both intercepts showed the uniform magnetic properties of the bulk MR foam at almost the same point. A similar pattern of hysteresis loop is also observed for all positions of MR foam with 45 and 55 wt% of CIPs.
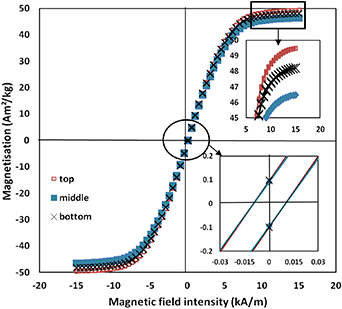
Figure 2. The change in hysteresis loop at different positions of MR foam with 35 wt% of CIPs. The top inset shows the saturation values while the bottom inset shows the intercept x-axis and y-axis.
Download figure:
Standard image High-resolution image3.2. Morphology and porosity of MR foam
The optical micrographs of PU foam and 55 wt% MR foam at three different positions: the top, middle and bottom are shown in figure 3. In figure 3(a), the PU foam shows thick white areas and pores, in which a small part of the dark area refers to deep pores. In the meantime, it is clearly observed that the cell structure of the PU foam is irregular, with mainly large cells. However, by adding 55 wt% of CIPs to the MR foam, there is no difference in the tone colour area detected as compared to the one reported previously by Volpe et al [7]. The smooth tone area observed in this study, as in figures 3(b)–(d), indicates that the CIPs are homogenously mixed with the PU matrix. This might be due to the increase in polymerisation rate with the increase of the viscosity of the mixture of polyol and CIPs, thus needing a longer time to stabilise the matrix for complete expansion of the foam, giving a homogeneous structure and avoiding the collapse in MR foam structure.
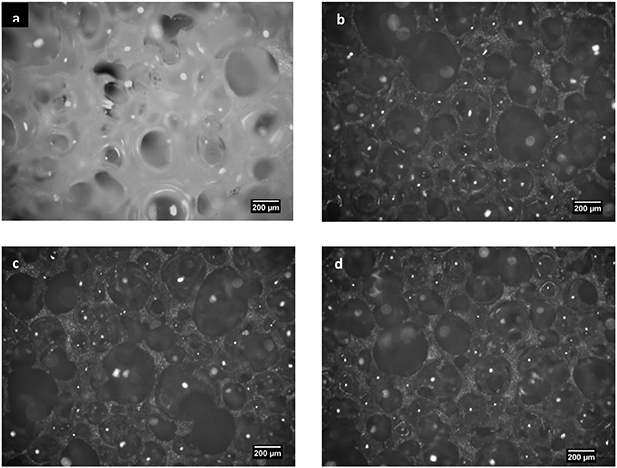
Figure 3. Optical Micrograph 10× for (a) PU foam, and 55 wt% MR foam at (b) the top, (c) middle and (d) bottom.
Download figure:
Standard image High-resolution imageIt is also observed that the number of pores increases in MR foam with 55 wt% as compared to the PU foam. The presence of CIPs in the MR foam with 55 wt% is believed to lead to an increase in the number of pores in the sample. It is also found that the presence of CIPs did decrease the activation energy needed for the bubble growth in the MR foam sample, thus increasing the amount of bubble nucleation in the MR foam and contributing to the formation of pores which resulted in an increase of the density of bubbles. When the density of bubbles increased, more contact occurred between them, so that they merged into a coalescent pore structure, as observed in figures 3(b)–(d). The different pore sizes observed in the MR foam with 55 wt% might be due to the different coalescence mechanism, which is almost similar to the one reported by Jawhar et al [13]. Figure 4(a) depicts the different coalescence mechanism and figure 4(b) shows the related coalescence in the MR foam with the 55 wt% sample.

Figure 4. (a). Different mechanisms of coalescence: (i) direct combine, (ii) 'emptying' phenomenon and (iii) deformed bubbles. (b) Different types of coalescence of 55 wt% MR foam at middle position.
Download figure:
Standard image High-resolution imageAs seen in figure 4(a(i)), the mechanism of coalescence that might occur during the deformation of the bubbles is direct combination. This kind of deformation occurs when two or more bubbles coalesce to form one big bubble. During this kind of deformation, the membrane between both bubbles is destroyed leading to a big bubble. Another mechanism that might occur during coalescence is the 'emptying' phenomenon, which is shown in figure 4(a(ii)), when two or more bubbles make contact and gas is transferred from one to the other. This phenomenon may end up producing different sizes of bubble, big and small, without destroying their own membrane. A further possible mechanism involves the deformation of the bubble membrane, which is quite similar to the 'emptying' phenomenon as depicted in figure 4(a(iii)). However, during this kind of mechanism, the membrane between both bubbles becomes stable and their membrane surface is shared together. All of the mechanisms mentioned above have been proved to occur in the deformation of bubbles observed in this study, as displayed in figures 4(b(i)–(iii)). In the meantime, it is assumed that coalescence occurs more easily in the MR foam compared to the growth in bubble size due to the presence of CIPs. The existence of CIPs in the MR foam might limit the space for bubbles to expand in the polymer matrix. Moreover, by referring to the morphology structure in figure 3, with the addition of CIPs to the MR foam, the development of a thin cell wall of bubbles is due to the increase of pores and coalescence. The edges of the cells in the MR foam also become sharper compared to the edges of the cells in the PU foam.
In order to confirm the increase of pores in the MR foams, a porosity study was done. Detailed results on the porosity are included in table 1 and also graphically plotted in figure 5 for a deeper understanding of the structure.

Figure 5. The porosity distribution for MR foam at the top, middle and bottom position at different concentrations with the reference PU foam.
Download figure:
Standard image High-resolution imageTable 1. A summary of the magnetic properties and porosity for all samples.
| Samples | Ms (Am2 kg–1) | Hc (A m–1) | Mr (Am2 kg–1) | Permeability × 10–2(Am2 kg–1) | Porosity (%) | ||
|---|---|---|---|---|---|---|---|
| CIPs | 195.000 | 9.993 | 0.708 | 7.500 | – | ||
| PU foam | 0.045 | 0.007 | 0.001 | 0.004 | 38.81 | ||
| MR foam 35 wt% | Top | 48.513 | 9.737 | 0.094 | 0.992 | 44.64 | |
| Middle | 46.166 | 9.734 | 0.093 | 0.948 | 44.83 | ||
| Bottom | 47.982 | 9.711 | 0.096 | 0.988 | 44.82 | ||
| Standard deviation | 1.684 | 0.045 | 0.003 | 0.042 | 0.35 | ||
| MR foam 45 wt% | Top | 61.712 | 9.835 | 0.124 | 1.192 | 46.37 | |
| Middle | 60.586 | 9.858 | 0.122 | 1.182 | 46.51 | ||
| Bottom | 61.739 | 9.836 | 0.120 | 1.102 | 45.99 | ||
| Standard deviation | 1.734 | 0.023 | 0.005 | 0.077 | 0.44 | ||
| MR foam 55 wt% | Top | 68.512 | 9.940 | 0.141 | 1.430 | 49.60 | |
| Middle | 70.367 | 9.938 | 0.145 | 1.463 | 49.78 | ||
| Bottom | 68.879 | 9.947 | 0.147 | 1.461 | 49.39 | ||
| Standard deviation | 1.990 | 0.029 | 0.009 | 0.041 | 0.21 | ||
As shown in table 1, the porosity behaviour of PU foam is 38.81% and increases with the addition of CIPs in the range of 6%–11%. Meanwhile, as shown in figure 5, the porosity of the MR foams increases with the addition of CIPs. The results obtained are in agreement with the morphology study shown in figures 3(b)–(d). The increment of CIPs led to (i) a growth in the number of pores, (ii) more coalescence and (iii) an increase in the number of voids between particles causing a rise in porosity. This finding agrees well with the previous study by Sprio et al [14] in which the porosity of magnetic composites increased with increased amounts of magnetite. Previously, in another study by Schuman et al [8], the authors also reported that the number of pores increases with the increase of CIPs resulting in the increased porosity of the foam.
3.3. Effects of CIP concentrations on the magnetic properties of MR foam
Figure 6 compares the hysteresis loops of the bottom position of CIPs, PU foam and MR foam with 35, 45 and 55 wt% of CIPs. The enlargement scale of the intercept at the x-axis and y-axis is also shown in the inserted figure. As shown in figure 6, the CIPs exhibit the highest magnetic saturation, Ms of 195 Am2 kg−1 as compared to the other samples. In the case of PU foam, it is clearly observed that this kind of material exhibits diamagnetic behaviour as there is no response towards the magnetic field given. However, for the MR foam samples with different concentrations of CIPs, 35, 45 and 55 wt%, the Ms increased parallel to the increase of CIPs. Besides this, all samples exhibit similar graph trends (narrow hysteresis loops), which is due to the soft magnetic behaviour [15].

Figure 6. Hysteresis loop for PU foam, CIPs and 35 wt%, 45 wt% and 55 wt% of MR foams.
Download figure:
Standard image High-resolution imageTable 1 summarises the value of magnetic properties related to Ms, Hc , and Mr for CIPs, PU foam and MR foams. The CIPs exhibit Ms at 195 Am2 kg−1, while the PU foam shows a low Ms of 0.045 Am2 kg–1, due to the diamagnetic property of the foam. The Ms of MR foam with 35 wt%, 45 wt% and 55 wt% of CIPs at three different positions shows a smaller standard deviation of 1.6849 Am2 kg−1, 1.734 Am2 kg−1 and 1.990 Am2 kg−1 respectively. These findings indicate that a uniform Ms in each bulk MR foam was achieved. A similar trend of small standard deviation was also observed for their Hc, Mr and permeability. Furthermore, the values show that the magnetic properties for each concentration were uniformly dispersed inside each bulk MR foam. A high Ms has the advantage of allowing the materials to react easily with the magnetic field, while a low Hc and Mr make these MR foams repeatedly able to react in a short time, meaning they are suitable for simple actuators and sensors.
As such, it is believed that there are significant correlations between magnetic properties with the concentration of magnetic particles in the MR foams. Besides this, the Ms, Hc, Mr and permeability behaviour of MR foams with different concentrations of CIPs are compared in figure 7.

Figure 7. A summary of magnetic properties for each MR foam sample at different positions.
Download figure:
Standard image High-resolution imageFigure 7(a) represents the correlation of Ms with the PU foam, MR foams and CIP powder. As can be seen from the figure, the Ms of MR foam with 35 wt% of CIPs decreased by almost three quarters from the Ms of CIPs. While for the MR foam with the addition of 45 wt% and 55 wt% of CIPs, the Ms increased up to 27% and 11% as compared to the MR foam with 35 wt% of CIPs. The difference in the Ms of MR foams compared to the PU foam could be due to a few mechanisms as mentioned below.
- (i)PU matrix; the existence of a nonmagnetic PU matrix in the MR foam acted like a shield that resisted the magnetic field reaching the CIPs inside the MR foam. The amount of magnetic field received by the MR foam was not collinear with the amount of magnetic field produced by the induced current as shown in figure 8. The thick layer of PU matrix leads to a big loss in the flow of magnetic energy as shown in figure 8(b) compared to the thin layer (figure 8(a)). This is the main factor that might limit the ability of MR foam to produce higher magnetic saturation, Ms .
- (ii)The concentration of CIPs; the value of Ms depends on the magnetic moment of the CIPs [16]. The higher the concentration of CIPs, the higher the amount of magnetic moment and consequently the higher the Ms that can be achieved, which corresponds to the observation of the MR foam in this study.
- (iii)The distance between CIPs; as discussed before, the foam in the MR foam expands during the foaming process, thus affecting the distance between the CIPs in the foam. The increase of CIP concentration in the MR foam resulted in a decrease in distance between the CIPs in the strut. This occurrence is believed to increase the interface connection and strengthen the magnetic force between the CIPs. The reduction of the loss of magnetic field hence resulted in the enhancement of the Ms .
- (iv)Porosity; the porosity can have a strong effect on the magnetic saturation of materials. Porosity, which mainly contributes through the pores and the void between particles or the void between particles and the PU matrix, is believed to occur in the MR foam sample. It is well known that the existence of pores in MR foam can hinder the movement of magnetic domains thus causing the material to lose its magnetic behaviour. However, in this case, unique behaviour in the Ms and porosity is found, in which the Ms increases in parallel even though the porosity is high. This rare phenomenon might be related to the increase in the flexibility structure of MR foam with an increase in porosity.
- (v)Elastic matrix and pore shape; the PU matrix consists of a hard segment and a soft segment that can accumulate with the phenomena in points (i) to (iv). As shown in figure 9(a), without a magnetic field the CIPs, PU matrix and pores are in an equilibrium state. When the CIPs in MR foam are stimulated by an external magnetic field, they experience torque in order to align the magnetic moment in parallel with the magnetic field direction. In the presence of a magnetic field, the CIPs in the MR foam will experience a magnetic force phenomenon. This magnetic force has an effect on the elasticity of the PU foam [17], thus leading to changes in the PU matrix and the pore shapes as shown in figure 9(b). The deformation reduces the magnetic loss and increases the contact between CIPs, simultaneously enhancing the magnetic field path. As the external magnetic field becomes greater, the force produced during movement of the CIPs also becomes greater in order for it to align with the magnetic field direction; the greater deformation of pores that thus occurs is illustrated in figure 9(c). The distance between CIPs becomes closer when a strong magnetic field is applied thus enhancing the conduction path of the magnetic field. As discussed in the morphology, the PU matrix layer becomes thinner with the increase of CIP content, hence greater deformation of the pore structure occurs. This anomaly causes an enhancement in CIP surface contact. The increase in CIP composition leads to an increase in the number of magnetic moments that reinforce the magnetic force. The greater force also contributes to larger deformation of the pores. The flexibility in the structure of MR foam reduces the distance between CIPs and contributes to the increase in Ms .
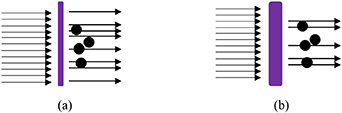
Figure 8. The mechanism blocking of the magnetic field: (a) a thin layer and (b) a thick layer of PU matrix. The arrows represent the magnetic field; the black dots are CIPs and the rectangle represents the thickness of the PU matrix.
Download figure:
Standard image High-resolution image
Figure 9. The mechanism of the elastic matrix (a) without a magnetic field; the original shape of the pores (long distance between CIPs), (b) with a weak magnetic field; the small deformation of pores (short distance between CIPs), and (c) a strong magnetic field; larger deformation of pores (shorter distance between CIPs).
Download figure:
Standard image High-resolution image
Meanwhile, figure 7(b) depicts the Hc of CIPs and MR foam with the increase of CIP concentration. The Hc or coercive force is the intensity of field necessary to fully demagnetise the magnetised materials [15]. The Hc for the CIP was 9.993 A m−1, while for the PU foam it was 0.007 A m−1. As for the MR foam with 35, 45 and 55 wt%, the Hc values were 9.7, 9.8 and 9.9 A m−1. All the MR foam samples exhibit small changes with the increase of CIP concentration with increases in the range of 0.1–0.2 A m−1 respectively. The small increase in Hc might be related to the influence of CIP concentration in the MR foam that might change the connection between the CIPs and PU matrix, thus resulting in the straightening of the magnetic field in the CIPs. The finding observed in this study corresponds with the one reported by Fang et al [16] in which the authors inferred that the polymer matrix has no significant influence on Hc . However, this result is the opposite for hard magnetic particles as reported by Martinez et al [17], as the Hc value can be changed by changing the matrix materials that have been embedded with hard magnetic particles. Generally, a small value of Hc is preferable in MR materials since this reveals the ability of materials to give a fast response when the magnetising force is given. The small difference in the Hc of CIPs showing no significant effect of the PU foam as a matrix in the MR foam and the decrease in value might be due to the presence of a pore structure that increases the surface area of CIPs with air for magnetic loss.
The Mr (remanence) or residual flux density show the remaining magnetisation inside the materials when an external magnetic field is removed. By referring to figure 7(c), all the Mr in the MR foam samples with an increase of CIP composition showed a drastic drop compared to the CIP powder with 61.3, 58.5 and 56.3% for 35, 45 and 55 wt%, respectively. The drop in remanence may be related to (i) the PU matrix: the amount of magnetic field received by the embedded CIPs is low, thus making magnetic loss easier. Other factors include (ii) the distance between the CIPs and (iii) the porosity of the MR foam. The factors mentioned above might weaken the magnetic flux density, thus making it easier for demagnetisation to occur. On the other hand, the small increment in Mr of MR foams with an increase of CIP composition is due to the increment in the magnetic moment, which strengthens the magnetic field alignment and prevents the magnetic field from dissipating.
A similar observation is also observed in the permeability of MR foam. Permeability is the measurement of the resistance of a material against the formation of a magnetic field. As seen in figure 7(d), the value of the permeability of CIPs is 0.075 Am2 kg−1, while in the case of MR foam, the permeability value is larger compared to the MR foam samples. The reason behind this could be due to the addition of CIPs to the PU matrix, which merely reduces foam expansion and thus causes a reduction of the permeability. Moreover, the increase in CIP concentration resulted in an increase of the magnetic moment and porosity. This occurrence led to a reduction of the distance between CIPs, hence the magnetic field aligned easily, and thus a higher value of permeability was obtained. In fact, these findings are consistent with Guerrero et al [18] but do not support the previous research by Igarashi and Okazaki [19], who identified that the permeability decreased with the increase in porosity of polycrystalline ferrite.
4. Conclusion
MR foams with different particle concentration were successfully prepared by an in situ fabrication method. The results from this study suggest that the diamagnetic properties of PU foam change to superparamagnetic properties with the presence of CIPs in the MR foam. Micrograph analysis depicted that the number of pores increased with the addition of CIP composition in the MR foam. Moreover, a unique mechanism of coalescence, which directly combines 'emptying' and deformed bubbles, was observed in this study. The results revealed that the addition of CIPs to the MR foam altered and enhanced the magnetic saturation up to 52%. Besides this, the coercivity of all MR foams increased in the range of 1%–2%. However, the remanence, permeability and porosity of all the MR foams remained unchanged with the increase of CIP composition. The findings observed in this study are interesting because the magnetic properties observed for all different positions in the MR foam are consistent with the very small standard deviation obtained. Owing to their synergistic behaviour, it is finally remarked that these kinds of material will be further investigated in the near future to develop more advanced multifunctional devices.
Acknowledgments
The authors acknowledge the financial support provided by Universiti Teknologi Malaysia, Collaborative Research Grant (CRG) (vot. no. 08G79). The authors also acknowledge Universitas Sebelas Maret for the financial aid through Hibah Program Hilirisasi Hasil Riset 2020 as well as the National Center for Sustainable Transportation Technology (NCSTT) for the partial funding through IIE00000078-ITB-1.
Declaration of competing interest
The authors declare that they have no known competing financial interest or personal relationships that could have appeared to influence the work reported in this paper