

Abstract
A new loading method with laterally-constrained configuration was proposed to study the energy conversion behavior of dielectric elastomer generator (DEG) based on experimental tests and theoretical calculation. The influence of lateral pre-stretch ratio and the loading rate on the energy transformation of DEG (VHB 4905) was investigated under both the quadrangular and triangular harvesting schemes, and the latter shows higher energy density and conversion efficiency than the former. The energy density increases with the lateral pre-stretch ratio at the range of 2 to 4, with the maximum value of 76 mJ g−1 for the quadrangular cycle and 186 mJ g−1 for the triangular cycle at the loading rate of 90 mm s−1 (strain rate of 2 s−1), respectively. The advantage of larger lateral pre-stretch ratio is mainly attributed to the increased capacitance density of the elastomer membrane at the maximum stretch, which enlarges the operational area confined by multiple failure limits on the voltage-charge work-conjugate plane. As the loading rate decreases, the energy density within each cycle decreases monotonically due to the increased charges leakage. Since the mechanical energy loss within a single cycle decreases at the lower loading rate, the conversion efficiency for the triangular cycle shows slight increase at the lower loading rate, with the maximum value of 15.4% for stretching rate of 50 mm s−1 (strain rate of 1.11 s−1).
Export citation and abstract BibTeX RIS
1. Introduction
With the ever-growing demand for electrical energy in modern society, it is of great importance to develop new approaches to harvest electricity from clean and renewable sources. Dielectric elastomer (DE), as one kind of electroactive polymers (EAPs), shows great capability in electrical-mechanical energy transduction [1]. When subjected to the electric stimulus, it is able to change its dimensions under the electrostatic forces, which makes it potentially applied as the soft actuators [2, 3]. On the other hand, mechanical energy can also be converted into electrical energy when the DE is operated in the reverse manner, which has been widely studied by researchers in recent years [1, 4].
The basic operational element of dielectric elastomer generator (DEG) comprises a flexible polymer membrane sandwiched between compliant electrodes on both sides [5]. When the DE film is stretched under external loading, the capacitance of the DEG increases as the film expands in area and contracts in thickness. Then, charges are delivered and stored on the surfaces of the stretched film when connected with the power supply. After removal of the external loading, the membrane shrinks in area and increases in thickness due to the elastic restoring force of dielectric elastomer. Since like charges on each electrode are forced together and unlike charges on the opposite electrodes are pulled apart, the electrical energy on the membrane will be boosted to a higher level. Finally, charges are harvested from the DEG and the membrane restores its initial state. Due to its ability to directly convert the mechanical energy into electrical power, the dielectric elastomer can be potentially applied in the power take-off system to harvest energy from the clean and renewable sources, such as ocean waves [6, 7]. Recently, multiple architectures of power take-off system with DEGs were developed for wave energy converters, such as the standing wave tubes [8] and oscillating water column [9–13], which exhibit great average performance in both the laboratory water tank tests [10] and the field experiments in the real-sea environment [9, 13].
Pelrine et al [14] first demonstrated that the energy density of acrylic DE was up to 0.4 J g−1, which is more than one order of magnitude higher than that of the electromagnetics and piezoelectric ceramics due to its low density and high energy conversion efficiency [1]. Thereafter, multiple DEG configurations combined with various energy harvesting schemes were developed by researchers aiming at improving the energy conversion performance of DEG [1, 15–17]. Kaltseis et al [18, 19] developed a balloon-shape DEG with VHB 4910F dielectric elastomer, and the energy density and the energy conversion efficiency were 102 mJ g−1 and 7.5%, respectively. Huang et al [20] reported a significant improvement of DEG with VHB 4905 acrylic elastomer under equi-biaxial stretching configuration and 'quadrangular' (constant-voltage) harvesting schemes, with an energy density of 560 mJ g−1 and an efficiency of 27%. Recently, Shian et al [21] optimized the electrical energy conversion cycle of DEG with a 'triangular' harvesting scheme, which dramatically boosted the energy density up to 780 mJ g−1 and the conversion efficiency up to 30%.
Even though high energy density of VHB acrylic material was reported, its practical application still faces many challenges due to its high viscoelasticity, high electrical conductivity under electrical field, and remarkable temperature and moisture sensitivity [22–25], which limit its long-term reliability under hostile service environment. Therefore, the natural rubber and silicone elastomers that are more reliable and less viscoelastic have been specifically investigated as candidates for DEGs. The natural rubber was found to outperform acrylic elastomer at strain less than 15% [26], and comparable to VHB material at higher strains, with the energy density of 369 mJ g−1 [19]. The silicone elastomer shows little tendency for Mullins and ageing effect, and can be operated at broader temperature range [27]. It has been reported that the energy density of PDMS silicone elastomer is up to 173 mJ g−1 and the conversion efficiency is as high as 30% [28].
DEG is one kind of soft mechano-capacitive device per se, and the achievable electrical energy is directly related to the capacitance change of DE during an electromechanical cycle, which strongly depends on the loading configurations [1, 29]. For example, a great many of studies focused on the inflatable circular diaphragm DEGs, a device able to harvest the mechanical work done by an oscillating pressure that inflates and deflates a circular membrane. This kind of structure shows great potentials for practical application, with outstanding performance in the laboratory tests and wave-tank basins using acrylic elastomer [10, 11, 18], natural rubber [19] as well as PDMS silicone elastomer [28]. There are three basic loading configurations: uniaxial stretch, pure-shear stretch and equi-biaxial stretch, and the corresponding capacitance varies with the first, second and forth power of stretch, respectively [30]. Up to now, a great variety of energy harvesting studies were focused on the uniaxial stretch [5, 31] and equi-biaxial stretch configurations [20, 21, 26, 32], while the research of DEG under the pure-shear stretch is few and far between. In this work, a modified pure-shear stretching DEG with the laterally-constrained configuration is systematically investigated based on the theoretical analysis and experimental tests. Both the 'quadrangular' (constant-voltage) and 'triangular' energy harvesting schemes are adopted, and the influences of the lateral pre-stretch ratio and the loading rate on the electrical energy density and the conversion efficiency are discussed.
2. Methods
The acrylic elastomer (VHB 4905, 3M) with a thickness of H = 0.5 mm was utilized for the energy conversion tests. Square DE sheet with a dimension of L1 = 50 mm and L2 = 50 mm was prepared. In order to avoid the pre-mature rupture at the gripped locations, the edges of the sample were overlaid with DE strips with a width of 5 mm on both sides. For compliant electrodes, both sides of the sample were coated with carbon conductive grease (MG Chemicals Co., Ltd), as shown in figure 1(a). Therefore, the active area of the elastomer was  mm2, with a mass of 0.76 g.
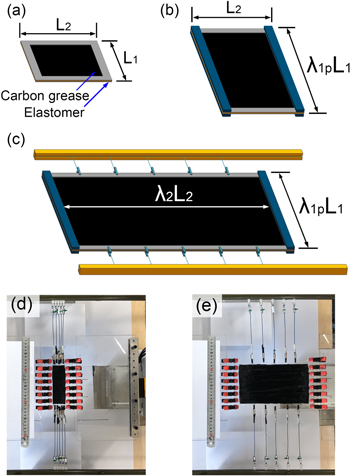
Figure 1. Schematics of DEG with laterally-constrained stretching configuration. (a) Square DE membrane is coated with carbon grease on both sides, and L1 and L2 indicate the initial length of the sample along lateral and longitudinal directions, respectively. (b) The sample is laterally constrained with a pre-stretch ratio of λ1p. (c) Sample is cyclically loaded along the longitudinal direction with a stretch ratio of λ2, and the side edges of sample are clamped with clips that freely slide along two parallel tracks. (d), (e) are the pictures of experimental set-up that show the two configurations of minimal and maximal longitudinal deformation, with the lateral pre-stretch ratio of 3 and the maximal longitudinal stretch ratio of 5.
Download figure:
Standard image High-resolution imageThe specimen was laterally pre-stretched by λ1p, which is defined as ratio of the deformed length to the initial length, and then the specimen was cyclically stretched along the longitudinal direction with a maximum stretch ratio of λ2max, as shown in figures 1(b)–(e). In order to avoid the lateral shrinkage of the membrane during the longitudinal stretch, the edges of the sample were clamped with five clips on each side, and the end of the clip was able to freely slide along two parallel tracks. From figures 1(d), (e), it can be seen that the lateral shrinkage is effectively restrained at the maximum longitudinal stretch with this method. In the literature [33], the wooden sticks were embedded in the dielectric elastomer actuator with the aim of reducing lateral shrinkage and maximizing actuation along radial direction. It is noted that the presence of the sticks leads to the stress concentration and uneven strain distribution at the contact region of sticks and elastomer. This may not have significant impact on the actuator application, because the strain variation is normally less than 100%. However, in this work, the elastomer membrane is subject to a cyclic strain variation of 400%, and the stress concentration and the uneven strain distribution are very likely to cause pre-mature rupture or electrical breakdown at the contact area of the sticks and elastomer. By using clips in this work, the contact region is migrated from the surface to the edges of the membrane, and the strain distribution on the membrane surface is relatively uniform during the stretching, which is able to avoid pre-mature failure of the elastomer. Secondly, for the larger specimens, longer sticks are needed for the shrinkage-constraining, which increases the contact area between the sticks and the membrane. But for the method with clips, the contact area between clips and elastomer keeps almost constant.
As mechanical rupture is prone to occurring at the stress concentration locations clamped by the clips along the membrane edges, the maximum stretch ratio along the longitudinal direction, λ2max, was chosen to be 5 for all the tests in this work, which was much smaller than the stretching limit of VHB 4905 elastomer [24, 34]. In order to investigate the influence of the lateral pre-stretch ratio (λ1p) on the energy conversion performance, the value of λ1p was chosen to be 2, 2.5, 3 and 4.
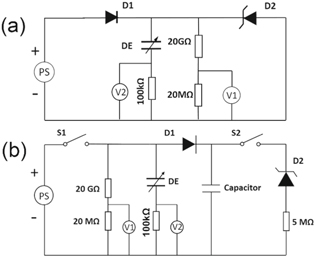
In this work, both the 'quadrangular' and 'triangular' energy harvesting schemes were adopted, the operational details of which were fully described in [20, 21], respectively. The electrical circuits for quadrangular and triangular cycles are shown in figures 2(a) and (b), respectively. In figure 2(a), D1 represents five diodes (UF4007) connected in series, and the reverse bias voltage of each diode is 1 kV. D1 guarantees that current can only flow from the power supply to the DEG within one electromechanical cycle. The harvesting voltage, ΦH, is determined by the total reverse bias voltage of Zener diodes assembly (D2), which varies with the number of the Zener diodes (1N5388B, 200 V for each one) in connection. During the stretching process of DE membrane, charges are drawn from the power supply to the surface of the membrane at a constant voltage of power supply, ΦIN. After external force is removed, the DE voltage gradually increases as the film relaxes to a state of lower stretch. As soon as the DE voltage is up to the reverse bias voltage of D2, charges on the DE surface are harvested through D2 at a constant voltage, ΦH ( ). The DE voltage, charging current and harvesting current are measured with voltmeters V1 and V2, respectively.
Download figure:
Standard image High-resolution imageIn figures 2(b), S1 and S2 represent two relays (DAT72415, Cynergy3 Components Ltd) that control the charging and harvesting circuits within one electromechanical cycle. The total reverse bias voltage of D2 is set to be the same as the input voltage of power supply, ΦIN. At the beginning, DE membrane is stretched under the open circuit with S1 and S2 in off state. S1 is closed as soon as the DE membrane is stretched to the maximum ratio, and then charges are drawn from the power supply to the membrane with a constant current about 50 μA. As soon as the DE voltage is up to the input voltage ΦIN, S1 is switched off and external stretching force is gradually removed. DE voltage increases as the membrane contracts under the elastic restoring force, and charges flow from the DE to the capacitor. At the end of the unloading phase S2 is closed, and charges stored in the DE and the capacitor are harvested through D2 until the DE voltage drops back to be ΦIN. The capacitance of the capacitor assembly was selected to be 23.5 nF, 32.0 nF, 43.4 nF and 73.5 nF for the lateral pre-stretch ratio of 2, 2.5, 3 and 4, respectively, aiming at increasing the energy density and avoiding electrical breakdown of DE due to over high voltage increase.
The membrane was stretched along the longitudinal direction using a linear servomotor (GLM20AP, THK Co., Ltd) that was controlled by the LabVIEW software. Since VHB elastomer shows significant time-dependent elastic response due to the viscoelasticity of the acrylic material, the influence of deformation rate should be considered. Therefore, three different loading and unloading rates were adopted with 90 mm s−1, 50 mm s−1 and 30 mm s−1, which correspond to the strain rate of 2 s−1, 1.11 s−1 and 0.67 s−1, respectively. The stretching force was measured with a load cell (U3B1-20K-B, Minebea Co., Ltd), and the current and voltage data were acquired through a multichannel voltmeter (NI-9223, National Instruments) with the sampling frequency of 5 kHz controlled by the LabVIEW program. The input voltage was provided by a high voltage power supply (Model HAR-30P1, Matsusada Precision Inc.).
3. Results
The displacement of servomotor, stretching force, DE voltage, charging and harvesting currents as a function of time at λ1p = 4 under the loading rate of 90 mm s−1 and 30 mm s−1 are representatively shown in figures 3(a)–(d), respectively. Figures 3(a) and (c) are the data for quadrangular cycle, and figures 3(b) and (d) are the data for triangular cycle. Note that, the positive and negative values of the current denote the charging and harvesting process, respectively. It can be seen that the maximum stretching force decreases as the loading cycle increases, and achieves a stable state gradually. In order to characterize the stabilized response of the DEG, hereafter the tenth harvesting cycle is used for the analysis for all the tests. The tenth electromechanical cycle of the DEG with pre-stretch ratio of 4 under loading rates of 90 mm s−1 and 30 mm s−1 are calculated and represented on the force-displacement plane and voltage-charge plane in figures 4(a)–(d), respectively.
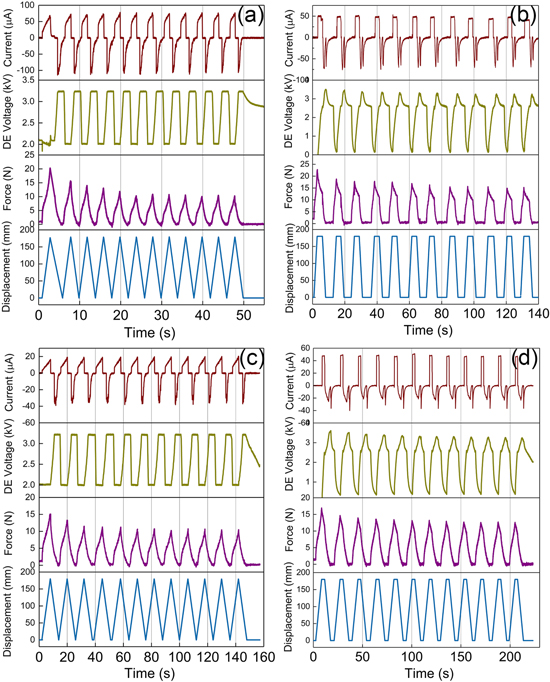
Figure 3. At lateral pre-stretch ratio of 4, the servo motor displacement, stretching force, DE voltage, current are plotted as a function of time. The loading rate of (a), (b) are 90 mm s−1, and the loading rate of (c), (d) are 30 mm s−1. (a) and (c) are the data for quadrangular cycle, and (b) and (d) are the data for triangular cycle.
Download figure:
Standard image High-resolution image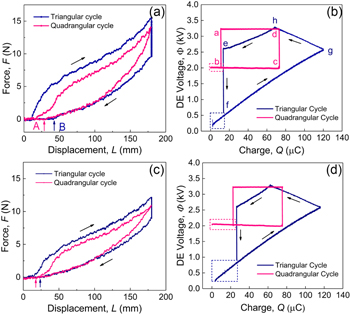
Figure 4. The electromechanical results of the quadrangular and triangular cycles shown on the force-displacement and voltage-charge plane with λ1p = 4 at the loading rate of 90 mm s−1 for (a), (b), and 30 mm s−1 for (c), (d). Arrows surrounding the plots indicate the operational direction within one electromechanical cycle. Points A and B marked by the vertical arrows are the locations of zero stretching force. The dashed box indicates the charges leakage within one cycle.
Download figure:
Standard image High-resolution imageFigure 4(a) shows the relationship between applied force (F) and the servo motor displacement (L) under loading rate of 90 mm s−1. The slight serrations of the curve result from the slip of the clips along the sliding tracks, which has tiny influence on the subsequent analysis. Significant mechanical energy loss can be observed based on the obvious hysteresis loop of the plot, which includes both the work dissipated by viscosity of acrylic material and the portion converted into the electrical energy. The total mechanical energy loss can be calculated as 
In figure 4(a), during the loading phase, it can be seen that the stretching force of triangular cycle is higher than the quadrangular cycle. It is because that the membrane is stretched under open circuit for the triangular cycle, thus the electrically-induced Maxwell stress is much smaller compared with the quadrangular cycle, which results in higher stretching force for the former. The electrical charging of triangular cycle occurred at the maximum extension (L = 180 mm), causing elastomer material to relax and decrease the stretching force, as shown in figure 4(a). During unloading phase, the applied force decreases to be zero at a displacement of 27 mm (point A) and 43 mm (point B) for the quadrangular and triangular cycles, respectively, which indicates that the membrane is in a state of loss of tension. The mechanical energy losses within one cycle are calculated to be 504 mJ and 961 mJ for the quadrangular and triangular cycle, respectively.
Figure 4(b) shows the variation of DE voltage as a function of the charge stored on the membrane. For the quadrangular cycle, the DE film is at a high voltage of 3.2 kV at the end of the previous cycle (point a). As the membrane is stretched, the capacitance of DE membrane increases, and the DE voltage decreases because charges are kept constant (stage a–b). When the DE voltage decreases to be equal to the power supply (2 kV), charges are delivered to the DE membrane at a constant voltage until the membrane is stretched to the maximum ratio (stage b–c). During the unloading phase, the capacitance of DE membrane decreases, and the DE voltage increases with constant charges (stage c–d). Charges on the membrane will be harvested as soon as DE voltage is up to the harvesting voltage of 3.2 kV (stage d–a). It is noted that, due to the leakage current, the charges drawn from the power supply is not completely harvested during the unloading phase, as marked by the dashed box in the figure 4(b). The net electrical energy in one electromechanical cycle can be calculated as  where ΦH, ΔQH, ΦIN and ΔQIN are the harvesting voltage, harvesting charges, input voltage and input charges, respectively. The net electrical energy within one cycle is calculated to be about 58 mJ.
For the triangular cycle in figure 4(b), the DE membrane is stretched under open circuit with S1 and S2 in off state (figure 2(b)), and the DE voltage decreases with constant charges during stage e–f. At the maximum stretch, S1 is closed, and the DE membrane is charged up to be about 2.6 kV (stage f–g). Then, S1 is switched off and external stretching force is removed. As the DE film contracts, the voltage is boosted to be 3.27 kV during stage g–h. Due to loss of tension during the unloading phase, the DE film retains a certain of residual stretch when the servo motor moves back to the initial location, and a large proportion of charges remains on the membrane (point h), which is finally harvested after switch S2 is closed (stage h–e). The dashed box in figure 4(b) indicates the charges leakage within one cycle, which is about 13 μC. The net electrical energy within one cycle is calculated as  which is calculated to be about 142 mJ in figure 4(b).
Note that the charges in figure 4 (b) are calculated by integrating the current measurement via V2 in the figure 2(b). In fact, the charges can be alternatively calculated by monitoring the voltage change of the capacitor in parallel connection with the DE, by ΔQ = ΔΦ · C [19, 28, 35]. In order to compare the difference between these two methods, we can utilize stage g-h in the figure 4(b). During this process, the current (i) is recorded through V2 in figure 2(b), and the voltage (Φ) of the capacitor is monitored through V1 at the same time because the voltage of DE and the capacitor is the same in this process. Then the charges variation can be calculated by two methods, i.e., integrating the current measurement  as well as through the capacitor, ΔΦ · C. The charges change within stage g-h is about 52 μC via the former method, as shown in figure 4(b). For the latter method, the capacitance of the capacitor assembly we used is 73.5 nF, as described in the experimental methods. It is achieved with two capacitors of 47 nF (940C30S47K-F, CDE) connected in-series, and then connected in-parallel with two capacitors of 100 nF (940C30P1K-F, CDE) that connected in-series. The breakdown voltage of each capacitor is 3 kV, and 6 kV for the capacitor assembly. In stage g–h, the voltage increase of the capacitor assembly, ΔΦ, is measured to be about 0.67 kV, and then the charges variation is calculated to be 49.2 μC. The difference between these two methods is about 5.7%, which indicates that the charges measurement method by integrating the current is acceptable.
For the loading rate of 30 mm s−1 in the figures 4(c), (d), the force-displacement plot and the voltage-charge plot show similar features as 90 mm s−1 in figures 4(a), (b). The mechanical energy losses for the quadrangular cycle and triangular cycle are calculated to be 305 mJ and 618 mJ, which are 39% and 36% lower than that of 90 mm s−1, respectively. As loading rate decreases, the charges leakage within each cycle increases to be 23 μC and 27 μC for the quadrangular and triangular cycle, as indicated by the dashed box in the figure 4(d), and the net electrical energy within each harvesting cycle decreases to be 19 mJ and 95 mJ, respectively.
The energy density and energy conversion efficiency of the DEG are calculated as  and
and  respectively [36]. Figure 5 shows the variation of energy density and energy conversion efficiency of DEG with respect to the lateral pre-stretch ratio, λ1p. Note that all the data presented in the figure are calculated based on the tenth harvesting cycle of each test. Experimental results show that as λ1p increases from 2 to 4, both the energy density and energy conversion efficiency increase for the quadrangular and triangular cycles. At the loading rate of 90 mm s−1, the values of ΔEdensity and η increase by 97% and 80% for the quadrangular cycle, and by 117% and 71% for the triangular cycle, respectively. Additionally, it can be seen that the triangular cycle exhibits considerable advantages compared with the quadrangular cycle, especially at large pre-stretch ratio, with the maximum value of ΔEdensity = 186 mJ g−1 for triangular cycle and ΔEdensity = 77 mJ g−1 for the quadrangular cycle at λ1p = 4 and loading rate of 90 mm s−1.
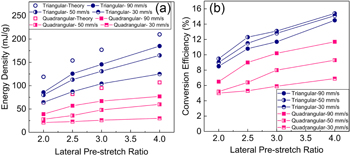
Figure 5. The theoretical and experimental results of (a) energy density and (b) energy conversion efficiency as a function of lateral pre-stretch ratio from 2 to 4 under quadrangular and triangular cycles with the loading rates of 90 mm s−1, 50 mm s−1 and 30 mm s−1.
Download figure:
Standard image High-resolution imageAs the loading rates decrease from 90 mm s−1 to 30 mm s−1, the energy density decreases monotonically for both quadrangular and triangular cycles, as shown in figure 5(a). This kind of energy density decrease is mainly caused by the relatively high conductivity of VHB 4905 [24], which leads to severe charges leakage at lower loading rate, as shown in figures 4(b) and (d). However, the energy conversion efficiency of the triangular cycle increases slightly as the loading rates decreases, as shown in figure 5(b). It is because that the lower loading rate results in smaller mechanical energy loss within each cycle. For instance, in figure 4, the mechanical energy loss decreases from 961 mJ to 618 mJ as the loading rate decreases from 90 mm s−1 to 30 mm s−1 for the triangular cycle, which leads to the slight increase of conversion efficiency.
4. Discussion
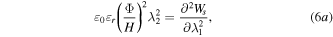
The maximum energy conversion of DEG is limited by multiple failure mechanisms, i.e., rupture, electrical breakdown (EB), loss of tension (LT) and electromechanical instability (EMI), which have been well studied for the equi-biaxial stretching configuration [32, 37]. Here, the energy conversion behavior of DEG under the laterally-constrained scenario is analyzed based on an ideal dielectric elastomer model, which assumes that the material has pure elastic response and is incompressible [37, 38]. According to the work of Koh et al [39], the nominal stress-stretch relations for an elastomer membrane subjected to a combination of external force P and voltage Φ are given as:
where ε0 is the free-space permittivity (8.85 × 10⁻¹² F m−1), εr is the relative dielectric constant (4.03 for VHB 4905 [20]), Φ is the voltage applied on the DE film, H is the initial thickness of the DE film; P1, λ1, P2 and λ2 are external force and stretch ratio along the lateral and longitudinal direction, respectively, and Ws is the Helmholtz free energy associated with the stretching of the membrane. The left terms of equations (1a), (1b) are the nominal stresses caused by the stretching force and electrical field, and the right term represents the elastic response of the elastomer.
For the VHB 4905 elastomer, the stress-stretch curve shows significant strain stiffening on approaching the stretching limit [34, 40]. Compared with the simple neo-Hookean model, Gent model is more appropriate to describe mechanical response of VHB 4905 [38, 41], which takes the form [42]:
where μ is the small strain shear modulus and Jm is a dimensionless material constant associated with the stretching limit. In this work, μ and Jm are set to be 16.92 kPa and 138.8 [24], respectively, which are representative stabilized mechanical parameters for the VHB elastomer.
The relationship between the charge Q stored on the DEG and the voltage Φ are expressed as follows:

For a given lateral pre-stretch ratio λ1 = λ1p, the maximum stretch ratio along the longitudinal direction before rupture, λ2rupture, can be calculated with the following equation:

Combining equation (3) with equation (4), the limit line for rupture can be numerically determined.
As voltage increases, excessively high electric field may lead to electrical breakdown of the DE film, which is given as:

where EEB is the electrical breakdown field, which is related to the deformed thickness (h) of the membrane and can be empirically calculated as  [43], where E0 is a constant. Even though Huang et al [43] did not mention the unit of the constant E0, it should be (MV · m−1 · mm0.57), because the units of the EEB and h in their work are (MV · m−1) and (mm), respectively. With the breakdown strength of 30.6 MV · m−1 for the undeformed 4905 film (h = 0.5 mm) [26], E0 is calculated to be 20.7 MV · m−1 · mm0.57. Based on equations (3) and (5), the EB boundary is derived.
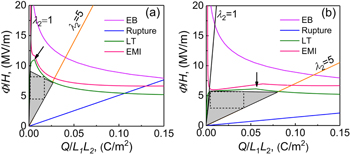
As the voltage increases, external force (P1 and P2) decreases due to the Maxwell stress, and eventually the DE membrane will be in a state of loss of tension. Since power generation results from the longitudinal stretching and elastic recovery of the DE membrane (figure 1(c)), LT failure along the longitudinal direction (P2 = 0) is analyzed here. Note that, when the Maxwell stress is small and the laterally-constrained force P1 is not fully relaxed, this condition can be numerically calculated with equations (1)–(3) by setting λ1 = λ1p [39]. On the other hand, when the laterally-constrained force P1 is fully relaxed and the deformation is totally supported by the electrical field, the LT limit line can be derived by setting P1 = 0 for equations (1)–(3) [39]. The transition points for the two cases are marked by the arrows in the figure 6.
Figure 6. The failure limits of DEG under laterally-constrained stretching configuration on the voltage-charge plane with (a) λ1p = 2 and (b) λ1p = 4. The theoretical quadrangular and triangular harvesting cycles are represented by the rectangle (dashed line) and triangle (solid line), respectively.
Download figure:
Standard image High-resolution image
The EMI failure is caused by the positive feedback between a thinning film and an increasing electric field, which causes the elastomer to thin down dramatically and results in pre-mature failure. This condition is described as dΦ/dλ = 0 [26], and then the following equations can be derived from equation (1):
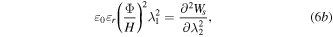
and the corresponding boundary line is numerically solved with the equations (3) and (6).
Based on the discussion above, for the cases of λ1p = 2 and λ1p = 4, the failure boundaries of rupture, EB, LT and EMI are calculated and illustrated on the work-conjugate plane, as shown in figure 6, and the theoretical electrical energy can be calculated based on the area enclosed by the limit lines. In order to pinpoint the maximum quadrangular cycle, rectangles with different input voltages are plotted within the allowable regions, and the optimum quadrangular cycle is determined when the area of the rectangle reaches the maximum value. The quadrangular and triangular cycles are schematically shown within the allowable regions on voltage-charge plane in figure 6. The corresponding theoretical energy density is calculated to be about 64 mJ g−1 and 119 mJ g−1 for λ1p = 2, and 107 mJ g−1 and 210 mJ g−1 for λ1p = 4, respectively. For λ1p of 2, 2.5, 3 and 4, the theoretical maximum energy densities of quadrangular and triangular cycles are presented in figure 5(a). It can be seen that the theoretical calculations match the experimental results well for the loading rate of 90 mm s−1. For instance, for the DEG with pre-stretch ratio of 4, the theoretical energy density is about 14% higher than the experimental result.
In figure 5(a), both the theoretical calculation and experimental results show that the energy density increases with the lateral pre-stretch ratio (λ1p) for the quadrangular and triangular harvesting cycles. Based on the theoretical calculation in figure 6, the LT boundary moves downward when λ1p increases from 2 to 4, which decreases the performance limit of DEG on the work conjugate plane. On the other hand, for a larger λ1p, larger capacitance (C) can be obtained when the membrane is longitudinally stretched to a given displacement, which decreases the slope of λ2 line (∝ 1/C) and enlarges the operational area enclosed by the boundaries, as shown in figure 6. The larger capacitance also suggests that more charges can be drawn from the power supply to the DE membrane at the maximum stretch, which elevates the net electrical energy harvested within one electromechanical cycle.
Even though the experimental parameters are carefully designed in order to avoid the possible failures depicted in figure 6, loss of tension still happens during the unloading phase for the quadrangular and triangular cycles, as shown in figure 4(a). It is because that the theoretical analysis in figure 6 neglects the time dependence of the mechanical response of the material. The polymer molecules change from a coiled to an extended configuration under the application of external stress, and retract to the initial form after removal of the stress. However, due to the constraints from surrounding molecular chains, this kind of configuration transformation cannot be accomplished instantaneously. Therefore, the elastomer displays a wide range of mechanical properties between an elastic solid and a viscous liquid depending on the temperature and the experimental timescale [44]. During the unloading phase in this work, the timescale is not long enough for the extended molecules of acrylic elastomer to restore the initial coiled state completely, and a large fraction of the mechanical energy is irreversibly stored within the polymer molecules, rather than transformed into the electrical energy, which results in the gap between the experimental results and theoretical calculations in figure 5(a). Despite the simplicity of the model adopted in this work, the theoretical calculation well characterizes the influence of lateral pre-stretch ratio on the energy conversion performance of DEG, especially for the loading rate of 90 mm s−1 with few charges leakage.
However, it should be noted that, as loading rate decreases, the experimental energy density decreases dramatically for both the quadrangular and triangular cycles, which enlarges the discrepancy between theoretical and experimental results in figure 5(a). This is mainly due to the increased charge leakage within one cycle at the lower loading rate. The conductivity of the dielectric elastomer increases with the applied electric field with an exponential law in the form: [24]

where κ0 and EC are material constants, and E is the applied electrical field. Then the leakage current of the DE film can be expressed as [45]:

It can be seen that the leakage current increases with the electrical filed, E, as well as the stretch deformation, λ1 and λ2. It is noted that the aim of this work is to evaluate the energy conversion limits of the DEG under different lateral pre-stretch ratios, therefore, the applied voltage and stretching deformation are selected to be rather high in order to maximize the energy density in one cycle. Thus, the leakage current can not be neglected in this work, and the charges leakage is especially severe at the lower loading rate, because longer time is costed within one harvesting cycle. Of course, in the practical application, the long-term reliability must be considered, and the DEG should be operated under a medium voltage and proper stretches, which should be tackled in future studies. It is worth noting that the value of κ0 for VHB 4905 is nearly one order of magnitude larger than the competing dielectric materials, such as the styrenic rubber (THERABAND YELLOW 11726) and natural rubber (OPPO BAND GREEN 8003) [24], which implies that the latter two elastomers should be preferred over VHB 4905 for low-frequency energy scavenging applications, such as the power take-off system utilizing ocean waves, with typical frequency in the range of 0.05 Hz to 0.2 Hz [24].
One effective method to further improve the energy conversion performance of triangular cycle is to develop new dielectric elastomer materials with low viscosity, which is able to decrease the force drop at the maximum stretch caused by the stress relaxation during charging process (figure 4(a)). Low viscosity also implies that the premature LT point on the unloading curve will move to the left in figure 4(a). Accordingly, the area of the mechanical hysteresis loop (i.e., ΔEmech) can be reduced remarkably. As premature LT failure is avoided, the DE membrane is able to contract to a lower stretch state and drives the maximum voltage (point h in figure 4(b)) to a higher level, which increases the area enclosed by Φ-Q plot, i.e., ΔENET. With a decrease of ΔEmech and an increase of ΔENET, the energy conversion efficiency η can be improved dramatically. The silicone elastomer [22, 23, 28, 46], natural and styrene rubber [19, 24, 47] exhibit better performance over VHB material with lower viscoelasticity and higher reliability at large strain amplitude, which should be promising options for practical application.
5. Conclusion
In summary, the modified pure-shear stretching DEG (VHB 4905) with laterally-constrained configuration is investigated based on the theoretical analysis and experimental tests under the quadrangular and triangular cycles, and the influences of lateral pre-stretch ratio and loading rate on the energy density and conversion efficiency are analyzed.
The triangular harvesting cycle shows higher energy density and conversion efficiency than the quadrangular cycle. As the lateral pre-stretch ratio increased from 2 to 4, the energy density for the quadrangular and triangular cycles increases by 97% and 117%, with the maximum values of 76 mJ g−1 and 186 mJ g−1 at loading rate of 90 mm s−1, respectively, which is in accordance with the theoretical expectation that larger operational area is available on the voltage-charge work conjugate plane for the higher pre-stretch ratio. As the loading rate decreases from 90 mm s−1 to 30 mm s−1, the energy density for the quadrangular and triangular cycles decreases monotonically, which is mainly due to the severe charges leakage under the lower loading rate. However, since lower loading rate results in smaller mechanical energy loss within each cycle, the energy conversion efficiency of the triangular cycle elevates slightly for the lower loading rates, with the maximum value of 15.4% at the loading rate of 50 mm s−1.
Acknowledgments
This work was supported by the Strategic Research Foundation Grant-Aided Project for Private University from Ministry of Education, Culture, Sports, Science and Technology, Japan.