

Abstract
In recent years, atmospheric-pressure nonequilibrium plasma processing using microdroplets has attracted significant attention. To improve the controllability of this process, an understanding of the evaporation behavior of droplets in plasma is highly desirable. In this study, we examine the evaporation behavior of well-controlled inkjet droplets in atmospheric-pressure nonequilibrium argon plasma through both experiments and modeling. A comparison of the droplet evaporation model based on energy balance considering gas temperature, electron and ion collisions, and recombination reactions with experimental evaporation behavior suggests that droplet evaporation is enhanced in high-density plasma environments with electron and ion densities exceeding 1019 m−3 when compared with that in non-ionized gaseous environments at a gas temperature below 1000 K.
Export citation and abstract BibTeX RIS
1. Introduction
Recently, with the development of atmospheric-pressure nonequilibrium (low-temperature) plasma technologies, plasma processing with a liquid phase has gathered significant attention [1, 2]. Plasmas in contact with liquids can generate reactive species in the gas phase and transfer them to the liquid phase to enhance the reactivity of the liquid phase. Plasma processing with liquid phases has been developed for applications in a wide range of fields, such as materials synthesis, medicine, agriculture, and environmental treatment [1]. Plasma processing using liquid droplets with diameters of several to several tens of microns has also been extensively investigated [3–14]. Micro-sized droplets yield a high surface-to-volume ratio, which is likely to enhance reactions through radicals, charged particles, and photons from the surrounding plasma environment [5, 11]. Furthermore, it is expected that the inside of a droplet can be considered a semi-closed microreactor with a known quantity of materials, resulting in the processing of the materials with high controllability of size and composition [5]. In plasma processing using microdroplets, the reaction progresses as the solvent in the droplets evaporates. Therefore, understanding the phenomenon of evaporation is necessary for improving the controllability and understanding of this process. However, when compared with the cases of low-pressure nonequilibrium plasmas and atmospheric-pressure equilibrium (thermal) plasmas, the number of studies on droplet evaporation behavior in atmospheric-pressure nonequilibrium plasmas is limited [7, 8, 11].
The evaporation behavior of the droplets in the plasma is governed predominantly by the liquid vapor pressure at the surface of the droplets, which depends on their temperature. To determine the temperature of the droplets, heat transfer between them and the plasma must be considered. In low-pressure nonequilibrium plasmas, the mean free paths of the charged and gas species in the plasma are often sufficiently large compared to the size of the droplet; thus, a heat transfer model based on the free kinetic theory can be applied [15–18]. As described in [15], collisions of the droplet with neutral particles, electrons, and ions heat it; the presence of electrons and ions extensively accelerates the evaporation of the droplet when compared with the case without plasma. In atmospheric-pressure thermal plasma, where the gas temperature exceeds approximately 5000 K and the gaseous, electron, and ion temperatures are in equilibrium, if the mean free paths of the charged and gas species are of the order of or smaller than the size of the droplet, the continuum approach used in fluid mechanics and heat transfer can be applied [19, 20]. Assuming ionization equilibrium, once the temperature and composition of the gas are determined, the electron density is uniquely determined using the Saha equation, yielding an apparent thermal conductivity considering ionization and divergence reactions; its value is greater than that of a normal gas [21].
In atmospheric-pressure nonequilibrium plasmas, ionization equilibrium can no longer be assumed, and parameters such as electron and gas temperatures and electron density vary depending on the plasma conditions. Therefore, it is generally not possible to use the usual continuum approach, which assumes ionization equilibrium, as used in atmospheric-pressure thermal plasmas. In addition, the free-kinetic theory cannot be simply applied because of the high density of the environment. In recent years, there have been several reports on droplet evaporation behavior in atmospheric-pressure nonequilibrium plasmas. Oinuma et al observed droplet evaporation in atmospheric-pressure He plasma by introducing droplets using a droplet dispenser [7]. They reported that in plasmas with gas temperatures of 300–360 K and electron densities of 1017 m−3, the contribution of the charged species to the evaporation of droplets is negligible. In contrast, Maguire et al reported that microdroplets in atmospheric-pressure He/Ne plasmas with gas temperatures below 400 K and electron densities of the order of 1018 m−3 evaporate considerably faster than during normal evaporation, as inferred from the gas temperature [8]. It is assumed that as the plasma density increases, the fluxes of electrons and ions incident on the surface of the droplet also increase, which heats the droplet. However, in these reports, the results have been discussed in comparison with the case in which only the elevated environmental gas temperature is considered, and an understanding of the contribution of energy imparted by electrons, ions, and so on to the evaporation process remains a challenge.
Thus, the objective of this study is to understand the contribution of electrons and ions to the droplet evaporation process in atmospheric-pressure nonequilibrium plasmas by comparing experimental observations with the results obtained using a model. Droplets were introduced into atmospheric-pressure ultra-high-frequency (UHF) plasma, which has a high plasma density and is almost temporally stable. The evaporation process was observed in-situ. A piezo-driven inkjet device that ejects droplets based on the input of an electrical signal was used to generate droplets that measured several tens of microns in diameter. An atmospheric-pressure nonequilibrium plasma system interacting with inkjet droplets developed for material processing, such as printing and particle synthesis [22–25], was used. Using an inkjet device with extremely high controllability and reproducibility of droplet generation, high-resolution time- and space-resolved observation of droplets was rendered possible; the device is also useful for basic research on plasma–droplet interactions. A droplet evaporation model, which considers heat influxes owing to the kinetic energies of neutral particles, electrons, and ions and the energy released by recombination reactions, was established and compared with experimental droplets to understand droplet evaporation in atmospheric-pressure nonequilibrium plasmas.
2. Experimental setup
Figure 1(a) presents the schematic of the experimental setup for droplet observation. The setup consists of a plasma generator with an inkjet system, a droplet imaging system, and an optical emission spectroscope. Figure 1(b) shows the schematic of the plasma reactor. A pair of copper electrodes with vertical and horizontal lengths of 10 and 1 mm, respectively, were placed in parallel in a polytetrafluoroethylene (PTFE) casing. The inter-electrode spacing was 0.5 mm, and the direction of movement of the droplets and gas was vertical. For optical access, the back and front surfaces of the electrodes were enclosed within quartz windows. A piezo-driven inkjet head (Micro jet, IJHD-10), which had a single glass capillary nozzle with a circular hole ∼30 μm in diameter, was located 3 mm above the upper end of the electrodes. The droplets ejected from the inkjet nozzle were carried by an argon (Ar) gas flow introduced into the PTFE casing (flow rate: 20 sccm) and passed through the inter-electrode spacing. Pure water (Fujifilm Wako Chemical Ltd) was ejected as droplets at an ejection frequency of 10 Hz. The deviation in the droplet volume should be less than 2% during continuous operation. The atmospheric-pressure plasma was generated between the copper electrodes by applying an UHF wave of 450 MHz generated by a power supply (Tokyo Hi-power, RF50-450-P). The input power to the plasma was adjusted within the range 2.3–7.8 W by varying the output power from the power supply within the range 15–45 W. Cooled water at 5 °C was allowed to flow inside each electrode to stabilize the discharge during the experiment. Figure 1(c) displays a photograph of the discharge region at an input power of 7.8 W. The droplet imaging system consists of a charge-coupled device (CCD) camera (The Imaging Source, DMK 21BF04) equipped with a long-range microscope (QUESTAR, QM100) and a xenon flash lamp (Hamamatsu Photonics, E4370-01) with a light emission time of 2–3 μs to illuminate the droplets from the back of the PTFE casing. The timing of droplet ejection, exposure of the CCD camera, and emission of the flash lamp were synchronized and controlled using a function generator (NF, WF1974) and delay generator (STANFORD RESEARCH SYSTEMS, DG535). Figure 1(d) displays a typical CCD camera image of a water droplet, approximately 1 ms after ejection. Approximately 2.5 ms after ejection, the droplets reached the upper edge of the electrodes and passed through the plasma. Time-resolved optical emission spectroscopy (OES) of the plasma was performed using an intensified CCD camera (Hamamatsu Photonics, C8484-05G01 and C7164-03) equipped with a spectrometer (HORIBA Scientific, iHR320). The environmental gas temperature during evaporation was estimated from these OES spectra by estimating the OH rotation temperature, which should be approximately equal to the kinetic temperature of the environment [26–28].

Figure 1. Schematic of the (a) droplet observation system and (b) plasma reactor with inkjet device, (c) photograph of the discharge region, and (d) typical droplet image with a diameter of ∼20 μm.
Download figure:
Standard image High-resolution image3. Evaporation modeling
Assumptions made about the droplet applied to the model are as follows:
- (i)The droplet is spherical during evaporation, which is consistent with the CCD camera observation.
- (ii)The temperature gradient within the droplet was not considered because the Biot number (
 ) was much less than 0.1, where is the heat transfer coefficient between the droplet and the surrounding gas, is the droplet radius, and is the thermal conductivity of the droplet.
 - (iii)The effects of gravity and viscosity were negligible.
- (iv)Bubble formation and pressure build-up inside the droplet were absent.


The vapor pressure on the curved droplet surface  derived from the Clausius–Clapeyron equation is as follows [15, 16]:
where  is the pressure-related constant,
  is the latent heat of vaporization,
  is the gas constant,
  is the surface tension,
  is the molar volume of the liquid, and
  is the temperature of the droplet surface. The values used for the calculations are listed in table 1.
Table 1. Values used for calculating the rate of evaporation of water droplets [15].
| Substance | T (K) | P0 (Pa) |
 (kJ mol−1) (kJ mol−1) |
 (kg m−3) (kg m−3) |
 (J g−1 K) (J g−1 K) |
 (mN m−1) (mN m−1) |
|---|---|---|---|---|---|---|
| Water | <273 | 3.45 × 10¹² | 51 | 997 | 4.2 | 71 |
| >273 | 1.45 × 10¹¹ | 43.8 |
The rate of evaporation from a single droplet, which is balanced with the outgoing diffusion, is expressed as follows [29, 30]:
where  is the mass of the droplet,
  is the diffusion coefficient of liquid vapor, NA is the Avogadro constant,
  is the molecular weight of the liquid, and
  and
and  are the vapor concentrations at the surface of the droplet and in the surrounding gas, respectively. The temperature-dependent diffusion coefficient of the vaporized liquid was approximated using Andrussow's equation [31]. The vapor concentration ns at the surface of the droplet is calculated using the following equation:
where  is the Boltzmann constant.
To estimate the droplet temperature, five basic phenomena were included in the model: evaporation (cooling) , heat transfer from the surroundings
  , heating through electron collisions (
 ), heat originating from the kinetic energy of ions (including indirect ones) (
 ), and energy deposition through recombination of ions and electrons on the surface (
 ). In our system, because the electrodes were cooled by circulating water (5 °C), the temperature difference between the droplet and the electrode surface was relatively small. Thus, the heat transfer by radiation is several orders of magnitude lower than that of the other heat transfers and is neglected in our model. The temperature of the droplet is then estimated by the balance of the thermal energy flux as follows:
where  is the specific heat of the liquid and
  is the total amount of energy transferred to the droplet surface, as follows:

The loss by evaporation,  , is expressed as follows:
To estimate the heat transfer from the surrounding gas ( ), the Knudsen effect should be considered [32]. The governing parameter when considering the Knudsen effect is the Knudsen number (Kn), which is defined as follows:
where  is the mean free path of the gas molecules. When the Knudsen number is much smaller than 1 (
 ), the usual continuum approach used in fluid mechanics can be applied. In this regime,
  is expressed based on Fourier's heat conduction law with continuous boundary conditions as follows [30]:


where  , Nu,
, Nu,  ,
,  , and
, and  represent the thermal conductivity of the surrounding gas, Nusselt number, temperature of the surrounding gas, Reynolds number, and Prandtl number, respectively. When the velocity of the droplet is similar to that of the carrier gas, the Nusselt number is assumed to be approximately 2. The temperature-dependent thermal conductivity of argon gas was obtained from Yoshida and Akashi's study [20]. The effect of ionization on the thermal conductivity of neutral species is not taken into account as the plasma in this case is weakly ionized with an ionization degree smaller than 1%.
For 0.001 <  < 0.8, the Knudsen effect cannot be neglected, and the heat transfer equation is expressed using a temperature jump model [19] as follows:

where  and
and  are the thermal accommodation coefficient and specific heat ratio, respectively.
  is the ratio of the specific heat at constant pressure to the specific heat at constant volume. The reported thermal accommodation coefficients of gases on a liquid water surface are typically in the range 0.5–1 [33–36]. In this range, the evaporation rate did not vary dramatically, as shown in figure A2. In our following calculation, it is assumed that
  = 1 and
  = 1.667 [37].
In this study, where the gas temperature is in the range 300–1000 K and the environmental pressure is 1 atm, the mean free path of the gas molecules is in the range 0.06–0.2 μm; the model considers the above-mentioned two regimes during droplet evaporation. Although the Knudsen number achieves an even higher value just before complete evaporation, this period can be negligibly short (∼1 μs or less) for capturing the evaporation time, and such a droplet diameter is too small to be compared with the experimental results obtained in this study. In a higher Knudsen number regime ( > 10), the continuum approaches mentioned above are no longer applicable. For this flow situation, known as free molecular flow, the heat conduction from the surrounding gas can be evaluated using a model based on the kinetic theory of gases [32].
In a collision-less plasma with a low gas pressure, the electron and ion currents on the spherical surface can be obtained by assuming a Maxwellian electron energy distribution [15, 16, 18]. In contrast, in the continuum plasma case with high gas pressure, the practical electron and current characteristics of the spherical surface were examined by Patacchini and Hutchinson [38]. The heat transfer caused by the kinetic energy of electrons ( ) and ions (
 ), including the energies of neutralized particles via charge exchange in the sheath region [39–41], can be calculated by considering the electron and ion currents at the droplet surface as follows:


where  and
and  are the electron and ion flux densities, respectively.
  and
and  denote the electron temperature and the electron charge, respectively.
  is the difference between the plasma potential
  and floating potential of the droplet
  (
( =
=  ).
).
When considering electron and ion currents in spheres, the classification based on the bias at the droplet surface as defined by Patacchini and Hutchinson is considered:
- weak bias:
- strong bias: and ;
- moderate bias: otherwise,

where  is the normalized potential at the droplet surface defined as follows:
 is the normalized ion temperature, and
  is the transition potential where the quasineutrality breaks down [38].
In the weak bias regime, the electron and ion current densities are as follows:
where  ,
, 
 ,
,  , and
, and  denote the Knudsen number, density, and mean thermal speed of the electrons and ions, and
  is the Debye length, respectively. In this regime, the normalized sheath radius
  given by the droplet radius
  is approximately 1, i.e. the sheath thickness is almost zero.
The normalized floating potential at the droplet surface can be directly given by equating equations (15) and (16)
where  and
and  are the diffusion coefficients of the electrons and ions, respectively.
  and
and  are related to electron and ion mobility (
 ) by Einstein's relation (
 ).
).
In the strong bias regime, the ion current density is as follows:
 is the normalized sheath radius as follows:
where  is a weakly varying function of
  (
( ). In the case of a floating sphere, the electron current density is correlated with the ion current density (
 ).
).
The normalized potential at the droplet surface is given by the following equation if  is assumed:
When the droplet radius becomes much smaller than the sheath radius ( ), the plasma profiles are governed by quasineutral physics and become independent of
  . This regime is called the Coulomb limit and is not included in our calculation because the time period of the Coulomb limit region is extremely small (
 1 µs). The analytic solutions discussed above are said to be accurate to 15% or better [38]. Therefore, in the following calculation in figures 8–11, we included a 15% error in the electron and ion currents.
After arriving at the droplet, the ions and electrons recombine on the surface of the droplet as it floats without connecting to an external electrical circuit. Assuming that the recombination energy is released to the droplet, the energy deposition owing to the recombination energy  can be written as follows [15, 16, 18]:

where  is the ionization potential of the ions and
  = 15.7 eV for argon.
Using the foregoing equations, the histories of the droplet mass and temperature during the evaporation process were calculated using ordinary differential equations.
4. Results and discussion
4.1. Droplet observation
The size of the droplet was monitored as a function of the residence time by vertically shifting the observation point using CCD camera imaging to determine the evaporation behavior of the droplets in the plasma. Figure 2(a) displays images of the water droplets at various plasma input powers (0–7.8 W) and residence times in the plasma (0–16 ms). The starting point corresponds to the time when the droplets enter the plasma from the upper end. The droplets remained spherical without any notable distortion. Figure 2(b) depicts the temporal variations in the water droplet diameter with respect to the droplet residence time in the plasma. The initial droplet diameter was approximately 27 μm for each value of input power. Without plasma generation, there was almost no decrease in the droplet diameter within the 20 ms that were monitored. In contrast, droplet size reductions caused by evaporation were clearly observed owing to the plasma generation at input powers of 2.3–7.8 W. With an increase in the input power, the evaporation rate increased. At an input power of 7.8 W, the water droplets completely evaporated at ∼12.5 ms. The time that the droplets pass through the plasma region also varied in the range 10–20 ms depending on the input power of the plasma, as shown in figure A1. We estimated the average gas flow velocity based on the gas temperatures estimated in figure 5 (shown below). The estimated and experimental positions of the droplets are in good agreement (zero relative velocity) when assuming laminar flow.
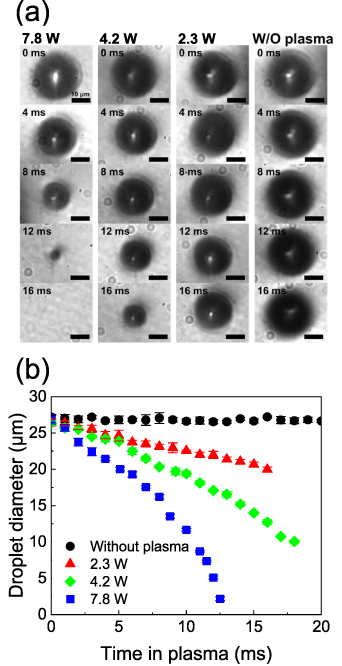
Figure 2. (a) CCD camera images of water droplets for various residence times in the plasma (0–16 ms) and input powers of the plasma (0 (without plasma)–7.8 W). The scale bars in (a) correspond to 10 μm. (b) Temporal variation in the diameters of the water droplets estimated from the CCD camera images with or without plasma generations. Error bars in (b) exhibit the standard deviation of the droplet diameters obtained from three different images.
Download figure:
Standard image High-resolution imageThe evaporation rate of a liquid droplet typically follows D-squared law ( ) [42], where
  ,
,  , and
, and  are the droplet diameter, initial droplet diameter, and evaporation constant, respectively. For example, Heinisch et al measured the evaporation constant
  of 1.2 × 10⁻¹⁰ m2 s−1 and 1.4 × 10⁻⁹ m2 s−1 for droplets in stagnant wet N2 and flowing dry N2, respectively [43]. In our case, the evaporation constants
  at the input powers of 2.3–7.8 W were estimated to be 2.0–6.3 × 10⁻⁸ m2 s−1. These values are 1–2 orders of magnitude higher than those observed at room temperature.
4.2. OES
OES was used as a diagnostic tool for analyzing the plasma. Figure 3 displays the time- and space-averaged optical emission spectra for input powers of 2.3, 4.2, and 7.8 W. These spectra exhibit the emission lines of Ar (the carrier gas) and H.

Figure 3. Time- and space-averaged OES spectra for a wavelength range of 350–800 nm. The integration time and accumulation are 50 ms and 10 times, respectively.
Download figure:
Standard image High-resolution imageThe gas temperature was estimated from the rotational temperature of OH, which has often been reported to be in equilibrium with the gas temperature. For the estimation, the theoretical spectra at various rotational temperatures were simulated with a one-temperature model and compared with the experimental spectra. In high-water-vapor conditions, the estimation of OH rotational temperature using the two-temperature model is often applied [26–28, 44]. However, in the present study, the analysis even with the two-temperature model predicted that the best-matched spectrum is almost a one-rotational temperature spectrum with an extremely small amount of high temperature components. The main lower temperature is identical to or slightly lower than the one extracted by a one-temperature model. Figure 4(a) presents the result of such fitting by a one-temperature model at 1 mm from the upper end of the electrodes at an input power of 7.8 W; the theoretical spectrum at 840 K is in good agreement with the experimental spectrum. To evaluate the temporal change in the gas temperature owing to the introduction of droplets, the emission spectrum was continuously measured every 2 ms, and the gas temperature was estimated from each emission spectrum. Figure 4(b) depicts the temporal variation in the OH rotational temperature and the emission intensity of the OH line at 309.1 nm at an input power of 7.8 W at a distance of 1 mm from the upper end of the electrodes. With the introduction of droplets, the OH emission intensity decreased by ∼20% over a period of approximately 5 ms and recovered to the original emission intensity over a period of approximately 10 ms. Similar to the OH line, the emission intensities of the Ar and H lines also decreased by approximately 20% in response to the introduction of the droplets. The increase in the concentration of H2O in the plasma owing to the evaporation of water from the surface of the droplet contributes to the decrease in emission intensity [44, 45]. The main mechanism for the decrease in atomic line intensity at higher water content is thought to be the increase in energy transfer between electrons and heavy species due to the addition of molecular species such as H2O, resulting in a decrease in  [44]. A decrease in OH band intensity is due to the high efficiency of radicals quenching with water vapor, which is also due to the decrease in
  [44, 46, 47]. Therefore, we can attribute the reduced emission intensity to the reduced electron temperature around the droplet when compared with the bulk plasma. Although the droplet seemed to be carried by the carrier gas in the plasma (zero relative velocity), as shown in figure A1, an asymmetric structure existed before and after the passage of the droplet. This asymmetric structure may be associated with the water vapor tail, as the droplet initially moves faster than the carrier gas just after ejection. Therefore, the trail could be a slightly water-vapor-rich region. Although the emission intensity varied, the environmental gas temperature estimated by OES was nearly constant. Because the measurement region was approximately 0.5 mm, we can only conclude that there was emission reduction around the droplet, and it is reasonable to assume a constant temperature in the model.
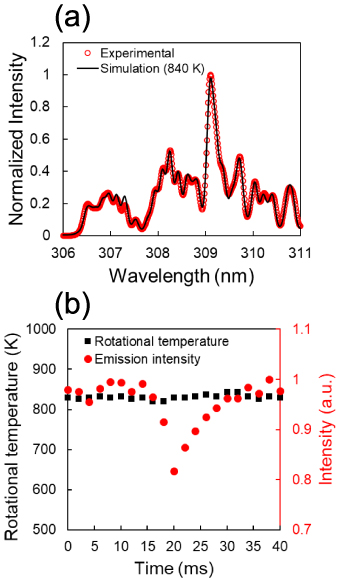
Figure 4. (a) Emission spectrum of OH (306–311 nm) at 1 mm from the upper end of electrodes at an input power of 7.8 W; theoretical spectrum at 840 K. The vertical axis represents the emission intensity normalized by the peak at 309.1 nm. (b) Temporal variation in the estimated OH rotational temperature and emission intensity of the peak at 309.1 nm normalized by the highest emission intensity. The exposure time and accumulation were 2 ms and 10 times, respectively.
Download figure:
Standard image High-resolution imageThe spatial distribution of the gas temperature was also examined. Figure 5 depicts the vertical distribution of the estimated OH rotational temperature at an input power of 2.3–7.8 W. The temperature of the gas increased in the range 500–900 K with an increase in the input power. Although the temperature tended to be slightly higher near the upper end of the electrode, the change in it in the vertical direction was relatively small. However, in the evaporation model described below, we considered this small variation in temperature by applying the fitted temporal change to the model.
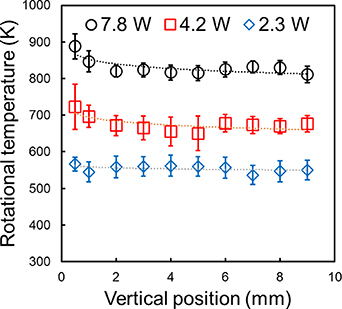
Figure 5. Estimated gas temperatures as a function of the vertical position in the plasma at an input power of 2.3–7.8 W. The zero position corresponds to the upper edge of the electrodes. The error bars illustrate the standard deviations of six different measurements.
Download figure:
Standard image High-resolution imageThe electron density in the plasma was estimated from the spectral broadening of the hydrogen line (Hβ
:486 nm) [26, 48]. Due to the electric field of electrons in the plasma, the broadening of the emission line is enhanced; this is called the Stark broadening  . From the measured line width, the Stark broadening
  can be estimated by removing the other broadening components: The Doppler broadening
  owing to the motion of excited particles, the van der Waals broadening
  owing to the interaction with neutral particles, and the instrument function, comprising the Gaussian broadening
  and the Lorentzian broadening
  . In the Hβ
line, the electron number density is approximated by the following equation [48]:
. In the Hβ
line, the electron number density is approximated by the following equation [48]:
Figure 6 shows the Hβ
spectrum observed at an input power of 7.8 W with a gas temperature of ∼840 K. The fitted Voigt function (Lorentzian broadening of 0.13 nm and Gaussian broadening of 0.21 nm) is also presented in figure 6. The instrumental function was well represented using a Gaussian function with a fullwidth at half maximum of 0.21 nm, estimated with a Hg line at 466 nm from a Hg lamp. Doppler broadening  of H atoms is less than 0.01 nm at the gas temperature of 500–900 K [48], and therefore, the Gaussian broadening in the fitted spectra mainly represents the instrumental profile. The Lorentzian broadening consists of Van der Waals broadening
  and Stark broadening
  . The
. The  for the Hβ
line in atmospheric-pressure Ar is in the range of 0.02 nm at the gas temperature of 840 K [48]. As a result, the remaining Stark broadening Δλs are estimated as 0.11 nm, resulting in an electron number density of approximately 3.8 × 10²⁰ m−3, calculated by equation (22). The same procedure was followed for the other input powers, and a summary of the electron densities is presented in figure 7. The average electron density increased in the range 2.6–4.3 × 10²⁰ m−3 with increasing input power.
for the Hβ
line in atmospheric-pressure Ar is in the range of 0.02 nm at the gas temperature of 840 K [48]. As a result, the remaining Stark broadening Δλs are estimated as 0.11 nm, resulting in an electron number density of approximately 3.8 × 10²⁰ m−3, calculated by equation (22). The same procedure was followed for the other input powers, and a summary of the electron densities is presented in figure 7. The average electron density increased in the range 2.6–4.3 × 10²⁰ m−3 with increasing input power.
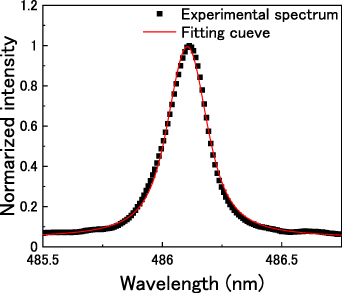
Figure 6. Experimental spectrum of Hβ at 486 nm (input power; 7.8 W) with theoretical spectrum via the Voigt function (red line).
Download figure:
Standard image High-resolution image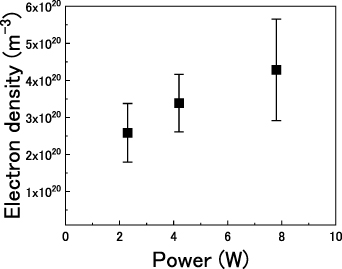
Figure 7. Estimated electron density as a function of input power. Error bars exhibit the standard deviation obtained from three different measurements.
Download figure:
Standard image High-resolution image4.3. Theoretical model calculation of the evaporation of droplets
Figure 8(a) presents the time variation in the diameters of the water droplets at an input power of 7.8 W and the theoretical diameters of the water droplets calculated while varying the electron temperature (0.5–5.0 eV). As a comparison, the calculation result without plasma ( = 0 m−3) is also shown. The initial droplet diameter and temperature used in the calculation were 27 μm and 293 K, respectively. The temperature of the gas as a function of the duration (position) obtained from figure 5 was used as the temperature of the surrounding gas. The average electron density (4.3 × 10²⁰ m−3) estimated using the OES, as described in section 4.2, was tentatively used. The ion temperature
  was assumed to be equal to the gas temperature
  . The environmental pressure was maintained at 1 atm. The increase in electron temperature contributed to an increase in the rate of evaporation of the droplets. Under the calculated conditions, the results obtained from the calculation agreed well with the results obtained from the experiment when the electron temperature was set to 1.1 eV. Figure 8(b) indicates the time variation in the diameters of the water droplets at an input power of 7.8 W and the theoretical diameters of the water droplets calculated by varying the electron density (0–1021 m−3) when the electron temperature is fixed at 1.1 eV. At electron densities lower than 1019 m−3, the evaporation rate was almost unchanged when compared with that without the plasma and lower than the experimentally observed rate (time required for complete evaporation: ∼12.5 ms). An enhancement was observed in the evaporation rate when the electron density exceeded 1019 m−3. These calculation results indicate the existence of combinations of electron density and temperature that fit well with the experimental evaporation rate. For an input power of 7.8 W, approximately 11% of the total energy influx to the droplet surface was estimated to be caused by electrons, ions, and recombination reactions (see figure 11 for the details).

Figure 8. Variation in the diameters of the water droplets in the plasma at an input power of 7.8 W as a function of residence time in the plasma when compared with the theoretical droplet diameters for (a) an electron temperature of 0.5–5.0 eV at an electron density of 4.3 × 10²⁰ m−3 and (b) an electron density 1019–1022 m−3 at an electron temperature of 1.1 eV.
Download figure:
Standard image High-resolution imageFigure 9(a) depicts the time required for the complete vaporization of the droplet (evaporation time) while varying the surrounding gas temperature and electron density at an electron temperature of 1.1 eV. At electron densities below 1019 m−3, the evaporation acceleration caused by the existence of electrons and ions was almost negligible, and the time required for evaporation was mostly determined by the surrounding gas temperature. Figure 9(b) depicts the time required for the complete vaporization of the droplet under varying electron temperature and density and the condition of an estimated gas temperature at an input power of 7.8 W (average gas temperature: ∼840 K). The time required for evaporation decreases with increasing electron temperature and density. Electron densities yielding experimental evaporation times of approximately 12.5 ms at an input power of 7.8 W ranged from 5.0 × 10¹⁹ to 1.5 × 10²¹ m−3 for electron temperatures in the range 0.5–5 eV.
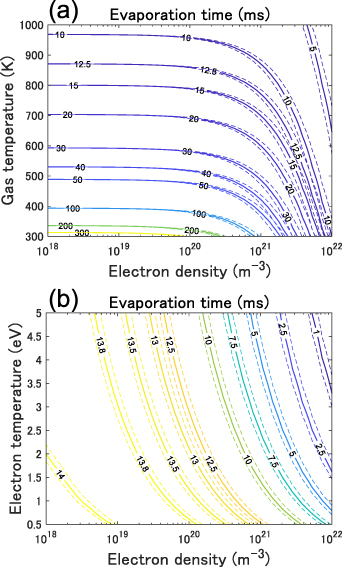
Figure 9. Calculated time required for the complete evaporation of the droplet while varying (a) gas temperature and electron density and (b) electron temperature and electron density of plasma. Initial droplet diameter and temperature is 27 μm and 293 K, respectively. The electron temperature of 1.1 eV was used in (a) and the gas temperature distribution at the input power of 7.8 W depicted in figure 5 was used for the environmental gas temperature in (b) (average temperature: ∼840 K).
Download figure:
Standard image High-resolution imageFigure 10 summarizes the same procedures performed at other input powers. The estimated electron density and environmental gas temperatures, as described in section 4.2, were used for each calculation. The electron temperature is fixed at 1.1 eV. For reference, the calculation results for each input power without considering the existence of electrons and ions ( ) are also presented. The higher the input power, the larger is the difference between the experimentally observed droplet evaporation rate and that calculated by considering only the environmental gas temperature. At each input power, the experimental results and theoretical model indicated a good agreement when considering the contributions of electrons and ions. Furthermore, a similar procedure was performed for ethanol droplets, and the experimental results and calculation in this case were also in good agreement (figure A3). Although not comparable to the experimental results, similar droplet evaporations modeled for various initial droplet diameters, gas temperatures, electron densities, electron temperatures, and solvents are summarized in the appendix (figures A4–A13).

Figure 10. Comparison of the experimental and theoretical water droplet diameters as functions of residence time in the plasma for input powers of 0–7.8 W.
Download figure:
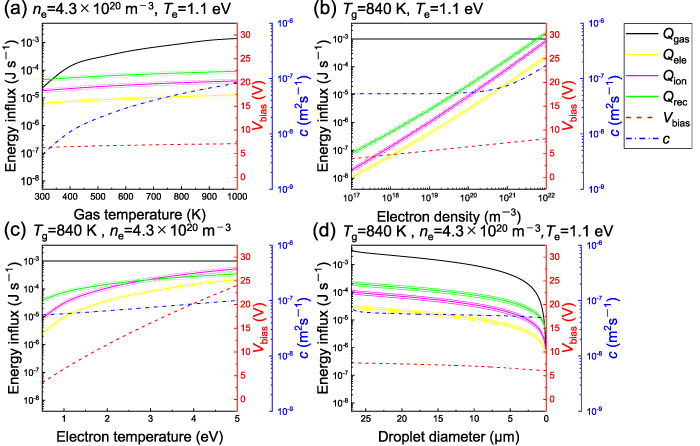
Standard image High-resolution imageIn figures 11(a)–(d), the contribution of each heat transfer process is depicted as a function of the environmental gas temperature, electron density, electron temperature, and droplet diameter around the parameters for 7.8 W. Each figure presents a comparison of the calculated energy influxes caused by the environmental gas temperature  , electron collision
  , ion collision
  , and recombination reaction
  ;
;  is also depicted. Figure 11(a) depicts the calculated energy influxes to a 10 μm droplet caused by each heat transfer process as a function of the environmental gas temperature. The energy influx of
  was significantly increased in the range 10−5–10−3 J s−1 with an increase in the gas temperature in the range 300–1000 K. Because of the assumed equilibrium between the gas and ion temperatures, the thermal velocity of the ions,
  , increased with an increase in the environmental gas temperature. Therefore, as the gas temperature increased, the ion current and electron current increased, leading to an increase in the energy influxes of
  ,
,  , and
, and  . However, this increase in
  ,
,  , and
, and  was minor when compared with the increase in
  .
.  was approximately in the range 6–7 V and did not vary significantly with the gas temperature. Figures 11(b) and (c) depict the variation in each energy influx to a 10 μm droplet as a function of the electron density and electron temperature. Clearly, when the temperature of the gas is constant,
  does not vary with variations in the electron density or electron temperature. In contrast, increases in the electron density and electron temperature contribute to increases in
  ,
,  , and
, and  , primarily because of the increase in the electron and ion currents at the surfaces of the droplets.
  exhibited an almost linear relationship with the electron temperature. As depicted in figures 11(d) a decrease in the droplet diameter leads to a decrease in the surface area of the droplet and a corresponding decrease in the energy influxes to the droplet. As the diameter of the droplet decreased, its absolute value of
  also decreased slightly, owing to the correlation between the electron and ion currents at the droplet and the diameter of the droplet. In each figure, the evaporation constant c, derived from the D-squared law, is also indicated. The evaporation constant increases as the heat influx to the droplet increases. As shown in figure 11(b), the evaporation constant becomes very sensitive to electron density in the high density region (>1019 m−3).
Figure 11. Calculated energy influxes to a droplet from the surrounding gas ( , electron collisions
  , ions collisions
  , and recombination reaction (
 ) as functions of (a) environmental gas temperature, (b) electron density, (c) electron temperature, and (d) droplet diameter. The difference between the plasma potential and floating potential (
 ) and the evaporation constant (c) are also indicated in each figure. The gas temperature, electron density, electron temperature, and droplet diameter were fixed at 840 K, 6.5 × 10¹⁹ m−3, 0.8 eV, and 10 μm, respectively, when they were not varied as parameters.
Download figure:
Standard image High-resolution image
5. Conclusion
In this study, the droplet evaporation behavior in atmospheric-pressure nonequilibrium plasma was observed by introducing well-controlled micro-sized droplets ejected from an inkjet device into atmospheric-pressure Ar UHF plasma. With an increase in the input power of the plasma, the rate of evaporation of the droplets increased; for example, the water droplets with diameters of ∼27 μm were completely evaporated in ∼12.5 ms at an input power of 7.8 W. Simultaneously, with droplet observation, we estimated the surrounding gas temperature based on the optical emissions of OH. The gas temperature increased in the range 500–900 K with an increasing input power. Using Stark broadening of Hβ line, the electron density was estimated to be 2.6–4.3 ×10²⁰ m−3.
We also modeled the droplet evaporation behavior using a simple energy balance model to estimate the energy fluxes between the plasma and droplets based on the measured plasma parameters. The evaporation model based on the energy influxes caused by the electron and ion collisions and recombination reactions can well explain the experimentally observed evaporation behavior, whereas the model assuming zero electron density seems to indicate a slower evaporation rate. In high-density plasmas with electron and ion densities above 1019 m−3, it is suggested that droplet evaporation is accelerated with increasing electron density and electron temperature, whereas the effect of the charged species is not apparent from the lower density in the temperature region 300–1000 K. These findings are expected to contribute to the understanding and control of various atmospheric-pressure nonequilibrium plasma processes with micro-sized droplets, such as film deposition, particle synthesis, and material conversion.
Acknowledgments
This work was partially supported by JSPS KAKENHI (Grant Nos. 16H05988 and 19H01885). One of the authors (K N) was supported by a Grant-in-Aid from the JSPS Research Fellowship (Grant No. 20J21827).
Data availability statement
All data that support the findings of this study are included within the article (and any supplementary files).
Supplementary data (5.5 MB PDF)