

Abstract
Plasma catalysis is gaining increasing interest for various applications, but the underlying mechanisms are still far from understood. Hence, more fundamental research is needed to understand these mechanisms. This can be obtained by both modelling and experiments. This foundations paper describes the fundamental insights in plasma catalysis, as well as efforts to gain more insights by modelling and experiments. Furthermore, it discusses the state-of-the-art of the major plasma catalysis applications, as well as successes and challenges of technology transfer of these applications.
Export citation and abstract BibTeX RIS
1. Introduction
Plasma catalysis is gaining increasing interest for various environmental applications [1–10]. We can roughly distinguish two main application fields, i.e., gas cleaning and gas conversion. Gas cleaning refers to the removal of relatively low concentrations of unwanted components from a gas stream, such as volatile organic compounds (VOCs) and NOx . In gas conversion, the input gases are in high concentration and are typically converted to higher-value products. Examples include the splitting and hydrogenation of CO2, dry reforming or partial oxidation of methane to produce syngas, higher hydrocarbons or oxygenates, and the production of ammonia from nitrogen and hydrogen.
The gas cleaning applications are quite mature already, and this is especially true for the removal of VOCs, for which commercial devices have been available for many years. The technology readiness level (TRL) of gas conversion applications is much lower. Indeed, these applications are better described as emerging and still face several challenges, such as the need to improve energy efficiency and to design optimal catalysts tailored to the plasma conditions, as well as to improve the product yield and selectivity.
Hence, to make further progress, there is a crucial need for a better understanding of the underlying mechanisms. While plasma and catalysis on their own are already quite complex, their combination is even much more complicated. Indeed, the catalyst affects the plasma behaviour, and the plasma affects the catalytic process in multiple ways (see further). A better insight in these mechanisms can be obtained from experiments and modelling.
This foundations paper explains the current knowledge on the underlying mechanisms (section 2), followed by how modelling and diagnostic experiments of both the plasma and catalyst surface can help to elucidate these mechanisms. As explained in section 3, multi-scale modelling is being developed, combining models at various levels. The measurements carried out in plasma catalysis are mostly focused on determining performance parameters, for which it is important to be precise about their meaning in order to make relevant comparisons between reactors. Furthermore, the understanding of the microscopic mechanisms at the heart of the plasma–catalyst interaction requires the use of in situ measurement techniques of both the plasma phase in contact with the catalyst and the surface properties under direct exposure to the plasma, as will be discussed in section 4. Section 5 provides an overview of the various applications, and finally, section 6 describes the status, successes and challenges of technology transfer.
2. Fundamental insights
2.1. From thermal catalysis to plasma catalysis: the role of kinetics and thermodynamics
When asked to describe the fundamental laws governing the whole of chemistry, the likely answer would be quantum mechanics and thermodynamics. Quantum mechanics essentially dictates how molecules interact with each other at the most fundamental level, while thermodynamics tells us the end-point of the evolution of a macroscopic system, given a set of boundary conditions. As such, it defines the arrow of time. It also tells us, from a more chemical perspective, where the equilibrium state of the system is located along the reaction coordinates. The driving force to reach this equilibrium state, then, is the change in the free energy of the system. The free energy of the system, finally, is determined by what molecules the system is composed of under the given boundary conditions and how energy is partitioned over their various degrees of freedom, which are essentially solutions to the Schrödinger equation.
So, where does kinetics enter the equation? It could be argued that kinetics is nature's way of bringing thermodynamics into practice. Given enough time, the ratios of the reaction rates of all possible reactions in the system, given the imposed boundary conditions, eventually lead to an equilibrium state—or, in many open system cases, a steady-state. Alternatively, of course, one could say that thermodynamics is essentially the convoluted result of kinetics. Either way, both kinetics and thermodynamics are of fundamental importance for any chemical process and are intimately connected. Kinetics, furthermore, yield a wealth of data on the possible operative mechanisms and can thus be studied to elucidate these mechanisms. As plasma catalysis is nothing more than a—admittedly very complicated—chemical process, it is thus important to understand how thermodynamics and kinetics determine the processes occurring in plasma catalysis. This is further underlined by the intrinsic non-equilibrium nature of plasmas, which, incidentally, distinguishes plasma–catalytic systems from thermal-catalytic systems, which are most often characterized by thermal equilibrium. Indeed, this non-equilibrium nature turns out to be an essential feature determining many of their properties, and thereby their application potential in catalysis.
Let us illustrate the importance of both kinetics and thermodynamics by referring to a specific study by Rouwenhorst et al on plasma–catalytic NH3 synthesis. Although the discussion below focusses on the importance of vibrationally excited molecules, this is by no means the only route to an effective plasma–catalytic process or to synergy. Indeed, in other setups or other processes, other mechanisms may (and will) be at play.
In a theoretical calculation by Mehta et al [11], the plasma-induced vibrational excitation of N2 in the gas phase was put forward as the key mechanism in lowering the rate-limiting N2 dissociation barrier, and thus enhancing the overall rate of the NH3 synthesis reaction. In their experimental study, Rouwenhorst et al verified and confirmed this hypothesis [12]. Furthermore, they demonstrated that the apparent activation barrier for the process, which for the thermal-catalytic process is ∼60–115 kJ mol−1, is lowered to a range of ∼20–40 kJ mol−1 in their plasma–catalytic setup.
To distinguish the possible mechanisms in their discussion, they introduced the following nomenclature (see figure 1 ): (1) plasma-phase NH3 synthesis, where the entire synthesis proceeds through gas-phase reactions; (2) surface-enhanced plasma-driven NH3 synthesis, where plasma-generated radicals adsorb on the surface, which may subsequently diffuse and combine to form NH3; (3) plasma-enhanced semi-catalytic NH3 synthesis, where plasma-generated N* radicals adsorb on the catalyst surface, while H2 dissociates on the catalyst. Note that in this mechanism, the rate-limiting step, viz N2 dissociation, is not catalyzed. And (4) plasma-enhanced catalytic NH3 synthesis, where both N2 and H2 chemisorb dissociatively.

Figure 1. Reaction mechanisms of ammonia synthesis, after Rouwenhorst et al [12]: (a) plasma-phase mechanism; (b) surface-enhanced plasma-driven mechanism; (c) plasma-enhanced semicatalytic mechanism; (d) plasma-enhanced catalytic mechanism. Reactions directly relevant for the mechanisms are depicted with full arrows, while subsequent reactions to ammonia formation are depicted with dashed arrows. Blue spheres represent nitrogen atoms, grey spheres represent hydrogen atoms. For further details, see text.
Download figure:
Standard image High-resolution imageOnly the latter mechanism turns out to be consistent with the obtained kinetic data in their particular setup. We emphasize that the results and conclusions are indeed particular for this setup, as their conclusions were modified in a later work, which used a somewhat different setup [13]. In this more recent work, the authors impart an important role to the radicals as function of reaction temperature and plasma power [13]. Regardless, from their kinetic studies, Rouwenhorst et al demonstrate what the operative mechanism in their particular setup should be. The first observation is therefore that the study of chemical kinetics is essential in unravelling plasma–catalytic pathways.
The second important observation with respect to the kinetics of the process is that the plasma–catalytic operation—at least in this particular study—does not necessarily change the conceptual mechanism. Indeed, both the N2 and the H2 are still catalytically dissociated on the catalyst surface, as they are in thermal catalysis. The importance of the plasma, rather, is to efficiently pre-activate the key reactant, which in turn increases the rate of the overall process. Therefore, while different mechanisms may be operative in plasma catalysis compared to thermal catalysis, an actual change in mechanism does not seem to be a prerequisite.
A third important observation coming forward from this and similar studies is the role of thermodynamics in plasma catalysis. Recall that classical equilibrium thermodynamics in a closed system essentially determines where the equilibrium of a system is located along the global reaction coordinate, which in turn is determined by all possible reactions, subject to the boundary conditions of the process. This equilibrium is a direct result of the equalization of the chemical potentials of the various components in the reaction mixture and leads to the unambiguous definition of an equilibrium constant for the process as a function of the reaction conditions. The driving force to reach this equilibrium is, as mentioned, the change in free energy of the system: the system reaches an equilibrium state when the free energy attains its minimum value along the reaction coordinate.
However, plasma–catalytic systems are typically not closed but rather open systems, operating in a continuous manner, where reactants continuously flow into the reactor and products flow out. In this case, one typically strives to attain a steady-state, as this allows control to be maintained over the process on the one hand (e.g. a constant outflow of products) while at the same time allowing continuous operation. In any such system, equilibrium will, in general, not be reached.
Second, technological plasmas are, by their very nature, strongly non-equilibrium systems. They are characterized by either a continuous or pulsed energy input (in the form of electricity), resulting in an electron temperature that is typically much higher than the neutral gas temperature. Moreover, depending on the mean energy of the electrons, different plasma phase reaction channels may be preferentially tapped. For instance, vibrational excitation, electronic excitation, dissociation, ionization, etc, are all important non-equilibrium features of many technological plasmas, not observed (to any substantial degree) in the gas phase of thermal catalytic processes. Thus, again depending on the precise nature of the plasma and the operating conditions, one could, and one typically does, define several temperature scales: an electronic temperature (or more elaborately, an electron energy distribution function (EEDF)), an ion temperature (or equivalently an ion energy distribution function), a neutral gas temperature, and also, for instance, a vibrational temperature characterizing the population of vibrationally excited states. Indeed, while under standard thermal catalytic operating conditions the vibrational levels of most molecules will be nearly frozen, i.e., not activated, they can be activated in plasma–catalytic systems, such that energy is also partitioned into these degrees of freedom.
In the study of Rouwenhorst et al mentioned above [12], the electrons indeed gave rise to a significant vibrational excitation of N2. This is very much a non-equilibrium feature of the plasma. This feature thus changes the nature of the reactants involved, and therefore the relevant chemical potentials, which strive to equalise to reach equilibrium. As a result, it can be expected that even when the global mechanism of a process does not change in a plasma–catalytic setup, the equilibrium constant will be modified. This, in turn, leads directly to the observed modified kinetics.
It is thus clear that the notion that the kinetics and the thermodynamics of a process are intimately connected still holds in plasma–catalytic processes. The boundary conditions of the process (e.g. the input of electrical energy) modify the process relative to thermal catalysis, thereby modifying the nature of the reactants, which alter the governing thermodynamics, resulting in different kinetics. In the case of the Rouwenhorst study, this led to a clear plasma–catalytic synergy.
This change in boundary conditions, however, is not a sufficient condition for synergy. Indeed, only when the key, rate-determining processes are affected by the plasma can synergy be expected.
Based on the above, it could be argued that only the fourth mechanism described above ('plasma-enhanced catalytic NH3 synthesis') is truly plasma–catalytic, where synergy is to be expected. Indeed, the plasma, in this case, serves to vibrationally excite the N2 molecules, which enhances the N–N bond-breaking process at the catalytic surface. Importantly, it was found that while this pathway still follows classical thermodynamics, it does show a change in equilibrium constant due to the plasma-induced vibrational excitation of the key reactant.
We reiterate that the discussion above does not imply that vibrational excitation of reactant molecules is the only mechanism towards some form of synergy in plasma catalysis. Indeed, other mechanisms may be operative in different setups and in different systems, as a function of the various elementary processes that may take place. We shall now describe these elementary processes.
2.2. Elementary processes in plasma–catalyst interactions
As argued in section 2.1 above, the key difference between non-thermal plasma and traditional thermal approaches is that much of the energy in the plasma is stored in a limited number of degrees of freedom, i.e., in free electrons, ions, radicals and (vibrationally or electronically) excited molecules. Energy can, therefore, at least in principle, be much more efficiently delivered to specific reaction channels, thereby selectively stimulating certain chemical processes beyond what would be achievable under local thermal equilibrium, with efficiencies exceeding 50% [6]. We do note, however, that this non-equilibrium character is easier to maintain at low pressures, while plasma chemistry for conversion processes generally requires atmospheric pressure to be efficient.
As is the case with gas-phase plasma chemistry, the physicochemical plasma-driven processes at the catalyst surface can be divided into electronic effects, arising from the charge separation in the plasma, and thermal effects, in the form of vibrationally or electronically excited molecules and localized heating. These can affect both the reactions at the catalyst as well as the chemical properties of the catalyst itself. A pictorial summary of possible interactions between plasma and catalyst is shown in figure 2.

Figure 2. Elementary plasma–catalyst interactions, leading to possible plasma–catalyst synergy. Reproduced from [9]. © IOP Publishing Ltd. CC BY 4.0.
Download figure:
Standard image High-resolution imageA zeroth-order approximation to plasma–catalyst interactions is the gas-catalyst interaction typical of thermal catalysis. As a result, all the typical elementary processes occurring in thermal catalysis can also be expected to be operative, at least to some degree, in plasma catalysis. These processes include adsorption of stable molecules, including reactants, but also readsorption of product molecules, surface diffusion, surface-mediated bond breaking and bond formation, and surface desorption. Adsorption may further be subdivided into physisorption and chemisorption, and chemisorption may occur either molecularly (i.e., without concurrent dissociation of the adsorbing molecule) or dissociatively (i.e., when the molecule dissociates while adsorbing on the surface). Moreover, all of the factors that contribute to the catalytic process in thermal catalysis are likely to be important in plasma catalysis as well. These factors include, for instance, the size distribution of the catalyst particles [14], the precise surface structure of the catalyst [15], and the support material [16]. All of these modify critical process parameters, including both thermodynamic properties such as the adsorption energy of the reactants [17], as well as kinetic properties, such as the reaction barriers and rate coefficients [18, 19]. The convoluted result is that the thermodynamics and kinetics of the catalytic process are strongly dependent on the chosen boundary conditions.
Plasma–surface interactions, then, can naively be thought of as a first-order perturbation of this zeroth-order approximation. While this may be a valid approach for post-plasma catalysis setups, where the catalytic stage is spatially separated from the plasma stage, experimental evidence seems to point out that the very effects that arise due to the presence of the plasma may be the leading term in in-plasma catalysis, where the catalysis takes place in the same spatial volume as the plasma. Thus, in in-plasma catalysis setups, effects such as surface charging, adsorption of (vibrationally or electronically) excited species or radicals, or the presence of an electric field in determining a plasma–catalytic process may significantly contribute to the thermal catalytic mechanisms. Thus, from a process point of view, also post-plasma catalysis may be advantageous with respect to thermal catalysis, as the plasma may generate species not available in thermal catalysis that can subsequently react more efficiently with the catalyst (as is e.g. the case in NOx reduction), but in in-plasma catalysis, the very nature of the catalytic step itself may be modified due to these plasma-induced processes. This may lead to plasma–catalyst synergy, as discussed in section 2.3.
Surface charging is inevitable in in-plasma catalysis setups. It arises due to the much higher mobility of electrons compared to ions, leading to an initially much higher electron flux than ion flux to any surface exposed to the plasma. This surface charge sets up a counteracting potential, such that ion and electron fluxes eventually become balanced on average. The resulting negative surface charge modifies the electronic structure of the surface. Considered from a more chemical perspective, this negative surface charge makes the surface less Lewis acidic and more Lewis basic, which therefore promotes the reactivity of incoming Lewis acids such as CO2. The overall effect of surface charge may or may not be important, depending on the surface charge density and the nature of the surface chemical reactions taking place.
Vice versa, the impinging species may also be charged—ions are an essential component of plasmas. Depending on the plasma source gas, both positive and negative ions may be present. Further, as ions are charged, their behaviour is determined by the electric field. The importance of ion impacts on plasma-enhanced chemical vapour deposition processes is well-known [20]. However, most technological plasmas are only weakly ionized, so the fraction of ions relative to the fractions of neutral molecules and radicals is small. In contrast to processes that are dominated by the energetic ion impacts on a surface, ion–surface interactions are not expected to be a process-dominating feature in plasma catalysis [21].
Plasmas are also characterized by the presence of electric fields. These fields not only determine the energy distributions of electrons and ions, and thus also the energy of the ions arriving at the surface, but also operate on the charge distribution at the surface. This effect is further enhanced on rough surfaces or on surfaces with distinct geometric surface features, such as surface protrusions where the field lines can concentrate. In such cases, the electric field will be quite strong locally, which is likely to affect the charge distribution and hence the chemical reactivity strongly.
The adsorption of (vibrationally or electronically) excited species is another factor that is characteristic of plasma–catalytic systems. Basically, if the mean energy of the plasma electrons is in a suitable range (typically around 1 eV for, e.g. CO2 or N2), they preferentially pump energy into the molecular vibrational levels. This, in turn, lowers the barrier for dissociation when the excited molecule impinges on the surface, as shown in figure 3(a). The condition for this typical plasma feature to have a significant effect on the catalyst reactions is that the vibrational energy can be channelled into the actual reaction coordinate. As argued above in section 2.1, this can be the case for plasma–catalytic NH3 synthesis under specific (very mild) plasma conditions. As argued below in section 2.3.2.1 for CH4 methane dissociation, this is not necessarily the case.

Figure 3. (a) Energy plot for plasma activation of vibrational levels of molecular reactants lower the reaction barrier. (b) Energy plot of plasma formation of radicals. Reproduced from [9]. © IOP Publishing Ltd. CC BY 4.0.
Download figure:
Standard image High-resolution imageA fifth process that is unique to plasma–catalyst interactions is the interaction of radicals with the surface. Indeed, while in thermal catalysis, the impinging particles are (thermally) stable molecules, a variety of radicals are generally also formed in a plasma. While their densities are often much lower than those of the parent molecules, their reactivity is much higher. For instance, many molecules show a barrier to adsorption on a surface; in contrast, radicals often do not show this barrier, thanks to their dangling bond(s), resulting in sticking coefficients close to 1. The corresponding energy plot is shown in figure 3(b). As discussed in section 2.3 below, this may also lead to plasma–catalyst synergy.
Therefore, all of these elementary phenomena (charging, electric fields, vibrational and electronic excitation of reactants, as well as radicals) may lead to a change in the overall process with respect to a thermal process, and possibly lead to plasma–catalyst synergy. In the following section, we describe this synergy.
2.3. Plasma–catalyst synergy
One of the main reasons why plasma catalysis continues to attract much interest is the so-called plasma–catalyst synergy. Synergy means that the combination of plasma with the catalyst yields results better than the sum of the separate plasma process and the thermal catalytic process [5, 21, 22]. A typical example is shown in figure 4 for CO2 and CH4 conversion [6, 23]. The improved result in this context is typically the conversion of the reactants, e.g. CO2 and CH4, the yield of the desired product, such as ammonia, or the VOC degradation efficiency. If synergy is observed, the questions of the origins of this synergy and how it could be maximized then arise. If synergy is not observed, it could be asked how it could be induced so as to improve over the thermal process and/or the pure plasma process.

Figure 4. Typical example of synergy in plasma catalysis: the conversion in the plasma–catalytic setup is larger than the sum of the conversions in the pure plasma and pure catalytic setups. Reproduced from [6]. CC BY 3.0.
Download figure:
Standard image High-resolution imageTo answer these questions, let us revisit the distinct advantages of plasma catalysis over conventional thermochemical approaches. The far-from-equilibrium state of technological plasmas at relatively low temperatures, typically in the range 300–1000 K, allows thermodynamically unfavourable conversions to occur under relatively mild conditions [6]. Also, it has been claimed that plasma catalysis can be used to overcome the omnipresent scaling relations in thermal catalysis [11], which normally impose strong limitations on the maximum achievable rate of many catalytic processes. Indeed, traditional catalysis research has been dominated by structure-activity relations, which imply that optimization of a catalytic process is a matter of finding the 'right' catalysts or engineering the perfect active site [24]. In contrast, plasma–catalyst interaction might allow tuning of the surface chemistry beyond structure-property relations, thanks to the strong synergies that can arise at the interface [5–7].
As mentioned above, synergy is not always observed in plasma catalysis. Indeed, while several groups have reported that plasma catalysis achieves higher yields or efficiencies than either pure plasma or pure catalytic processes [23, 25, 26], there are just as many studies that find little evidence of synergy [27, 28]. Similarly, the precise respective roles of catalyst and plasma, and the nature of their cross-interaction, are currently quite controversial: for example, of two recent studies of plasma–catalytic NH3 synthesis, one claims that the process is dominated by reactions at the catalyst surface [12], while in a different setup the catalyst is assumed to merely act as a surface on which plasma-generated species can recombine [29].
The origin of the apparent discrepancy lies essentially in the contribution of plasma-induced processes (either in the plasma phase or at the catalyst surface) to the overall process. For instance, Rouwenhorst et al demonstrated that the plasma induces vibrational excitation of the prime reactant, N2, the dissociation of which is the rate-limiting step of the process. As a result, synergy was observed: the catalyst still acts as a catalyst in effectively rupturing the N–N and H–H bonds and in bringing the N and H atoms together, while the plasma ensures that the N–N bond rupture requires less energy than in thermal catalysis. If, on the other hand, the electron energy were too high or too low, such that the plasma could not (efficiently) excite the vibrational levels of the N2 molecules, synergy would be unlikely to be observed in this particular process although it is still a plasma–catalytic setup.
Moreover, in general, not only vibrational excitation will be operative, but also other plasma-induced effects, as discussed above. It is thus clear that at least a basic understanding of all the possible interactions between plasma and catalyst is required. Moreover, also an understanding of how these interactions affect each other is crucial to induce new or maximize existing synergies. At present, we indeed have a basic understanding of individual interactions, although little is currently known about their interplay. We, therefore, have to conclude that it is currently impossible to design an optimal plasma–catalytic process systematically.
Below we list the various features known to have the potential to induce a synergistic effect. Note, however, that none of them guarantees a synergy.
2.3.1. Surface charge
As mentioned above in section 2.2, all surfaces exposed to a plasma naturally acquire a negative surface charge. This charge effectively changes the electronic structure of the surface, and thus also the electronic structure of the catalyst. As the catalytic action of a material is ultimately determined by its electronic structure [30], it is thus not unlikely that the catalytic efficiency of any given material would be different in a thermal catalytic setup and a plasma–catalytic setup.
Moreover, charging is a reversible process that does not directly change the morphology, structure or other physical properties of the catalyst. In a study by Kim et al [26], the synergistic effect was also found to be reversible, and surface charging could indeed be responsible for the experimental observations. However, there are currently no direct experimental works validating or falsifying this hypothesis. Recent atomistic simulations (discussed in section 3.1), however, clearly demonstrate the potential of surface charge to significantly alter the catalytic process and thus induce a synergetic effect [31].
Also, the importance of charge in determining the efficiency or yield of a plasma–catalytic process should depend on the magnitude of the charging, or more precisely, on the surface charge density, and on the distribution of that charge density. Peeters et al estimated the plasma-induced surface electron density on alumina to be of the order of 1015–1017 m−2 in their atmospheric-pressure dielectric barrier discharge (DBD) [32], in agreement with direct measurement of surface charges on dielectric targets exposed to ionization waves obtained by 'Pockels effect' based techniques (see section 4.3.1). While such significant charge densities can be expected to have at least some effect on the catalytic behaviour, it remains to be conclusively demonstrated that surface charge can be a dominant factor in inducing plasma–catalytic synergy.
2.3.2. Nature of the reactants
2.3.2.1. Excited species.
In the above (section 2.1), we already described the theoretical (and conceptual) study of Mehta et al and the experimental study of Rouwenhorst et al on the importance of a specific plasma-induced phenomenon—in this particular case vibrationally excited species, but it could in principle also be e.g. electronic excitation—in inducing a possible synergy in plasma catalysis. Similarly, it has been shown before that vibrational excitation of CH4 can lead to a three-order of magnitude higher adsorption probability on a Ni surface compared to CH4 in its vibrational ground state [33]. Moreover, it has also been shown that the crucial parameter is actually the precise vibrational mode which is excited. In the case of methane, the ν3 stretch mode was found to be more effective in enhancing the adsorption than the ν4 bending mode [34]. On the other hand, simulation studies combining molecular dynamics (MD), free energy methods and machine learning techniques demonstrated that at temperatures relevant to plasma catalysis, the importance of vibrational excitation on catalytic CH4 dissociation may be limited [35]. In section 5.2.3, however, we shall also discuss how vibrational excitation of CH4 in dry reforming of methane may be important.
2.3.2.2. Radicals.
In contrast to thermal systems operating at typical catalysis temperatures, plasmas often generate a wealth of radical species initiated through electron-impact dissociation reactions and subsequent gas-phase reactions. As radicals are characterized by one or more dangling bonds, they are extremely reactive. Therefore, their sticking probability on any surface can often be expected to be close to one, although this is not always the case—H, for instance, shows a sticking coefficient of a few 10% at most. This effect has two immediate consequences, both of which may affect the catalytic process: (1) if key reactants are generated through dissociation in the plasma, there is less or no need for the dissociative adsorption of their parent molecules on the catalyst surface for subsequent Langmuir–Hinshelwood (L–H) reactions; (2) the presence of radicals may also increase the contribution of Eley–Rideal (E–R) reactions. An additional effect of radicals is that they may contribute to catalyst re-activation, by removal of poisoning species (see section 2.3.4).
These consequences, however, are only likely to be of importance if the plasma can effectively couple the input power into the dissociation channel of the key reactants. Moreover, the density of these radicals must be high enough to allow for the radicals to play a significant role. The criterion for this process to become on par with the thermal catalytic mechanism is then that the ratio of radical-to-molecule adsorption probability per impinging particle is equal to or higher than the molecule-to-radical density near the surface.
Very recently, a computational study by Engelmann et al [36] clearly demonstrated the effect of increasing fractions of radicals in plasma–catalytic NH3 synthesis. The authors show that E–R reactions indeed quickly become dominant if high enough densities are present, albeit under the assumption that E–R reactions present no enthalpic but only an entropic barrier to adsorption. Interestingly, their results show that in that case, the turnover frequency (TOF) becomes (nearly) independent of catalyst material. The calculated TOFs are in line with several experimental studies [37], indicating that E–R reactions might indeed be dominant in plasma catalysis, instead of the dissociative adsorption of vibrationally excited N2 molecules.
2.3.3. Photons, electrons and electric fields
Both electrons and electromagnetic fields are known to induce or modify chemical processes. Indeed, they are the root cause for the existence of technological plasmas in the first place. Also, at a surface, they may induce or modify reactions. Electron-induced desorption, either due to electron-impact induced thermal heating or by direct interaction of the electron with the bonding and antibonding orbitals, has been well-known for a long time [38]. A typical example relevant to plasma catalysis is the desorption of CO from a TiO2 surface through electron-impact induced CO2 dissociation. Additionally, electrons may also ionize surface-adsorbed species to form anions, which subsequently desorb from the surface [39].
Electric fields are also known to impact surface processes. This may be of particular importance on rough surfaces and when field lines concentrate near local surface irregularities. Although it is difficult to investigate this effect separately from other factors, and in particular from charges, a recent computational study (see section 3.1.2) indeed showed that the application of an electric field might change the adsorption energy of CO2 at a Cu surface [40]. Therefore, the existence of the electric field changes the thermodynamics of the process, which in turn may modify the plasma–catalytic process relative to the thermal-catalytic process if the effect is sufficiently large.
Finally, while photons have been considered to be of possible importance in contributing to a synergetic effect, in particular when using photocatalytic materials as the catalyst, there is at present no clear evidence supporting this.
2.3.4. Plasma-modification, activation and regeneration of the catalyst
Any (heterogeneous) catalytic process requires the adsorption and desorption of reactants and products on and from the catalyst surface. If the plasma, therefore, changes the surface morphology, structure, or any of its other physical or electronic properties, the catalytic process is likely to be influenced. Such catalyst modifications are indeed quite often observed in plasma–catalytic setups. Stere et al [41] provided a nice example of plasma modification of catalyst activity. They observed that the Ag/Al2O3 catalyst in their atmospheric-pressure DBD was active towards NOx reduction at temperatures at which the catalyst should be inactive in a thermal-catalytic setup. This, therefore, clearly demonstrates a synergistic plasma–catalytic effect.
In situ catalyst regeneration was reviewed recently by Lee et al [42]. In particular, two direct pathways to in situ catalyst regeneration are reduction of (partially) oxidized catalyst material to the metallic structure and the removal of carbon deposit to de-passivate the catalyst.
Of course, one could argue that plasma-induced catalyst modification, activation or regeneration is not a fundamental process but rather the convoluted result of possibly many, more elementary, plasma–surface interactions, ultimately leading to the observed catalyst activity. Regardless, if such plasma-induced catalyst modification may be controlled or tuned, it does provide a reliable means to induce or enhance synergy in plasma catalysis.
Another effect that may be important in plasma catalysis, is catalyst heating. Indeed, the catalyst temperature determines its 'thermal' activity, and also determines the rate of many elementary processes such as surface diffusion and desorption. Moreover, spatially and temporally localized heating of the catalyst surface may affect the surface processes. This catalyst heating, however, is again rather a net result of a variety of surface processes rather than a separate fundamental process. For a more thorough discussion in the context of plasma catalysis, we refer the reader to [43].
2.3.5. Microdischarge in mesoscopic pores of the catalyst
Finally, highly reactive plasma-generated species such as radicals may be stabilized on the inner surfaces of voids in the catalyst material [44]. This, in turn, leads to increased surface retention times and, therefore, to possible higher catalyst activity. Below a certain limit, defined by the Debye length, the discharge cannot penetrate into the pores, as discussed in more detail in section 3.3 below. Larger pore sizes, however, can have a distinct effect on the plasma chemistry [45].
Similar to the plasma modification and activation of a catalyst, the occurrence of microdischarges in the pores of a catalyst is not in itself a truly fundamental plasma–surface interaction but may effectively contribute to the overall plasma–catalytic process.
3. Multi-scale modelling
3.1. Atomic-scale at the catalyst surface
The overall coupling between the plasma nonequilibrium and gas-phase plasma-induced chemistry can be studied in kinetic models, as will be described in section 3.2. Such models are based on a mixture of empirical data and simplified models to describe the interaction of electrons and excited species with other molecules, see, e.g. [46]. However, no such extensive information, be it experimental or theoretical, is available for much of the specific plasma-induced chemistry that arises at the catalyst–plasma interface. Within the realm of plasma-based materials processing, the effects of plasma-derived radicals and ions are quite well-studied [47], but the role of many of the more physically complicated effects remain largely unknown. To understand such effects, a more detail-oriented approach is needed.
Indeed, understanding the mechanisms underpinning plasma catalysis in any of its many incarnations relies on a thorough understanding of the various interactions between the plasma and the catalyst surface. By their very nature, these interactions are operative on a molecular scale. It is only the final convolution of these interactions that eventually yields the typical macroscopic observations such as reactant conversion or energy efficiency.
Modelling is in that perspective a tool par excellence to study these interactions: models can be constructed as needed so as to shed light on particular aspects, leaving other aspects as parameters. This stands in stark contrast to experiments, which by necessity always encompass all processes that effectively take place. Modelling therefore allows one to unravel the mechanisms of individual processes; its main challenge is essentially how to couple all of these different aspects. In other words, atomic scale modelling may be well suited to provide information on individual parts, but not necessarily on the whole. In a sense, this is the opposite of the main challenge of experiments, which are well suited to yield information on the whole, but not on the individual parts.
As a result, there is—at least at present—an inevitable gap between atomic-scale models and experiments. This gap, however, can be filled with larger-scale modelling studies, as described in sections 3.2 to 3.5. We shall now describe some essential features of atomic-scale modelling, and subsequently highlight our current understanding on plasma–catalyst interactions coming from recent atomistic simulation studies, focusing on surface charging and vibrational excitation.
3.1.1. Density functional theory and classical atomistic approaches to simulating molecule–surface interactions
Atomic-scale simulations provide a representation of the system to be studied with atomistic resolution. A variety of techniques exist to gain information from this atomic-scale representation: static calculations may optimize the critical points (energy minima and barriers) in a process, MD simulations provide the trajectories of the atoms through space and time, and enhanced sampling techniques, such as metadynamics or replica exchange MD, allow the calculation of free energy profiles along the (often reduced) reaction coordinate.
The critical factor in all of such calculations is how the interactions, viz the energies and forces, between the atoms, molecules and surface, are accounted for. These interactions can either be described classically or quantum mechanically.
In the classical approach, a so-called force field is constructed that yields the potential energy of the system as a function of the positions of the atoms. Forces between the atoms are obtained as the negative gradient of the potential energy function. The complexity of such force fields may vary from very simple, such as the Lennard-Jones potentials, to much more complex, such as the Reax family of force fields. In general, fairly complex expressions are needed to enable the force field to accurately represent the near-infinite number of possible atomic configurations and the corresponding energies and thus yield sensible chemistry. The main advantage of this approach is that it does not require the solution of the electronic structure problem and is therefore computationally fast.
Alternatively, one may resort to a quantum-based approach to attain a higher level of accuracy. This, of course, comes at the price of a higher computational cost. In quantum-based simulations, the electronic structure of the system is solved, subject to a number of assumptions and approximations. Due to its computational efficiency, the approach taken in the (plasma) catalysis community is invariably so-called density functional theory (DFT) calculations, in which all physical and chemical properties of the system are derived from the electron density instead of from the much more complex electronic wavefunction. The most important choice to make in any DFT calculation is, in essence, the same as in classical simulations: how to represent the energy? In DFT, the energy is expressed as a functional of the electron density, which itself is a function of space. As a rule of thumb, the higher the level of theory of the functional, the more accurate the calculation will be, but also the higher the computational cost will be.
If one wishes to calculate atomic trajectories, the equations of motion need to be integrated, requiring a discretization of time. To maintain a stable trajectory for this time integration, the time step must be sufficiently small, typically of the order of a femtosecond. The simulated period is inevitably very short—at most of the order of microseconds in the case of classical force fields, and of the order of nanoseconds in the case of DFT-based MD, depending, of course, on the system size and complexity of the force description (classical force field or DFT energy functional). Still, as the atomic connectivity may be reevaluated at each step, this indeed allows the study of the actual dynamic trajectories in a chemical reaction. Importantly, if the force field or functional is indeed suitable for the process to be studied, no assumptions regarding possible mechanisms need in principle to be made.
The main limitation of MD simulations is the very short time scale that can be accessed in the simulation. Indeed, thermal processes typically occur on μs—ms timescales, which is beyond the reach of atomistic simulations. Solutions to the time scale problem exist, viz accelerated MD, such as, e.g. temperature accelerated dynamics [48] or collective variable-driven hyperdynamics [49]. Alternatively, enhanced sampling of the free energy profile of a process may be both more efficient and yield more information. An example of this approach is presented in section 3.1.2.2 below.
Besides explicitly and deterministically calculating atomic trajectories, it is also possible to follow the system evolution stochastically, based on a set of probabilities for transitions between states, in a so-called kinetic Monte Carlo approach. Various implementations exist and were evaluated in the context of plasma catalysis by Marinov and Guerra [50, 51]. A major advantage of these models is that the coupling between the surface chemistry and gas-phase chemistry is relatively straightforward. The timescale that can be handled is the nanoseconds-to-minutes range, while the calculations are still very fast compared to MD simulations. A major disadvantage is that the simulations require a list of possible species as well as events that can take place, with appropriate rate coefficients. This limits what can (and cannot) happen in the simulation. So far, the application of this type of modelling to plasma catalysis has been limited.
3.1.2. Simulation of plasma–surface interactions
In contrast to the extensive body of computational (mainly DFT) studies of thermal catalysis, the number of works on plasma catalysis using atomic-scale simulations remains very limited. This is partly due to the computational cost of (reliable) DFT calculations and the unpredictable suitability of force fields, which are generally not optimized for plasma–catalytic processes. An additional reason is the non-existence of methodologies capable of modelling certain aspects of plasma catalysis, such as surface charging. Only recently have methods been developed that allow such aspects of plasma–catalyst interactions to be described.
Moreover, the stochastic nature of many surface processes, such as simple surface diffusion required for L–H kinetics, leads to an exponential distribution in reaction times. To dynamically simulate surface reactions thus seems a near-impossible task, which is further complicated by the wide range of flux ratios of species reaching the surface. For instance, for every ion reaching the surface, perhaps 106 neutrals would need to be accounted for. It is clear that this cannot be accomplished in a single dynamic simulation effort.
Instead, atomic-scale simulations typically approach the problem by one of two options. The first option is to statically calculate system properties of interest, such as, e.g. the reaction energy as a function of the progress of a reaction. This can be accomplished using sampling techniques such as metadynamics or alternatively by barrier finding techniques such as nudged elastic band calculations. This information can subsequently be used as input in, e.g. microkinetic models as described in section 3.2. The second option is to dynamically simulate reactions focusing on, e.g. a single reaction or a single parameter such as surface charge.
In the remainder of section 3.1.2, we shall describe what is currently known from atomistic calculations about fundamental factors of influence specific to plasma catalysis, viz surface charge, electric fields and vibrational excitation.
3.1.2.1. Surface charge and electric fields.
As discussed above (sections 2.2 and 2.3.1), a solid in contact with plasma accumulates a negative surface charge due to the influx of free electrons. Excess surface electrons can reach densities of the order of 1017 m−2 and may remain trapped for long times, up to days [32, 52]. Since excess charge at the surface may modify the electronic structure of the material, capturing charge-induced changes in surface reactions requires a quantum chemical approach. Bal et al developed a DFT-based technique to add charges to a periodic surface slab [31]. Divergence of the energy is avoided by inserting a counter charge in the gas phase above the charged slab. This setup effectively corresponds to a negatively charged surface with a positive space charge next to it. The surface charge density can be tuned by varying the lateral dimensions of the surface. Note that this approach is valid only for DFT-codes based on an atom-centred basis set (such as, e.g. CP2K), and would not be suitable for plane-wave based codes (such as, e.g. VASP).
Using this methodology, Bal et al investigated how charging a dielectric Al2O3 surface loaded with a single metal atom (Ti, Ni or Cu) as the catalyst would affect its chemical reactivity [31]. It was found that the metal atom adsorbed less strongly on the surface, with a decrease in adsorption energy of about 1 eV. This was explained by the charge-induced change in the support electron affinity: the metal was found to adsorb as an M2+ species, thus reducing the surface upon adsorption. Upon adding a negative surface charge, the support is already reduced and therefore becomes more resistant against further reduction by adsorption of the metal. This, in turn, leads to lowered adsorption energies.
When allowing CO2 to adsorb on the charged surface, Bal et al observed that the adsorption energy changes significantly, in particular on Ni and Cu: whereas the CO2 adsorption energy on the neutral Cu/Al2O3 surface is about 0.5 eV, it increases to about 1.5 eV on the charged surface. This adsorption energy is similar to that for CO2 adsorption on neutral Ni/Al2O3. This is shown in figure 5(a). Moreover, when CO2 was considered, it was found that the overall reaction energy was also significantly influenced by surface charge. In particular, CO2 dissociation was found to be much less endothermic on the charged surface, as shown in figure 5(b).
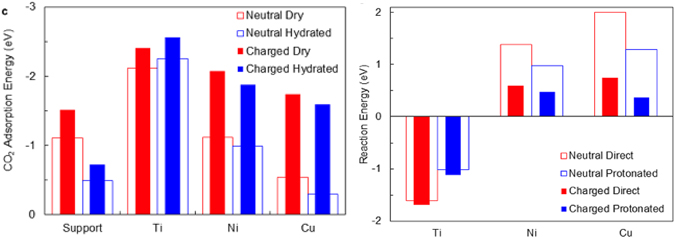
Figure 5. Effect of charging the adsorbent (bare dry and hydrated Al2O3 support, as well as Ti-atom, Ni-atom and Cu-atom adsorbed on the Al2O3 support) on (a) the CO2 adsorption energy and (b) the CO2 dissociation energy. Reproduced from [31]. © IOP Publishing Ltd. All rights reserved.
Download figure:
Standard image High-resolution imageThese observations can be rationalized by inspecting the partial density of states. Essentially, the M–CO2 bond is formed by the overlap of the metal d-orbitals with the CO2 antibonding π* orbitals. The resulting bonding states are lowered in energy relative to the neutral systems due to the increased overlap between the d-orbitals and the CO2 antibonding π* orbitals. This effectively strengthens the M–CO2 bond and weakens the C–O bonds in CO2. Thus, surface charging activates the CO2 molecule upon adsorption. From a chemical perspective, charging makes the surface more basic and thus more prone to react with the Lewis acid CO2. Similarly, and also using DFT calculations, Jafarzadeh et al found that adsorption energies of CO2 on TiO2-supported Ni5 and Cu5 catalyst clusters substantially increase upon charging, by up to 2 eV [53].
Large electric fields are also found in common plasma–catalytic setups [54], which can polarize the surface. The electronic and thus chemical properties of a catalyst can hence be significantly altered through plasma exposure without changing its actual chemical composition. Recently, Jafarzadeh developed the (as yet) only model specific to plasma catalysis, incorporating both charging and electric fields [40]. The authors investigated the effect of charge, electric fields and the combination of both on the adsorption and activation of CO2 on various Cu-surfaces. When only an electric field was applied, the partial charges on the adsorbed CO2 and the adsorption energy were predicted to increase. Concurrently, C–O bond lengths were observed to increase, thus activating the molecule towards dissociation. When combining the electric field with excess surface electrons, this effect is enhanced, leading to binding and reaction energies shifted by up to 1 eV. It was thus concluded that the presence of both surface charge and an electric field might be a key factor in enhancing CO2 conversion in plasma catalysis.
Whether or not this effect is indeed dominant, or at least can be dominant in plasma catalysis, remains to be validated. Indeed, the surface charges investigated in these studies (about 0.09 C m−2), as well as the values of the electric field strength (up to 250 V nm−1), are rather high. Regardless, simulations like these demonstrate the crucial importance of methodological developments in elucidating specific mechanisms operative in plasma catalysis.
3.1.2.2. Vibrational excitation.
As discussed in section 2, the presence of vibrationally excited molecules has also been presumed and, for some processes, demonstrated to be important in plasma catalysis [55]. Indeed, the average vibrational temperature of specific chemically active normal modes can be well above 1000 K in plasmas that are otherwise at room temperature [46]. The effect of vibrational excitation of gas-surface reactions is usually studied through explicit quasi-classical trajectory studies, which can only model molecular beams at fixed translational and vibrational energies.
However, such state-resolved molecular beams are a poor representation of the broad energy distributions found in a plasma. Moreover, these simulations are highly demanding and time-consuming: up to 106 trajectories have to be calculated for a single condition, which is only feasible when an efficient classical interatomic potential is parametrized for the system a priori and precludes more wide-ranging studies over several catalysts, reactions, or conditions. Nevertheless, a recent preliminary study used a simplified analytical model, the so-called Fridman–Macheret model (which was, however, untested for surface reactions) to include the effect of vibrational excitation in a kinetic model of catalytic NH3 synthesis. The model predicted a rate increase by up to five orders of magnitude and a shift in relative catalyst activities, analogous to the charging effects mentioned above [11].
Employing an ensemble-based approach to investigate the effect of vibrational non-equilibrium on chemical reactivity [56], Bal et al attempted to quantify the importance of this vibrational non-equilibrium on dissociative chemisorption of H2 and CH4 on Ni catalysts [35]. These authors found that vibrational excitation can indeed very efficiently lower the apparent free energy barrier to dissociation at the surface. The free energy barrier for dissociative chemisorption is shown in figure 6 for H2 and CH4 on Ni in figure 6.
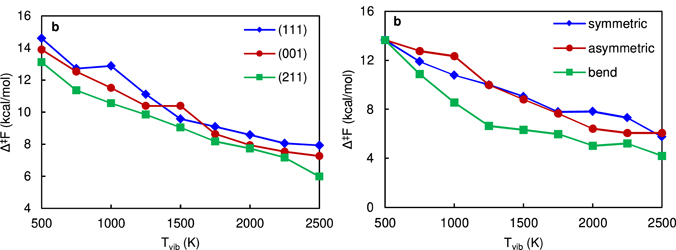
Figure 6. Lowering of the free energy barrier for dissociation as a function of the vibrational temperature for (a) H2 on different surface facets, and (b) CH4 for different vibrational modes. Reproduced from [35]. © IOP Publishing Ltd. All rights reserved.
Download figure:
Standard image High-resolution imageFurther, it is observed that the rate enhancement is not captured well by the Fridman–Macheret model and that an accurate assessment of the importance of vibrational excitation requires consideration of the vibrational temperature, the specific modes that are excited, the degeneracy of these modes, and the presence of steps and terraces, which also affects the impact of vibrational excitation. Although this study shows that significant rate enhancements can be expected at low temperatures, the lowering of the apparent free energy barrier is limited at more realistic temperatures (Tvib ∼ 1500 K), so the rate enhancement will also be limited. The authors, therefore, concluded that the potential impact of vibrationally excited CH4 on the overall catalytic process may be minor.
3.2. Zero-dimensional (0D) scale: chemical kinetics modelling
Zero-dimensional (0D) chemical kinetics models provide insight into chemical kinetics, both in the plasma and at the catalyst surface. They are based on the same general principles, i.e., solving continuity equations for the various species (either in the plasma or their surface coverages) based on production and loss rates, as defined by the chemical reactions. They can describe a detailed (plasma or surface) chemistry without too much computational effort. For plasma chemistry modelling, some codes are available within the plasma community, such as ZDPlasKin, developed by Pancheshnyi et al [57], GlobalKin, developed by Kushner and co-workers [58, 59], for which also a commercial application with a graphical user interface has been developed, Quantemol-P [60], and PLASIMO, which includes among others a global model, developed by van Dijk and co-workers [61]. Modelling the chemical reactions of plasma species with a catalyst surface has only recently begun to attract significant interest, and to our knowledge, codes are only being developed within individual research groups.
The characteristics of the models for either the plasma or surface chemistry will be explained in the following two sections, after which some examples will be given of what type of information they can provide.
3.2.1. Plasma chemistry modelling
The continuity equations for the species densities in 0D plasma chemistry models are written in their simplest form as:

with aij (1) and aij (2) the stoichiometric coefficients of species i, at the left and right-hand side of a reaction j, respectively, nl is the species density at the left-hand side of the reaction, and kj is the rate coefficient of reaction j.
The rate coefficients of chemical reactions between neutral species or ions are usually adopted from literature and are typically calculated from Arrhenius equations, expressing the dependence on gas temperature. The rate coefficients of electron impact reactions are usually obtained from energy-dependent cross-sections integrated over the EEDF. The latter is then calculated with a Boltzmann solver, which is commonly incorporated in plasma chemistry models.
Besides the species densities, the electron and gas temperatures can also be calculated from similar (energy-balance) equations, again based on production and loss terms, as defined by the power deposition or by the electric field, and by chemical reactions. For more details, we refer to an interesting tutorial review paper by Hurlbatt et al [62].
The balance equations yield the time-evolution of the species densities, electron and gas temperature, averaged over the plasma reactor volume; spatial variations due to transport in the plasma are typically not considered, although 1D fluid models describing detailed plasma chemistry and accounting for diffusion, migration and convection, have also been developed for plasma catalysis (gas-conversion) applications (e.g. [63]). In addition, several methods exist to account for spatial variations in 0D chemical kinetics models, for instance, the so-called hl factor, which describes the relationship between the central ion density and the ion density at the sheath edge; see details in [62]. Moreover, the effect of diffusion and losses due to chemical reactions at the catalytic surface is typically considered by an additional loss term in the balance equations [64].
Finally, spatial variations can also be accounted for by translating the time-variation of the balance equations into a spatial variation, i.e., as a function of distance travelled through the plasma reactor, based on the gas flow rate, hence considering the plasma reactor as a plug flow reactor. This also allows spatial variations of input parameters, such as applied power or gas temperature, to be considered. Note that this feature is particularly useful in accounting for the filamentary behaviour of a DBD, which is the reactor type primarily used in plasma catalysis, as illustrated for instance in [65, 66]. This method is computationally much more manageable than accounting for filament formation in 1D, 2D or 3D fluid models.
Typically about 100 different species, including the electrons, various types of molecules, radicals, ions and (electronically and vibrationally) excited species, are included in such plasma chemistry models, which react in (above) 1000 reactions. As shown by Hurlbatt et al [62], the number of chemical reactions to be considered typically rises more or less linearly with the number of species included.
The possibility of describing detailed plasma chemistry is the main advantage of this type of model, but at the same time also their main weakness, i.e., the need for accurate rate coefficients or cross-sections for all reactions. Indeed, the latter are subject to uncertainties, which limits the accuracy and predictive power of chemical kinetics models. Hence, there is a strong need for model validation. The effect of the uncertainties can be evaluated by Monte-Carlo simulations, which use a large number of combinations of rate coefficients randomly generated within their reported uncertainties, hence providing information on the uncertainty of the model output results attributable to the rate coefficients. This method was first developed by Turner for an He/O2 plasma [67–69] and later also illustrated for a CO2 plasma [70] and a CO2/CH4 mixture [71]. Although reliable rate coefficients and cross-sections are needed for all kinds of plasma models, this is especially true for chemical kinetics models, which focus precisely on studying complex chemistries.
Obviously, the more reactions included in such models, the more complicated it is to evaluate the model uncertainty. Hence, while it is tempting to include all possible reactions for all species, this complexity may also limit the predictive power. Turner [67, 68] demonstrated that reaction schemes could be drastically reduced, even up to 85%, without significantly affecting the output [68].
Plasma chemistry models are very popular for plasma catalysis applications because they can handle many different plasma species and chemical reactions. Some examples for CO2 splitting, CH4 conversion, as well as for CO2/CH4, CO2/H2, CO2/N2, CO2/H2O, CH4/O2 and N2/H2, and their combinations can be found in, e.g. [72–77].
3.2.2. Plasma–surface chemistry modelling
Surface kinetics models solve the continuity equations for the fractional coverage of all surface species as a function of time, again based on production and loss terms:

where θx is the fractional coverage of species x, cx,i is the stoichiometric coefficient of this species in the production and loss reactions i and ri are the rates of the corresponding reactions. These rates are calculated as the difference between the rates of the forward and reverse reactions:

where ki,f and ki,r are the rate constants of the forward and reverse reactions, respectively, and axf and axr are the activities of the reactant species xf and the product species xr , respectively. The activities are assumed equal to the fractional coverages for surface species and to the partial pressures (in bar) for gas-phase species. While in plasma chemistry models, the rate coefficients are typically adopted from literature (or databases), in surface chemistry models, the rate constants are usually calculated from transition state theory:
where kB is the Boltzmann constant, T is the temperature, h is Planck's constant, R is the ideal gas constant and ΔG‡, ΔH‡ and ΔS‡ are the Gibbs free energy, enthalpy and entropy of activation, respectively. The latter are typically obtained by DFT calculations, and are also available for many catalyst materials in databases, such as the CatApp database [78].
By solving the differential equations to steady-state  for all species, and inserting the steady-state coverages back into the rate equations, the steady-state reaction rates can be obtained, which provide the product formation TOFs, a common term in catalysis. More information about such models can be found in [79].
3.2.3. Some illustrations in plasma catalysis
Chemical kinetics models are very useful for chemical reaction pathway analysis, to study the most important production and loss processes for various species, both in the plasma and at the catalyst surface. In this way, they can pinpoint limitations for the production of some species, and thus also propose solutions on how to overcome these limitations.
Hong et al developed a chemical kinetics model for NH3 synthesis by plasma catalysis, accounting for surface reactions at the catalyst surface [64]. The loss and production rates due to the surface reactions were included as additional loss or source terms, consisting of the rate coefficients multiplied by the free surface site density. The model revealed that the surface-adsorbed N atoms, N(s), were mainly formed by dissociative adsorption of ground-state N2 molecules, as well as by N2 molecules in the first vibrational level, and by direct adsorption of N atoms. H(s) were also mainly formed by dissociative adsorption from ground-state H2 molecules, but also by direct adsorption of H atoms, while dissociative adsorption from vibrationally excited H2 molecules seemed less important. In addition, the rate of H(s) formation was calculated to be four orders of magnitude higher than the rate of N(s) formation. The model did not only account for stepwise hydrogenation on the surface, which is the dominant pathway in conventional catalysis, but also for reactions between plasma radicals and surface-adsorbed species, i.e., E–R reactions, and the E–R reaction of NH2 radicals with H(s) was indeed reported to be more important for the NH3 synthesis [64].
van't Veer et al developed a similar model for plasma–catalytic NH3 synthesis, again for a simple catalyst metal and paying most attention to the plasma chemistry [80]. This model focused on the role of the filamentary microdischarges (FMs) and their afterglows, typical of DBD plasmas. The model revealed that most of the NH3 production occurs in the afterglows, while during the microdischarges, the NH3 is actually decomposed upon electron impact dissociation. However, during the microdischarges, electron-impact dissociation of N2 and H2 also creates N and H atoms, which form NH radicals. These species adsorb onto the surface and are subject to hydrogenation, leading to the formation and desorption of NH3.
Electron-impact dissociation of N2 followed by adsorption of N atoms was identified as the rate-limiting step, rather than dissociative adsorption of N2 at the catalyst surface, like in thermal catalysis. In addition, despite the fact that vibrational excitation is stated to be of minor importance in DBD plasmas, electron-impact dissociation from vibrationally excited N2 levels was predicted to contribute ca. 8% to the overall N2 dissociation in the plasma. The larger this contribution, the more energy-efficient the overall NH3 synthesis, as the required dissociation energy is reduced by vibrational excitation. Overall, just like the model of Hong et al, this model revealed that both E–R and L–H reactions play a role in plasma–catalytic NH3 synthesis. The pathways predicted by the model during the microdischarges (a) and subsequent afterglows (b) are illustrated in figure 7.

Figure 7. Reaction pathways predicted by plasma and surface chemical kinetics modelling, leading to NH3 synthesis in a DBD plasma with catalyst, during the microdischarges (a) and their afterglows (b). E–R and L–H reaction steps are drawn with red and blue arrows, respectively. (a) During the micro-discharges, reactive species are created by electron-impact collisions with the feed gas, and they react further to form NH3, but at the same time, NH3 is also destroyed by electron-impact collisions. (b) In the subsequent afterglows, the reactive species created during the microdischarges react further to form NH3 via several E–R and L–H reactions. Reprinted with permission from [80]. Copyright (2020) American Chemical Society.
Download figure:
Standard image High-resolution imageMehta et al developed a more detailed surface microkinetics model for plasma–catalytic NH3 synthesis, but without a plasma chemistry model, thus not accounting for plasma radicals and only considering vibrational excitation [11]. They reported that vibrationally excited N2, as produced by the plasma, can drastically enhance the NH3 synthesis rates on catalyst materials that are kinetically limited by N2 dissociation, and thus, that the optimal catalytic material in plasma catalysis would be different from thermal conditions [11]. In addition, the model revealed that due to the non-thermal plasma excitation, the NH3 yields could exceed equilibrium limits [81]. Engelmann et al studied the impact of different vibrational distribution functions on the catalytic dissociation of N2 and the subsequent production of NH3, and also included radical reactions, to illustrate the contribution of these species and their corresponding reaction pathways. Their model was applied to a large range of catalyst materials and revealed that when radical adsorption and E–R reactions determine the reaction pathways, the NH3 synthesis becomes virtually independent of the catalyst material [36]. These model predictions are confirmed by various experimental data [37], indicating that in most common (DBD) plasma–catalytic conditions, radical adsorption and E–R reactions indeed dictate the plasma–catalytic NH3 synthesis mechanisms.
Engelmann et al [82] also developed a similar surface microkinetics model for plasma–catalytic non-oxidative coupling of CH4 for a range of different metal catalyst surfaces, and the overall conclusion was that the optimal catalyst material depends on (i) the desired products and (ii) the plasma conditions. Indeed, plasma conditions that favour vibrational excitation of CH4 could significantly enhance C2H4 formation on most catalysts, like Pt, Rh, Pd and Cu, while C2H6 formation was promoted on the more noble catalysts, like Ag. On the other hand, plasma conditions that give rise to many radicals, such as CH3, CH2, C2H5 and C2H3, cause a high selectivity towards C2H4 on all catalysts, hence including noble catalysts as well [82].
Finally, microkinetics models were also developed for plasma–catalytic CO2 hydrogenation into CH3OH [83] and oxidative coupling of CH4 [84]. Plasma-generated radicals and intermediates were found to increase the calculated CH3OH production rate by 6–7 orders of magnitude compared to thermal catalysis on a Cu(111) surface, showing the potential of plasma–catalytic CO2 hydrogenation into CH3OH [83]. Also, in the case of plasma–catalytic oxidative coupling of CH4, the plasma-generated radicals and intermediates largely enhance the oxygenated product yields [84]. In addition, the model revealed the role of individual radicals in the surface processes, as summarized in figure 8.
- Strongly dehydrogenated carbonaceous species (CHCH, CH, C) strongly induce coking, and their formation should be avoided.
- O radicals counteract coking, so their partial pressure should be tuned against that of the carbonaceous radicals, but they also lead to deep oxidation to CO2.
- The more hydrogenated carbonaceous radicals (CH3, CH2) are in general beneficial, as they bind less strongly to the catalyst and lead to H* formation on the surface, yet they also cause coking at high partial pressures.
- H radicals appear beneficial by promoting hydrogenation of CH3O* and HCOO*, yielding CH3OH and HCOOH, respectively. Moreover, high H partial pressures can potentially form more free surface sites by removing excess O* via H2O formation.
- CH3O and CH3OO radicals are important precursors to both CH3OH and CH2O. Increasing their partial pressures thus also strongly enhances CH3OH and CH2O formation.
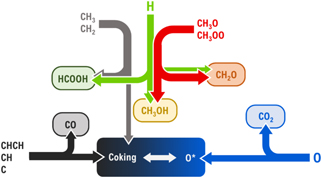
Figure 8. Schematic overview of the influence of various plasma species on the formation of oxygenates and COx in the plasma–catalytic partial oxidation of CH4 on Pt(111). Reprinted with permission from [84]. Copyright (2021) American Chemical Society.
Download figure:
Standard image High-resolution imageIn general, these chemical kinetics models can reveal how various plasma species affect the catalyst surface chemistry. This can guide alterations of the plasma composition to improve the formation of desired products.
3.3. Micro-scale: behaviour of plasma (species) inside catalyst pores
An important question in plasma catalysis is whether plasma (streamers) can penetrate into catalyst pores and what is the minimum pore size needed for this. To answer this question, both fluid modelling and particle-in-cell-Monte-Carlo collision (PIC-MCC) simulations have been carried out, as will be briefly explained in the remainder of this section.
3.3.1. Fluid modelling
A fluid model is based on solving conservation equations for the densities of the various plasma species, similar to equation (1) in section 3.2.1 above, but in addition also account for spatial gradients. Moreover, transport of the species is described by migration in the electric field (for the charged species), diffusion due to concentration gradients, and convection. In addition, Poisson's equation is usually solved, for a self-consistent calculation of the electric field distribution, based on the charged species densities. Finally, gas heating can be calculated by a heat transfer model, and the gas flow dynamics by the Navier–Stokes equations, although static gas conditions are also often assumed, depending on the application and the research question under study.
Zhang et al developed a 2D fluid model to study the plasma behaviour in inter-particle macro (10–400 μm) pores for a DBD plasma operating in a homogeneous mode in helium [85, 86]. The model revealed that the plasma species can only be generated inside pores with diameter ⩾30 μm. This can be correlated with the Debye length, which is in this order for the typical conditions of a helium plasma in glow discharge mode (i.e., electron temperature and density of 3 eV and 1017 m−3).
In general, modelling predicted that plasma formation inside pores occurs more easily at larger pore size and applied voltage [85], which was also observed experimentally [87, 88]. In addition, the dielectric constant of the catalyst support also plays a role [86]. Modelling revealed that for small dielectric constants, ionization inside the pores appears to occur more easily. The reason is that for large dielectric constants, the polarization of the left sidewall of the pore counteracts that of the right sidewall, reducing the net electric field, and thus the electron temperature and electron-impact ionization inside the pore are lower. To our knowledge, no experiments have investigated the plasma behaviour inside catalyst pores with different dielectric constants. Hence, these model predictions still have to be validated by experiments, but they suggest that the most common catalyst supports, i.e., Al2O3 and SiO2, with dielectric constants around 8–11 and 4, respectively, can more easily promote plasma formation inside catalyst pores than, e.g. ferroelectric materials with dielectric constants above 300. Finally, also the pore shape determines how easily plasma can be formed inside catalyst pores because it greatly affects the electric field enhancement. Indeed, modelling predicted that the electric field is significantly enhanced near tip-like structures, which affects the electron-impact ionization and thus plasma formation [89].
3.3.2. Particle-in-cell—Monte Carlo collision modelling
While μm-sized pore sizes are of interest for structured catalysts, catalytic supports typically have pores in the nm range. Fluid modelling, however, cannot be applied to nm-sized pores because the mesh size would be too small for a fluid description. To gain insight into whether plasma can penetrate into such small pores, PIC-MCC simulations must be applied. They are based on calculating the trajectory of a large number of individual particles (so-called super-particles, typically various types of ions, and the electrons) using Newton's laws, while the collisions of these super-particles are treated with random numbers, which are compared with the collision probabilities, defined by the collision cross-sections. The electric field distribution is calculated self-consistently from the positions of the charged super-particles. For this purpose, the positions of the super-particles are projected onto a grid to obtain a charge density distribution, from which the electric field distribution can be calculated with Poisson's equation.
Most applications of plasma catalysis use reactive gases, like air, CO2, hydrocarbons and their mixtures, rather than helium. The reactive gas plasmas are typically filamentary, and the plasma density inside the filaments can be much higher than in a homogeneous plasma in glow discharge mode. This can induce a much smaller Debye length and enable the plasma to penetrate into smaller catalyst pores.
Figure 9 illustrates the calculated electron number density profile inside pores with different diameters, obtained from PIC-MCC simulations in dry air, for an applied voltage of −8 kV [90]. The electron density inside the pore is negligible for a pore diameter of 400 nm, while it reaches a maximum inside pores with diameter of 600 nm and above. Hence, these PIC-MCC simulations predict that plasma streamer formation can occur in pores of 600 nm and above but not in smaller pores. This behaviour is again correlated with the Debye length, which is calculated to be 415 nm for this case (dry air, atmospheric pressure and applied voltage of −8 kV). In general, we can conclude that the Debye length is an important criterion for plasma streamer penetration into catalyst pores, i.e., plasma streamers can only penetrate into pores with diameter larger than the Debye length.
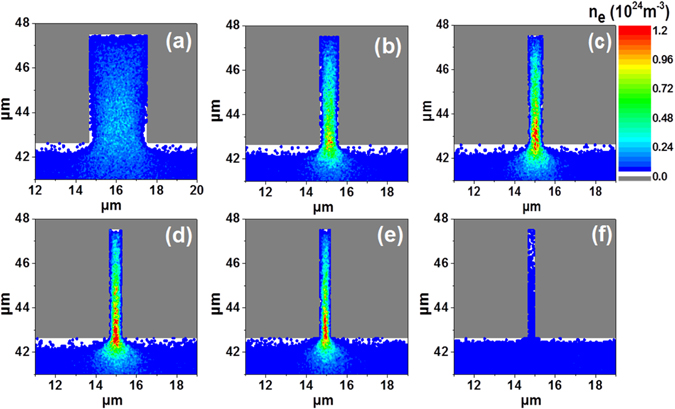
Figure 9. Calculated electron density profiles, near and inside a pore, with diameter of (a) 3 μm, (b) 1 μm, (c) 800 nm, (d) 700 nm, (e) 600 nm, (f) 400 nm, as obtained from PIC-MCC simulations in dry air, for an applied voltage of −8 kV. Reproduced from [90]. © IOP Publishing Ltd. All rights reserved.
Download figure:
Standard image High-resolution imageThe Debye length depends on the electron density and temperature in the plasma streamer, but it is typically in the order of a few 100 nm up to 1 μm at typical DBD conditions in air. Hence, this is the typical range of pore sizes in which plasma streamers can penetrate. This has consequences for plasma catalysis, as it determines the catalyst surface area exposed to plasma, and thus it will affect the plasma–catalytic performance. Note that catalytic supports (such as zeolites) typically have pores in the (few) nm range, which will thus not allow plasma streamer penetration inside the pores. In this case, however, plasma species might still be able to diffuse into the pores, depending on their lifetime. This diffusion process could be described by Monte-Carlo simulations, which could then also include detailed catalytic surface reactions, but to our knowledge, such modelling efforts have not yet been reported in the context of plasma catalysis.
Finally, PIC-MCC simulations also revealed that the dielectric constant of the support material plays an important role in the plasma streamer behaviour inside the pores, i.e., through surface charging, which determines the streamer penetration and discharge enhancement [52]. At small dielectric constants, surface charging causes the plasma to spread inside the pore, leading to somewhat deeper plasma streamer penetration than for larger dielectric constants, in line with the fluid model predictions discussed above.
3.4. Macro-scale: effect of catalytic packing on plasma behaviour
3.4.1. Fluid modelling
The catalyst (or catalytic packing) can affect the plasma behaviour in various ways. A catalytic packing in a packed-bed DBD reactor can cause local electric field enhancements at the contact points between the beads, and also change the discharge behaviour (from volumetric filaments to more surface discharges). This has been demonstrated by both experiments (see section 4 below) and modelling.
Modelling a packed bed DBD reactor is quite challenging because of the 3D geometry and the large number of mesh points needed to resolve the space near the contact points between the packing beads. In fact, modelling a packed bed DBD reactor in 3D is not yet feasible within a realistic calculation time. Instead, Van Laer and Bogaerts developed two complementary axisymmetric 2D fluid models to approximate the 3D geometry, i.e., a so-called 'contact point' model and a 'channel of voids' model [54]. The combination of both models can account for the two important features of a packed-bed DBD reactor, i.e., (i) the contact between the beads, yielding local electric field enhancement due to polarization effects, and (ii) the fact that the voids between the beads are connected, allowing the gas to travel from one side of the discharge gap to the other [54].
Fluid modelling for a helium DBD plasma revealed that at low applied voltage, the plasma is confined to the contact points, reflecting the properties of a Townsend discharge, while at higher applied voltage, more typical of a DBD, the discharge spreads out more into the bulk of the reactor, from one void space to the other [54], in qualitative agreement with intensified charge-coupled device (ICCD) camera experiments [91–93].
The dielectric constant of the packing beads also affects the plasma behaviour [94]: a larger dielectric constant leads to a more pronounced electric field enhancement, and thus also higher electron temperature, but only up to a certain value, while the electron density drops, due to a change in discharge behaviour. Indeed, as the dielectric constant increases, the plasma can no longer travel through the channels between the voids, and the electrons (and ions) are more easily absorbed at the walls and the surface of the packing beads. A similar effect was obtained for smaller packing beads, where modelling also predicted a lower electron density due to electron losses at the surface of the beads, as well as more pronounced electric field enhancements, due to the many contact points [95].
Streamer propagation in a packed bed DBD reactor has also been described by 2D fluid models [96, 97]. In this case, air plasmas were modelled as they exhibit filamentary characteristics. The models predicted that the dielectric constant of the packing beads dictates whether FMs or surface discharges are formed [97]. Indeed, at small dielectric constants (e.g. ε = 5, characteristic for SiO2), plasma ignition between the beads occurs as surface discharges or surface ionization waves (SIWs), created due to electric field components parallel to the dielectric surfaces, resulting from surface charging. These SIWs can then connect with the surface of adjacent beads. In contrast, at large dielectric constants (e.g. ε = 1000, characteristic for ferroelectric materials, such as BaTiO3), modelling predicted localized FMs between the contact points of the beads, while at intermediate dielectric constants, a mix of local filamentary and surface discharges was predicted, in good qualitative agreement with ICCD measurements [97].
Note that the localized FMs between the beads may limit the catalyst activation due to the limited catalyst surface area in contact with the plasma. This may have implications for the efficiency of plasma catalysis. Indeed, although modelling predicted the most pronounced local electric field enhancement at large dielectric constants [94], at the same time, the catalyst surface area in contact with the plasma is more limited due to the localized discharges. Depending on the relative importance of both effects, packing materials with a large or small or intermediate dielectric constant will perform the best in plasma catalysis, as indeed demonstrated in experiments (e.g. [98, 99]).
3.4.2. Particle-in-cell-Monte Carlo collision modelling
Plasma streamer propagation through packed-bed DBD reactors in dry air was also described by PIC-MCC simulations [100, 101], revealing similar trends as the fluid models above. Furthermore, more sophisticated packing structures, such as honeycomb packing and three-dimensional fibre deposition (3DFD) structures, were also simulated [102]. The calculations revealed how the plasma streamer propagates along the dielectric surface, yielding a surface discharge, and that it is limited to one channel. In other words, the streamers in different channels of a honeycomb-structured catalyst are completely separated. As a consequence, when the honeycomb channels are parallel to the electrodes, the discharge is much weaker than when the channels are perpendicular to the electrodes. In the latter case, the plasma streamer can develop over a much longer distance, yielding the production of more reactive plasma species by electron-impact reactions. This may explain why in plasma catalysis applications, the channels of honeycomb-structured catalysts are mostly perpendicular to the electrodes (see, e.g. [87, 103].
In contrast to the separate channels of a honeycomb-structured catalyst, when using a so-called 3DFD structure, the plasma streamers can freely distribute into different channels, causing discharge enhancement due to surface charging on the dielectric walls of the structured catalyst. This gives rise to a broad plasma distribution, which is not limited to one channel, as was the case for the honeycomb structure. This is illustrated in figure 10 for the plasma streamer propagation in a so-called 1-3-5 stacking architecture, as obtained from PIC-MCC simulations [102]. This broader plasma distribution could be beneficial for plasma catalysis, because a larger catalyst surface area will be exposed to the plasma.

Figure 10. Calculated electron number density profile, at three different times, illustrating the evolution of a plasma streamer in a DBD reactor in dry air, with so-called 3DFD 1-3-5 stacking architecture, as obtained from PIC-MCC simulations. The red spot indicates where the streamer is initiated. The dielectric plates covering the electrodes are depicted in dark grey, while the fibres of the 3DFD structure are light grey. The figure shows that the streamers can distribute to different channels, yielding a broad plasma distribution. Reproduced from [102]. © IOP Publishing Ltd. All rights reserved.
Download figure:
Standard image High-resolution imageNote that the examples and models in this section all apply to packed-bed DBD reactors (or other, more sophisticated packing geometries in DBD reactors). This is the most common geometry for plasma catalysis due to the easy incorporation of the catalyst inside the plasma. Moreover, packed bed DBDs allow intimate coupling between plasma and catalyst, due to the small plasma volume, which cannot be reached in other plasma types, where volume processes may be dominant. Nevertheless, plasma catalysis can also be performed in other plasma setups, like microwave (MW) or gliding arc (GA) plasmas or (atmospheric-pressure) glow discharges. However, this is typically performed in a post-plasma catalysis configuration (e.g. [104]), because most catalysts would not withstand the high temperatures in these 'warm' plasmas, although fluidized or spouted bed configurations are under investigation as well (e.g. [105]). In post-plasma catalysis, however, there is no direct contact between the short-lived reactive plasma species or other plasma components (like the electric fields) and the catalyst, and the catalyst will not affect the plasma behaviour (like the local electric field enhancements, described above). For this reason, we believe, modelling up to now has focused on packed-bed DBD reactors, at least on the reactor scale.
Of course, the models for the plasma and surface kinetics and for plasma behaviour inside catalyst pores, described in sections 3.2 and 3.3, could also be applied to other types of plasmas, at least when in direct contact with a catalyst, such as being investigated in some in situ diagnostics studies (e.g. low-pressure glow discharges; see section 4 below).
3.5. How can the various modelling approaches be integrated?
It is clear that different modelling approaches describe different aspects of plasma catalysis [106], and for an integrated picture, the different models should be combined. Incorporating detailed chemistry in 2D (or 3D) fluid models will remain quite challenging in terms of calculation time, and this is even more problematic for PIC-MCC simulations. For this purpose, 0D plasma chemistry modelling will remain the most suitable approach, as it can describe detailed plasma chemistry and even incorporate detailed surface chemistry without too much computational cost. Based on these detailed chemical kinetics models, reduced sets can then be defined for input into 2D (or 3D) fluid or PIC-MCC models. Despite the fact that 0D models in principle do not account for spatial variations, they can incorporate surface chemistry for plasma catalysis, as illustrated already in [29, 64, 80]. While these models still consider simple surface kinetics, more sophisticated coupled plasma–surface models should be developed, in which the surface reaction rate coefficients are obtained from atomic-scale simulations (e.g. classical MD simulations or DFT), which is now already the case for the (plasma) catalysis surface microkinetics modelling [11, 36, 81–84].
Such surface reactions should then also be included in 2D (or 3D) fluid and PIC-MCC models. We believe it is not yet feasible to include detailed surface chemistry in PIC-MCC models for plasma catalysis modelling at the reactor scale (e.g. streamer propagation through packed-bed DBD reactors), due to prohibitively long calculation times, so fluid models might be more appropriate for this purpose. On the other hand, PIC-MCC models are more suitable for describing plasma streamer penetration into catalyst pores due to the small pore dimensions, and here, incorporating surface chemistry should be feasible. Furthermore, the diffusion of plasma species into even smaller catalyst pores (i.e., too small for plasma streamer penetration) should be described by MC simulations (without electric field), again coupled to detailed surface chemistry.
In summary, we believe the ideal integrated model for plasma catalysis should be a combination of (see figure 11): (i) 0D chemical kinetics models, to gain detailed insight into the plasma + surface chemistry, and to produce reduced chemistry sets for higher-dimensional models, (ii) 2D (or even 3D, if the computation time would allow for it) fluid models for reactor scale modelling (e.g. plasma streamer propagation in packed bed DBD reactors), (iii) 2D or 3D PIC-MCC simulations for plasma streamer penetration into catalyst pores with dimensions of a few 100 nm (that allow plasma streamer penetration), (iv) 3D MC simulations for describing the diffusion of plasma species in even smaller catalyst pores, and (v) atomic-scale simulations for the chemical reactions of plasma species at a catalyst surface, providing surface reaction coefficients for the above models. Such a multi-scale model, ranging from the reactor scale to the atomic scale, and including the plasma and catalytic surface chemistry, should be able to provide a comprehensive picture of plasma catalysis.

Figure 11. Schematic diagram of the ideal, integrated multi-scale model for plasma catalysis.
Download figure:
Standard image High-resolution image4. Plasma–catalysis experiments
The great majority of the experimental works dealing with the plasma–catalyst coupling determine the conversion performances of molecules in packed bed DBD reactors. From an application point of view, the packed bed DBD certainly has its merits (ease of implementation, low gas temperature, safety, etc). However, it is not necessarily the most suitable plasma source, depending on the type of application targeted (see section 5). It is also not an ideal configuration for the study of fundamental mechanisms of plasma–catalyst interactions due to the lack of optical access and the strong inhomogeneities generated by the multiple random plasma filaments developing in this type of reactor. From an application point of view, as well as from a fundamental point of view, other types of plasma–catalyst coupling reactors should also be considered. In the same way that the previous sections have illustrated the need to use complementary modelling tools to successfully describe types of interactions having very different spatio-temporal scales, it is equally essential to develop specific experimental setups dedicated to the study of each individual interaction phenomenon. Thus, a global understanding of plasma–catalyst coupling systems (and ultimately their improvement also in terms of performance) requires the development of in situ (and, when possible, time-resolved) measurement techniques, which often impose constraints incompatible with the reactor configurations designed for applications. It is only by integrating the information from the study of plasma–surface interactions at different levels of simplification that bridges can be built between the fundamental mechanisms and 'real' reactors.
However, the measurements carried out in complex reactors, whether they are of the packed bed DBD type or others, are, of course, necessary for the development of many applications. Therefore, it is also important to compare these complex reactor configurations with each other in the most meaningful way possible while avoiding the pitfall of over-interpreting data in terms of microscopic mechanisms from parameters that provide only macroscopically averaged information.
In this section, we first come back to some important ideas related to packed bed DBD reactors because of the particular place they occupy in plasma–catalysis research. Some other possible plasma–catalyst coupling configurations are then discussed, as well as other plasma sources. The most common parameters for comparing the performance of plasma–catalysis reactions are next discussed, emphasising their interest and limitations. Finally, a few examples are given of possible measurement techniques allowing a better understanding of fundamental mechanisms of plasma–catalyst interaction. In particular, experimental studies dedicated to some of the effects responsible for the plasma–catalyst synergy (surface charges and electric field, vibrationally and electronically excited molecules, radicals) already mentioned in section 3 will be discussed.
Research on plasma catalysis is intrinsically multi-disciplinary and carried out by people with different expertise and habits. The vocabulary used can, therefore, sometimes lead to misunderstanding. Throughout this section, we will remind the reader of the definition of several terms, which may seem unnecessary but can nevertheless be important in the frame of 'foundations of plasma catalysis'.
4.1. Plasma–catalyst coupling configurations
4.1.1. Packed bed DBD
'Packed bed' configurations are reactors allowing the circulation of a gas flow while being filled with solid particles to increase the efficiency of the exchanges between the gas and solid phases. The combination of a packed bed reactor (PBR) with a plasma was first considered in the 1990s, mainly for the treatment of diesel engine exhausts, the removal of nitrogen oxides (so-called deNOx), and soon after for the treatment of VOCs in indoor air [107–109]. All these applications require the direct use of air at atmospheric pressure to generate the plasma with strong constraints on energy consumption. This has naturally led to the use of DBD to couple the PBR to the plasma, but other plasma sources can be coupled with packed beds.
The gas space between the solid particles (or 'voids') cannot be too small; otherwise, the plasma will not develop between the particles. If powders with particles of a few microns are used, a preferential path for the plasma will tend to be established above the catalyst bed and not through the core of the powder. DBD-PBRs are therefore usually filled with millimetre-sized particles, leaving at least a few hundred microns of space between particles. This simple constraint can already be a problem in evaluating and comparing the catalytic activity of different materials. Indeed, good practice in assessing the activity of a catalyst requires determining parameters such as selectivity, or turnover frequency (TOF or site-normalized catalytic reaction rates), or turnover numbers in ideal reactor configurations (perfectly mixed batch reactors or plug flow reactors, for instance) in which the results are reproducible and above all, independent of mass and heat transport [110]. The presence of relatively large voids between the particles can cause some of the gas to pass through the reactor without interacting with the catalytic surface, and affects the mass and heat transport phenomena to the surface depending on the geometric arrangement of the catalytic bed. This difficulty is already significant, simply from the point of view of stable molecules in classical catalysis, but in addition, DBD-PBRs add the problem of the distribution of plasma filaments within the packed bed and the diffusion of short-lived species (radicals, vibrationally or electronically excited molecules) to the surface. This effect of catalytic packing on the plasma development has been discussed from a modelling point of view in section 3.4. Experimentally, the difficulty of optical access in packed bed configurations and the randomness in time and space of plasma filaments forces us to study the effect of packing in more or less simplified systems. The effect of the packing configuration on the plasma development is mostly studied with fast ICCD imaging to characterize the localisation of the plasma in the bed. In [92], ICCD imaging was used in a plane-to-plane packed bed DBD configuration showing preferential plasma initiation at the points of contact between catalyst beads. However, such a three-dimensional packed bed configuration does not allow the visualisation of plasma development in the whole volume of the catalyst bed. This is why 'simplified' packed bed configurations are often used to perform fast imaging.
Examples of such simplified configurations are shown in figure 12, which gives examples of ICCD imaging taken from [111–113] in PBR configurations ranging from the most complex, with random packing, in figure 12(a) to the simplest, with only a single bead, in figure 12(d).

Figure 12. Examples of packed bed configuration studied with fast imaging in (a) mesh-to-mesh and (b) pin-to-plane corona packed bed, (c) 2D packed bed filled with dielectric disks, and (d) single bead in DBD. Reproduced from [111]. © IOP Publishing Ltd. All rights reserved. Reproduced from [112]. © IOP Publishing Ltd. All rights reserved. Reproduced from [113]. © IOP Publishing Ltd. CC BY 4.0.
Download figure:
Standard image High-resolution imageFigure 12(a), from [92], obtained with a microscope above a plane-to-plane packed bed DBD with random packing, shows the tendency of filaments to ignite close to the contact points of the beads. Figure 12(a), from [111], shows different types of plasma filaments in a PBR between two mesh electrodes and relates these discharge modes to the ones observed in a pin-to-plane corona configuration with the same catalyst bead (figure 12(b)). The 2D PBR shown in figure 12(c), from [112], allowed for a detailed study of the path taken by the filaments and its dependence on the spacing between beads and their dielectric permittivity (comparing quartz and zirconia). The extreme simplification of the case of an isolated bead shown in figure 12(d), taken from [113], allows a very detailed study of the development of the plasma on the surface of a bead of a given material but obviously does not allow the importance of the junctions between beads of catalysts to be studied, for example. It is worth mentioning here that configurations from [111, 112] are not, strictly speaking, DBDs since a plasma channel can be established that connects the two metal electrodes without being stopped by the charge deposition on an insulating barrier. Another example of experimental study of streamer propagation on a single catalyst bead with metallic pin electrodes is given in [114]. The advantage of metal electrodes to perform fast imaging is the lower jitter on ignition time, which helps to synchronize the acquisition of the ICCD camera, but the absence of dielectric covering the electrode can modify the mechanism of initial breakdown since no surface charge is accumulated.
All these configurations are complementary and give valuable information on the type of discharge that can develop in PBRs. In particular, simplifying the packing makes comparisons with models possible, as shown in [112], in which a fluid model reproduced the different behaviour of discharges in the 2D packed bed. It is only the combined study of all these PBR configurations that allows links to be made between the physics of individual discharges, the effects of electric field reinforcement induced by the catalytic bed arrangement, and finally, the resulting statistical spatial distribution in a large volume reactor. In an application-oriented DBD-PBR, only statistical or time- and space-averaged electrical data can give some indication of the discharge behaviour (see section 4.3). Simplified 2D or single bead configurations give real access to the type of discharge initiated with fast imaging but also spatially and temporally resolved spectroscopic information, as obtained with interferometric filters in [111].
These studies have provided evidence of different types of discharge behaviour. When the local electric field is enhanced by the catalyst beads, the applied voltage required to ionize the gas at this location is lowered. These localized field enhancements can thus generate partial discharges (PDs) that do not necessarily cross the entire inter-electrode gap. This can be the case, for example, at the poles of a catalyst bead in contact with the dielectric barrier, especially if the permittivity of the material is high (the left-hand image figure 12(d) from [113] and in [115]), at the junction between two beads (as indicated by 'PD' in figure 12(b')), or when the distance between two catalyst particles is reduced, or in the vicinity of metal particles deposited on the catalyst support (as in the bottom-left image in figure 12(c) from [112] and also in [96, 116]). The term 'PD' here refers to the fact that these filaments do not bridge the entire gap between the electrodes. They are sometimes referred to as 'FMs', which is not a very specific name because all discharges observed in these configurations are of micrometre diameter and filamentary. These PDs or FMs are mostly ionization waves through the gas voids, as distinct from the ionization waves propagating along the surface of the beads that are also observed (SIW, or SIWs, as shown in figure 12(c)). The 'primary streamer' denoted by 'PS' in figure 12(b') is also a SIW, as is the filament seen in the right-hand image of figure 12(d). Both filaments through the gas voids and SIWs are probably streamers, as will be discussed in section 4.2.2, but the small dimension and low emission intensity of the PD make an experimental distinction between an ionization wave and simple electron avalanches very difficult.
The SIW can be triggered by the accumulation of charges carried by a gas void ionization wave (or PD or FM) on the surface of the catalyst bead and is primarily ignited at the location of the most intense applied electric field. The SIW generally has a higher electric field and electron density, as expected from the literature on DBDs and flashover (see section 4.2.2). When the packing material has high dielectric permittivity, it induces higher local electric field enhancement, promoting more numerous PDs at lower applied voltage [117]. As a result, low permittivity materials will induce longer streamers along the surface for the same average power transferred to the gas. In contrast, high permittivity materials will generate more numerous discharges that are more localized in high applied electric field areas [13, 14]. It is, however, interesting to note that the dielectric permittivity depends on the frequency. The reinforcement of the applied electric field is well determined by the low-frequency dielectric permittivity (because the high voltage supplies of the DBDs are generally only at a few kHz). On the other hand, the electric field variation during the passage of an ionization wave (of the order of nanoseconds) corresponds to the GHz frequency range, for which the permittivity values can significantly decrease, as suggested in [119]. For small particles, the permittivity also depends on the grain size.
For the optimization of the chemical conversion efficiency of a DBD-PBR, many characteristics of the catalyst bed arrangement are important: the fraction of the void volume compared to the total volume of the reactor is, of course, important for the residence time of the gas and the possibility to generate the plasma, but the average size distribution of the voids, the number of contact points between catalyst particles, the angularity of the shape of the catalyst particles (which can reinforce the electric field) and, of course, the permittivity will affect the number and the location of the ionization waves generated at a given power. All these macroscopic parameters are essential to control the volume fraction of the voids in which the plasma can be ignited or not. This will determine the probability that a molecule will pass through a plasma filament. In [120], by comparing a Monte Carlo model with experimental data on the filament distribution in a plane-to-plane DBD and NH3 production in a packed bed DBD, it has been shown that the ratio of the discharge volume to the reactor volume determines the plasma reactor efficiency.
In addition to the importance of macroscopic packing parameters, the surface parameters usually controlled in catalysis remain decisive for the chemical reactivity in DBD-PBRs. In thermal catalysis, the notion of 'pores' typicaly refers to cavities or channels within the catalyst with a characteristic dimension less than 100 nm. The porosity (often written θ) is then the ratio of the total pore volume to the apparent volume of the particle or powder (excluding interparticle voids). As shown in section 3.3.2, these dimensions are too small for a plasma to be ignited in the pores. Nevertheless, the porosity θ will influence the reactivity of stable molecules in the material and whether short-lived species can diffuse into the catalyst. In particular, for sub-50 nm pores, for which diffusion occurs mainly by the collision of molecules with pore walls (Knudsen diffusion), the stability of radicals or excited states of molecules produced by the plasma after a few collisions with the surface is a key parameter that is unfortunately usually unknown. The number of active sites, the BET surface area, the crystalline or amorphous structure, and the reducibility, are all determining parameters in the activity of a catalyst, but they can all be modified by the action of the plasma on the material, either transiently or permanently, because of strong electric fields or efficient oxidizing species.
Very little is known about the role of voids at the scale of a few microns, between the macroscopic scale of the packing and the surface properties at the nanoscale. In section 3.3.2, it has been shown that models predict the possibility of initiating plasmas in micron-scale voids. This possibility has been suggested experimentally but only from energy measurements [121, 122].
There are still many questions about the development of filamentary plasmas in packed beds. To better understand these discharges, one should not neglect studies dedicated to the interaction of ionization waves with dielectric surfaces carried out in fields other than plasma catalysis, in simpler but nevertheless relevant configurations.
4.1.2. Interaction of ionization waves with dielectrics
The literature describing the physics of DBDs without catalytic beds is, of course, also relevant to understanding the physics of discharges in DBD-PBRs. Indeed, DBD-PBR configurations can be seen as a set of dielectric surfaces placed with different orientations to the applied electric field, from surfaces perpendicular to the applied field (which includes the dielectric barriers themselves) to surfaces parallel to it. Such configurations have been studied in numerous works focused on avoiding 'flashover', i.e., the initiation of ionization waves on different material surfaces. PBRs can also be seen as a set of small empty spaces of dimensions typically smaller than a millimetre. This viewpoint corresponds to the study of the initiation of discharges in small voids, which can lead to the breakdown of insulating materials. These studies do not involve catalytic materials and do not capture some specific aspects of PBRs, such as the field enhancement at particle contact points. Still, they are nevertheless helpful to understand the development of discharges in PBRs.
The plasma discharge in a DBD can develop either in a filamentary streamer regime or, in some particular conditions, as a Townsend discharge or even a glow-like discharge [123, 124]. One of the main criteria for the transition to the streamer regime is the size of the increase of the effective ionization coefficient (αeff = α − η, with α the ionization coefficient and η the attachment coefficient) for the gas with the reduced electric field E/N, where E is the electric field and N is the gas number density. Indeed, when αeff increases strongly with E/N, the local increase of the charge density induced by electron avalanches will be very sensitive to electric field inhomogeneities, which tends to satisfy locally Meek's criterion responsible for the initiation of a streamer [125]. The typical molecular gases used in plasma–catalysis applications (CO2, CH4, air, H2O, etc) all tend to have a strong dependence of αeff on E/N, except for N2, which can be favourable for the Townsend discharge regime [126]. The Townsend discharge corresponds to a low-current electron avalanche regime which does not strongly modify the applied potential. The glow-like regime only happens in a DBD when the current in the Townsend discharge increases sufficiently to have a large reservoir of adsorbed charges homogeneously spread over the cathode dielectric surface, which can sustain the discharge in the manner (in fact, the mechanism is charge desorption from dielectric) of secondary electron emission from a metallic cathode in a 'real' glow discharge. The homogeneity of the surface charge on the cathode side is critical to maintaining the glow-like discharge. Otherwise, the local charge amplification is responsible for the transition to streamers as measured by the Pockels technique on different dielectric materials deposited on top of a BSO crystal [127]. In most PBR applications, the gases used, the inhomogeneity of surface charges, and the local field reinforcement due to the shape of the catalytic surface make the formation of a Townsend or glow-like discharge unlikely, at least in the large voids (>100 μm). In small voids, however, a Townsend discharge could occur. From a terminology point of view, 'micro-discharges' or 'filaments' are therefore more of a visual description, and 'PD' and 'SIW' characterize the localization of the plasma. Most of the time, the plasma in a DBD-PBR develops as an ionization wave through a streamer mechanism either in gas voids or on a surface. Nevertheless, the properties of the streamers (electric field, electron density, etc) are modified by contact with the surface and especially by its capacitance.
In a plane-to-plane DBD, like in a DBD-PBR, it is observed experimentally that, at constant power, higher capacitance of the dielectric barrier results in fewer but more intense streamers with higher electron density, and higher gas temperature [128]. A high dielectric permittivity (εr) barrier in a plane-to-plane geometry will lower the voltage necessary to achieve the breakdown field, but the streamer will nevertheless ignite as soon as the minimum breakdown field is reached (imposed by the αeff of the gas considered), independently from the εr of the barrier. However, when the ionization front approaches the surface of the high-εr barrier, the polarization of the material will reinforce the field between the front and the surface, speeding up the streamer towards the surface. The charge deposition on the surface will then depend on the capacitance of the barrier proportional to εr/d, with d the thickness of the dielectric barrier. The velocity and the length of the propagation of the streamer along the surface in the direction perpendicular to the applied electric field will be controlled by εr/d. This can be nicely described by a simple model of resistors and capacitances in series, as shown by Akishev et al [129]. Fluid models, as in [130], also show the role of εr/d on the radial expansion, as well as the importance of surface charge density in reignition behind a dielectric barrier in the middle of the gap. A similar influence of high εr materials is observed in DBD-PBRs: gas-phase streamers approaching high εr poles of catalyst beads will develop with higher electric field and electron density, while only a weak radial spreading around the beads is observed due to the large capacitance of the beads. As a result, only PDs instead of long streamers around the surface are preferentially formed on high permittivity beads if the voltage is kept relatively low.
In contrast to the case of a dielectric surface perpendicular to the applied electric field, which can slow down the SIW because of charge deposition, when the dielectric surface is parallel to the applied field, the SIW is faster than in the gas phase. This has been extensively studied in the literature on flashover prevention with various materials and even with different surface shapes [131–133]. Figure 13, from [134], shows a similar configuration studied for lamp ignition with two pin electrodes applying an electric field parallel to BK7 glass or an Al2O3 surface in argon.

Figure 13. Fast imaging of ionization wave in argon for different distances between two pin electrodes and a dielectric surface parallel to the applied electric field. The speed of the ionization wave on the surface is about two times faster than in the gas phase, but little difference is observed between BK7 glass and Al2O3. Reproduced from [134]. © IOP Publishing Ltd. All rights reserved.
Download figure:
Standard image High-resolution imageWhen the dielectric surface is close enough to the pin-to-pin axis, the streamer tends to connect to the surface. The velocity of streamers along the surface is always much higher than through the gas phase for all pressures, peak voltages and distances. This could be due to the polarization of the dielectric surface induced by the applied field or the accumulation of surface charges from previous streamers helping the propagation on the surface. However, the higher εr of Al2O3 than BK7 seems to have very little influence in this case.
The plane-to-plane or pin-to-plane DBD, as well as the typical 'flashover' setups, have the advantage of better control of the plasma discharge and the orientation of the dielectric surface with respect to the applied field. The influence of catalytic surfaces in these configurations should be more thoroughly investigated. The problem of discharges in very small voids (<100 μm) is also little studied. Discharges in very small gaps have mostly been studied with metallic electrodes to understand the deviation from Paschen's law [135]. Nevertheless, a few studies conducted on the aging of insulating materials and the appearance of plasma in small defects discuss the possible effect of surface charging in small dielectric voids and the consequent field enhancement [136, 137]. Another application of discharges in small voids is the development of ferroelectrets. In [138], an example of DBD with a polycarbonate barrier and a 70 μm gap seems to ignite in the Townsend regime, which might be because charge amplification is not sufficient in such small voids to start a streamer. This could suggest that Townsend discharges can occur in small voids of catalyst pores of a few tens of micrometres even though the wall charging of such voids obviously depends strongly on the material.
4.1.3. Different approaches to combining plasma and catalyst
The importance of the macroscopic shape and size of catalyst particles/beads in packed bed DBDs has been discussed in the previous sections. Other possible methods of combining plasma and catalysts are discussed here, either with different catalyst supports or with plasma sources other than DBDs.
Better control of the spatial arrangement of the catalyst in the reactor volume can be achieved by using structured one-piece catalyst supports such as monoliths or ceramic foams [139]. For example, materials such as cordierite provide parallel channels typically of 1 mm width and several centimetres length, inside which various catalysts can be deposited. These channels must be placed in the direction of gas flow, which is why they are mostly used with metal electrodes pierced at each end of the monolith. This corresponds to a 'corona' discharge configuration but one in which a 'spark' whose current is limited only by the power source (DC or AC) could connect the two electrodes if the voltage is sufficient [140–142]. These monoliths can also be used in DBDs [143], but in this case, since the applied field is perpendicular to the direction of the gas channels, the applied field must be high enough to allow the re-ignition of the streamers in each channel crossed, which depends strongly on the charge deposition on the channel walls [130]. However, recent techniques for the fabrication of these monoliths provide structures with both axial and radial channels, which gave better toluene conversion efficiency in a coaxial DBD in [144] by facilitating streamer initiation in the radial direction. Another possibility to impose a macroscopic spatial distribution of the catalyst is to use ceramic foams as a support either in DBD [45] or corona [87] configuration. Besides the control of the size of the macroscopic voids using a monolithic support allows the heat transfer from the centre of the catalytic bed to the walls of the reactor to be improved, preventing local overheating thanks to the better thermal conductivity of the solid compared to the gas [144].
The improvement of heat transfer can also be one of the motivations for coupling the plasma with a fluidized bed reactor (P-FBR) [145, 146]. In a fluidized bed, the gas flow is sufficient to displace the catalyst particles (typically a few hundred micrometres in diameter) and induce a recirculation that improves the exchange between the gas phase and the surface. In a P-FBR, the fluidization mode of the powder bed is largely influenced by the charge acquired by the particles exposed to the plasma [146]. Most of the works dealing with the coupling of a plasma with a fluidized bed were aimed at functionalizing the surface of powders using various plasma sources (RF capacitively or inductively coupled plasmas, MW plasmas, DBDs), often at reduced pressure. For environmental plasma–catalysis applications, a few studies were done with GAs [147], but otherwise, mainly DBDs have been trialled for P-FBRs [148–150]. The comparison of the conversion efficiency between the same DBD reactor in 'PBR' or FBR regimes can be complicated because if the same catalytic powder is used in both configurations, the PBR bed may be too compact to allow streamer initiation in the core of the catalytic bed.
Whatever the type of catalyst support (beads, pebbles, monoliths, powders, etc), it is obvious that most of the work carried out on plasma–catalyst coupling has been done with DBDs, mainly because of their simplicity of implementation. Nevertheless, other sources of non-thermal plasmas can be coupled with catalysts. At atmospheric pressure, corona discharges, nanosecond repetitively pulsed plasmas and GAs are sources having clear advantages for some applications. However, some issues are to be considered in coupling them to catalysts. By definition, in a corona discharge configuration, the plasma does not transition to an arc because of the non-uniformity of the applied electric field, which implies that in a part of the inter-electrode gap, the field is no longer sufficient to sustain the plasma discharge. If the inter-electrode space is filled with a catalyst in such a configuration, then the entire catalyst bed is not exposed to the same plasma conditions [151]. In nanosecond repetitively pulsed plasmas, for which the transition to an electric arc is prevented by the very short duration of the voltage pulse (typically <20 ns), the interaction with a catalyst is limited by the volume of plasma generated and the impedance matching to limit power reflection. With GAs, since fluid dynamics are essential to their proper operation, the catalyst can only be positioned downstream of the discharge [152] or in a fluidized bed, as mentioned above [147]. RF and MW discharges are only rarely used in combination with catalysts. The reason is that, just like with GA plasmas, these discharges reach very high gas temperatures at atmospheric pressure (up to several thousand kelvins). These very high temperatures could be limited by pulsing the plasma or by using sufficiently large gas flows, but instead, the catalysts used with these types of discharges are most of the time placed downstream of the plasma to avoid damaging the material. For instance, degradation of vinyl chloride has been investigated with a Pt/Al2O3 catalyst in the near post-discharge region of an atmospheric-pressure RF jet [153]. MW plasmas are somewhat more often used with catalysts at atmospheric pressure because they can activate catalytic reactions simply by heating (MW-heated reactions) in addition to enhancing catalytic reactions by species produced in the plasma (MW-enhanced catalytic reactions), as described in a recent review paper [154]. Since the catalyst must be placed downstream of the MW plasma source, not all reactive species reach the surface. The catalyst can then sometimes be beneficial (NH3 synthesis from N2 and CH4 with Co/γ-Al2O3 catalyst in [155]), but it can also promote undesirable reverse reaction processes (back-reactions forming CO2 from CO are promoted on the surface of Rh/TiO2 catalyst downstream of an Ar/CO2 MW plasma in [156]). For many molecular gas mixtures, the maximum conversion efficiency of a MW or RF discharge without catalysts is not at atmospheric pressure but between 50 and 200 mbar. It is in this pressure range that these plasmas are furthest from equilibrium, in particular with vibrational temperatures much higher than the gas temperature. In general, catalytic processes are less efficient at reduced pressure due to the lower flux of molecules reaching the surface. It is, therefore, necessary to keep the plasma out of equilibrium at the highest possible pressure, which can be achieved by pulsing RF and MW discharges, as shown by recent works on CO2 plasmas [157]. Until now, the only works using RF [158], MW [159, 160] or even DC glow discharge [161, 162] sources at reduced pressure are essentially fundamental studies that take advantage of the possibility of measuring radicals and vibrationally excited molecule densities in such discharges at a few millibar to study their interaction with catalytic surfaces.
4.2. How should plasma–catalyst systems be compared?
4.2.1. Significance and limitations of commonly used parameters
The great diversity of plasma–catalyst coupling reactors makes their comparison challenging. Moreover, in many cases, the reactors aiming at optimizing the conversion efficiency do not allow in situ measurements, and the only experimental data that can be easily obtained are the densities of stable molecules at the reactor outlet and the electrical data of the reactor. These data are obviously useful, in particular for evaluating the performance of a given reactor, but they are often insufficient to draw conclusions on the real mechanisms of the interaction of the plasma with the catalyst. Simply comparing the performance of one plasma source with another requires care because of the limitations of the parameters commonly used.
To illustrate this point, we consider differences between the fundamental meaning of parameters such as 'yield' (Yi in %) or 'gas hourly space velocity' (GHSV, h−1) in thermal catalysis and plasma–catalysis.
Yi is the molar fraction of the initial limiting reactant (i.e., the molecule having the smallest mole number/stoichiometric coefficient ratio for the reaction considered) transformed into a given product. When the yield obtained with two different catalysts is discussed in thermal catalysis, it gives information about how the two catalysts affect the limiting reactant. In plasma catalysis, it is not only the stable species of the inlet gas that reach the surface of the catalyst but also the reactants produced from electron impact processes in the plasma. Two different catalysts can affect these electron impact processes differently by modifying the plasma itself and, consequently, the flow of reactants arriving on the surface. A difference in the yield obtained with two catalysts is therefore much more difficult to relate to a surface reactivity with respect to the molecules at the reactor inlet than in thermal catalysis.
The GSHV is the ratio between the volumetric flow rate of reactants and the catalyst volume. As an example, we consider here the case of a particular catalyst with two different morphologies, i.e. beads of either 1 mm (B1) or 2 mm (B2) in diameter. The volume of a B2 bead is therefore eight times larger than that of a B1 bead. If the same DBD reactor is filled with a packed bed of B2 beads or with eight times as many B1 beads, the total catalyst volume will remain the same, and thus at constant reactant flow rate, the GHSV will be the same. However, the packed bed with B1 beads will have smaller voids on average and many more junctions between the beads that will reinforce the electric field locally. Therefore, as discussed in the previous sections, the number and distribution of streamers will be different. The comparison of two catalysts at constant GHSV is, therefore, less straightforward than in thermal catalysis, mainly because the reactive medium (gas and plasma together) is inhomogeneous. This plasma inhomogeneity in plasma catalysis systems is also important to consider when discussing the performance of different plasma–catalyst reactors as a function of specific energy input (SEI).
4.2.2. Specific energy input (SEI), residence time (tres), power (Pw) and gas temperature (Tg)
Parameters such as SEI, residence time (tres), power (Pw) and gas temperature (Tg) are very often used to compare the results of molecule conversions with different catalysts or plasma sources. While these parameters are essential, they can be more complicated to analyse than they initially appear.
The energy density transferred to the gas (SEI) in a plasma catalysis reactor is often expressed (in J l−1) as the ratio of the power to the volumetric flow rate:

The SEI (or 'specific energy consumption', or 'energy cost') is also often defined in eV molecule−1 or in J molecule−1 by:

where Pw is the power transferred to the gas, tres the residence time of the gas in the 'active zone' volume and Nmol the absolute number of molecules treated. In catalysis, the residence time often designates the inverse of the GSHV. Here tres is the time spent by a molecule in the active plasma volume.
As will be shown in section 5, the SEI is a useful parameter to compare the performances of very different plasma sources. Moreover, equation (5) can be calculated a priori in any reactor, even if nothing is known about in situ parameters. It only requires measuring the average power injected into the reactor and the inlet gas flow rate. From an application point of view, this definition could be sufficient to choose an energy-efficient process (although the energy efficiency of the power generator used to ignite the plasma should also be taken into account to obtain the real power consumption). However, several problems can arise in interpreting the SEI in terms of plasma–catalyst interaction mechanisms.
First of all, in most experiments, the gas flows are regulated by mass-flow controllers that impose a standard volumetric flow rate (ϕstd) referenced to the standard conditions of pressure and temperature. The volumetric flow rate ϕvol in equation (5) is then related to ϕstd by

with Pstd and Tstd the pressure and temperature in standard conditions (respectively 101.325 kPa and 273.15 K) and Px and Tx the pressure and temperature of the gas in the experiment. Obviously, in order to compare measurements made at different total gas pressures, this normalization of the volumetric flow rate must be taken into account. However, the gas temperature is not always known in plasma–catalytic reactors. With higher gas temperature, the residence time of the gas in the plasma zone will be shorter since tres can be written as follows

with Vreac the volume of the reactor or volume of the active plasma zone. In a PBR, Vreac depends on the packing fraction and the typical size of voids and can be challenging to determine precisely. For example, in [120], a parameter of the fraction of the gas volume occupied by the plasma makes it possible to account for the efficiency of production of NH3, illustrating that the characteristic time that is really important in this case is the time spent by the molecules in the plasma filaments rather than in the gas void regions. Vreac can also be inaccurate, for instance, because the volume occupied by the plasma can vary with power and pressure in a MW discharge. Moreover, equation (8) implicitly supposes laminar flow, which is not necessarily the case [163]. In any case, the gas temperature in the plasma has to be known to estimate tres.
4.2.2.1. Power (Pw) and electrical measurements.
The simplest way to determine the instantaneous power dissipated in the plasma should be to measure the voltage (U(t)) and current (I(t)) of the discharge and apply Pw(t) = U(t) ⋅ I(t). This can be done in corona or nanosecond repetitively pulsed discharges, for instance, although the short characteristic times of these discharges require special attention to the bandwidth of all the electrical measurement elements, and even the length of the cables used in order not to induce a shift between the voltage and current signals, which would result in a large error in the power calculation. The principle of a DBD, on the other hand, is to limit the current by the capacity of the dielectric. Determining the power actually transferred to the gas by the product of voltage and current signals then requires subtracting the voltage across the dielectric capacitance, which depends on the amount of charge adsorbed on it. It is then simpler to determine an average power by plotting a Lissajous figure (or charge-voltage (Q–V) diagram) as first proposed for DBDs by Manley [164]. In figure 14 (adapted from [165]), the DBD reactor is represented by two capacitances in series, the gas capacitance (Cg) and the dielectric capacitance (Cdie). The Lissajous figure is an X–Y plot of the charge accumulated on a measuring capacitor (Cm) placed in series with the DBD reactor as a function of the voltage applied across the DBD reactor. When there is no plasma, the voltage measured on Cm is proportional to the voltage on the equivalent capacitance of the whole DBD reactor cell (Ccell = Cgas Cdie/(Cgas + Cdie)) corresponding to the slope between A and B (or between C and D) on the Q–V diagram (figure 14(b)). When the plasma is ignited in the gas, this corresponds to a channel with a certain conductivity in parallel with the gas capacitance (resistance R in the diagram). The charges transferred by the plasma will induce an additional increase of the voltage Vdie on the dielectric, which will result, via the displacement current, in an increase of Vm on Cm. In the Q–V diagram, the slope of the plot between points B and C (or between D and A) while the plasma is ignited is now given by Cdie. It can be easily shown that the difference in height between points B and C gives the total charge transferred ΔQ through the gas during a half period of the power supply. The area bounded by the Q–V diagram gives the average power transferred to the gas in a full discharge cycle according to equation (9), with T the period of the voltage cycle:

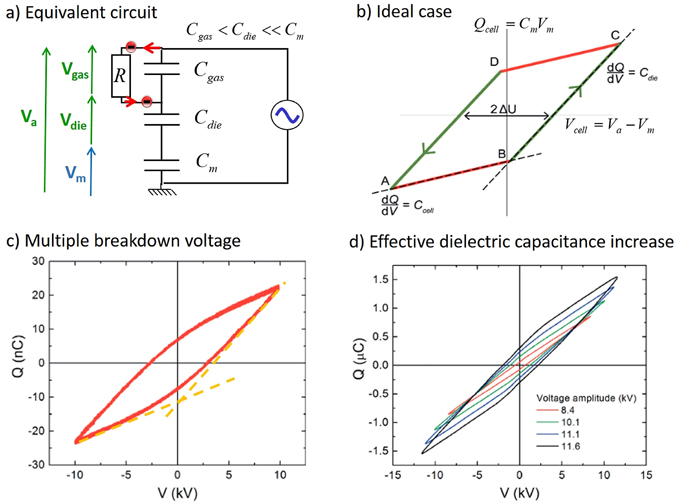
Figure 14. Principles of Lissajous method for power measurement in DBDs (a) Schematic of equivalent electrical circuit of DBD, (b) schematic of ideal Lissajous figure, (c) typical shape of Lissajous figure with multiple breakdown voltage for various streamers, (d) typical shape of Lissajous figures when streamers are covering only part of the dielectric surface. Reproduced from [165]. CC BY 3.0.
Download figure:
Standard image High-resolution imageThe details of the calculation can be found in many papers [165, 166]. Beyond the determination of the average power, the shape of the Lissajous figure contains other interesting information. The ideal parallelogram shown in figure 14(b) is only obtained if the voltage at which breakdown occurs is the same for all the filaments in the volume of the DBD reactor, which can be the case, for instance, in an empty plane-to-plane DBD.
When the plasma is ignited with different applied voltages at different locations in the reactor, the angles at points B and D become less well defined, and the resulting cycle shape is shown on figure 14(c). This is the typical shape obtained when averaging the signals over many voltage cycles, but in general, from one period to another of the power supply, the position of points B and D is erratic. This shape can often be observed in DBD-PBRs since the local field reinforcements of the catalyst beads and the variable size of voids affect the breakdown voltage required at different positions in the reactor. Figure 14(d) shows another feature that can appear in particular in PBRs. The slope of the Q–V diagram during the plasma 'ON' phases (between points B and C and D and A) corresponds to the capacitance Cdie of the whole dielectric of the reactor only if there is enough charge transferred on average to cover the entire dielectric surface. When the applied voltage is only slightly higher than the minimum breakdown voltage, it often happens that the plasma filaments are ignited only in certain areas of the reactor, especially in PBRs. The slope of the Q–V diagram in segments B and C then corresponds to an effective capacitance related to only a part of the total surface of the reactor dielectric, and this effective capacitance increases with the amplitude of the applied voltage [167]. The cycle shapes can also be strongly disturbed when the reactor dimensions are very small or when a pulsed power supply with sub-microsecond rise time is used instead of a sinusoidal power supply. In these two cases, the charge transfer will take place on very short time scales (typically a few tens of nanoseconds), which gives the Q–V diagram a shape very far from a parallelogram. The determination of the value of Cdie can then be difficult, but the amount of charge transferred can still be obtained [168, 169]. Many more details about possible deformations of Q–V diagrams and practical points to consider for good measurements can be found in [165].
The previous examples illustrate that an identical Q–V diagram area (i.e. identical average power) can be obtained with very different shapes of the Q–V plot corresponding to different plasma behaviour. To compare the effect of two catalysts in a DBD-PBR, it is therefore not sufficient to compare at constant power because of the inhomogeneity of the energy deposition. Additional information is needed to interpret how the power is distributed in the reactor volume. In addition to the Lissajous figures, it can be interesting to perform a statistical analysis on the current peaks of the plasma filaments. In a PBR reactor, the number of current peaks per half period of the voltage is too high to isolate the current of an individual filament. It is nevertheless possible to study how the statistical distribution of the current peak amplitudes is affected by the catalyst introduced into the reactor, provided that the electrical measurement system (current probe, oscilloscope, etc) has sufficient bandwidth to avoid an artificial smoothing of the fast current peaks. As a first approach, the amplitudes of the current peaks over a single period of the voltage can be compared for different catalysts [170, 171]. It is also quite simple with a modern oscilloscope to perform a more detailed statistical study of the distribution of events as a function of their amplitude at different times of the voltage period as shown in figure 15, or even to study the average charge transferred by different types of filaments in the presence or absence of catalyst [28, 172, 173].

Figure 15. Amplitude distribution function of current peaks measured in (a) an empty coaxial DBD, and (b) the same DBD with SiO2 fibres coated with TiO2 particles on the inner wall of the DBD. Reproduced from [172]. © IOP Publishing Ltd. All rights reserved.
Download figure:
Standard image High-resolution imageThe measurement of Lissajous figures using a capacitor in series with the reactor has the advantage of not missing any of the charges transferred through the gas even if the bandwidth of the measurement system is not very high. However, combining Lissajous measurements with a statistical analysis of the current peaks to obtain more detailed information on the plasma distribution in the presence of various catalysts is a practical approach that can be used even when the reactor configuration does not offer any optical access to perform in situ plasma measurements.
The importance of energy deposition inhomogeneity in the interpretation of plasma–catalysis results is not limited to DBDs. RF or MW plasma sources also induce inhomogeneous energy deposition with different regimes depending on the working pressure, as recently shown, for example, in [163] for MWs. Thus, even if the power transferred to the gas is correctly measured (e.g. by correct subtraction of the power lost in the tuning box in the case of RF discharges), it is still necessary to characterize the spatial gradients in the plasma to understand the mechanisms in the induced chemistry.
4.2.2.2. Gas temperature (Tg) and catalyst surface temperature (Tcat).
The gas temperature (Tg) is one of the key parameters controlling the dynamics of any plasma, because of its direct influence both on the chemical reaction rates, and on all collisional processes due to its impact on the gas density and thus on E/N. In plasma catalysis, the temperature of the gas (and of the surface) is also a determining factor in analysing the reactions taking place on the surface of the catalysts. The efficiency of a catalyst for a particular chemical reaction is often compared in thermal catalysis and plasma catalysis as a function of the gas temperature, which is imposed using a furnace. The lowering of the temperature at which the reaction takes place in the presence of plasma is then an indication of the activation of the reaction by the plasma. Even temperature programmed desorption experiments can be performed with a plasma–catalytic system [174]. However, the interpretation of this type of measurement requires the determination of the plasma-induced heating in the catalytic bed (Tcat).
The measurement of Tg and Tcat in PBRs is difficult. Thermocouples are generally disturbed by the electromagnetic noise of plasma discharges, and being metallic, they also disturb the plasma. In [174], a thermocouple is used after the plasma is switched off and a temperature rise of the catalytic bed up to ∼100 K is measured. As the ozone molecule is very sensitive to temperature, the literature on ozonizers gives useful information about the heating in DBDs and PBR-DBDs. In [175], the overheating induced in the gas channel of one single streamer in pure O2 was estimated to be lower than 11 K, and the channel thermalized with the bulk of the gas within a few microseconds, corresponding to the diffusion time. The overheating induced by an individual filament is therefore not necessarily very important. The cumulative effect of all the filaments, however, can induce temperatures of several hundred kelvins in DBDs, with possible spatial inhomogeneity, especially in coaxial configurations [45]. The higher thermal conductivity of solids compared to gas should help keep a relatively low temperature in PBR configurations, but measurements performed with various techniques have shown significant gradients from the centre to the edge of the catalytic bed under plasma exposure. In [176], an ethanol thermometer has been used to determine a temperature increase of up to 150 K in a DBD-PBR. An infrared camera can be used to monitor the temperature increase, but only if an infrared transparent window is available on the reactor as in [177] or when the packed bed is directly open to air as in [92]. The accuracy of the absolute surface temperatures obtained with IR cameras depends on the emissivity of the materials, which is not always known. Another limitation is that only the temperature of the outer edge of the catalytic bed can be observed. In [178], a synchrotron beam was used to analyse the x-ray absorption fine structure of the bulk of the Pd/Al2O3 catalyst in a DBD. The average temperature of the Pd particles under plasma exposure was estimated to be 162 °C and assumed to be equal to the Al2O3 support temperature, which was much higher than the temperature observed by an IR camera in the same setup. A temperature rise of ∼200 K was also measured in the core of a BaTiO3-filled 'corona'-PBR configuration using a fibre grating sensor optical technique [179]. All these measurements show that the heating of the catalytic bed cannot be ignored even in DBD-PBR [180]. An overheating of ∼200 K reduces tres for the gas in the reactor volume by a factor of ∼1.7 according to equation (8). It is difficult to know if the gas temperature Tg in the core of the catalytic bed is in equilibrium with the surface temperatures Tcat measured by these different techniques. The only measurements related to the gas temperature performed in DBD-FBRs is usually optical emission spectroscopy (OES) to measure the rotational temperature of excited electronic states of molecules, which are not necessarily in equilibrium with the gas bulk.
As already mentioned in section 4.2.2, other plasma sources (GA, RF, MW, ...) can reach even higher Tg values, requiring that the catalyst is located downstream of the discharge. In all cases, whether to analyse the surface reactivity or to take into account the true density of the gas in the plasma zone, the heating induced by the plasma must be considered.
The parameters discussed above, Yi , GHSV, SEI, tres, Pw, and Tg, are only examples of the many macroscopic parameters used to assess the performance of plasma–catalysis reactors. The value of these parameters is undeniable, but their limitations must be taken into account before drawing conclusions in terms of plasma–catalyst interaction mechanisms.
One interesting approach to improve the relevance of performance comparisons would be to develop standard references and configurations. In heterogeneous thermal catalysis, important efforts have been made to define both reference materials and standardized reactors that each research group can use to compare their results. In plasma catalysis, initiatives are appearing to propose reactor configurations that are both easily replicable and allow the testing of different materials in the same plasma source. An example is the cell proposed in [181], which can be fed either in RF or in DBD mode, and which offers the possibility of in situ diagnostics while allowing the dielectric barrier to be changed to test different catalytic deposits. Designing plasma–catalysis sources that are sufficiently versatile but that guarantee the relevance and reproducibility of the interaction conditions between the plasma and the materials remains a challenge. In particular, the spatio-temporal inhomogeneities of most plasma sources (which can be seen as an additional source of what is called external and/or internal diffusion limitations in catalysis) makes the use of in situ diagnostics requiring dedicated experimental setups indispensable to achieving a better understanding of plasma–catalyst interactions.
4.3. Understanding the fundamentals of plasma catalysis with in situ diagnostics
In situ measurements are essential to the understanding of the mechanisms involved in plasma catalysis reactors, but setups designed for high chemical efficiency are often not favourable to their implementation. In particular, DBD-PBRs often have very limited optical access and generate plasma filaments randomly distributed in time and space. Despite these difficulties, in situ measurement methods incorporating DBD-PBRs can be developed, but complementary measurements are also necessary. The understanding of the fundamental mechanisms of the plasma–catalyst interactions requires, for instance, either studies carried out on well-controlled and reproducible ionization waves interacting with complex surfaces, or studies in homogeneous plasma sources in contact with the catalyst, even if this requires working at reduced pressure [9]. In section 2, the main effects responsible for true synergy between the plasma and the catalyst have been introduced. In particular, the effects of surface charges and electric field on the catalyst and the importance of radicals and vibrationally excited molecules on the surface reactivity were described. While these parameters are certainly challenging to investigate experimentally, many measurement techniques recently developed offer interesting perspectives. In the remainder of this section, the challenges of investigating each of the effects responsible for plasma–catalyst synergy are described before suggesting experimental set-ups that are starting to be used or could be used to study these mechanisms in depth. Some examples of such experimental setups dedicated to (i) surface charges and electric field, (ii) vibrational excitation and radicals, and (iii) in situ chemical surface characterization are described in the following subsections.
4.3.1. Surface charges and electric fields in ionization waves
The plasma–catalyst interaction is reciprocal. It is as important to know how the catalyst influences the electronic properties in the plasma (electron density ne, electron temperature Te and electric field E) as it is to know the effect of the plasma on the material via the surface field Es and surface charges σ.
Recently, several techniques have been used to obtain measurements of ne, Te and E in ionization waves at atmospheric pressure, but all require devices in which the location and timing of the ionization waves are well controlled. For example, the electric field can be measured by Stark polarization spectroscopy, and ne, Te by Thomson scattering in He or Ar jet plasmas impacting on various dielectric or metallic surfaces [182–184]. The electric field in air streamers can be measured with excellent spatial and temporal resolution by cross-correlation spectroscopy (CCS) using the ratio of emission lines corresponding to electronic states excited by electron impact at different energies. This technique has, for example, highlighted the importance of the pre-breakdown phase, which can last up to a few microseconds before reaching the Meek criterion threshold, triggering the initiation of a streamer from the anode of a pin-to-pin DBD [184]. CCS could also be adapted to measure the development of streamers in CO2 [185]. The influence of remaining surface charge on the development of successive SIWs studied with a similar technique in [186] has demonstrated the strong enhancement of E/N in surface streamers. Electric-field-induced second-harmonic generation (E-FISH) is a recent laser-based technique to measure the electric field with very high time resolution (typically tens of picoseconds), although questions remain as to the exact spatial resolution that can be achieved [187]. The influence of the decay rate of surface charge on the electric field and dynamic of SIWs in a nanosecond pulsed surface DBD have been studied with E-FISH on epoxy resin and PTFE in [188]. All these examples show that the spatio-temporal evolution of the electric field in ionization waves in contact with catalytic surfaces can be measured with these techniques.
Measurements of surface electric field and surface charges on the dielectric have also made significant progress. Electrostatic probes can be limited in spatial and temporal resolution, but the 'Pockels' technique based on change of light polarization through an electro-optic crystal has already been used for some time to determine the surface charge pattern of streamers impacting dielectric surfaces [189]. This technique has been used, for instance, to investigate the role of surface charge on the transition from a diffuse to filamentary DBD in He/N2 mixtures [190]. The main limitation of this technique is the necessity to use electro-optical crystals (mostly BSO) as the dielectric. A variant of this technique called Mueller polarimetry has recently been developed to separate the depolarization, diattenuation and birefringence components of the signal for use on more complex surfaces. As a test case, the field induced by an atmospheric-pressure plasma jet (APPJ) in He impacting organic tissue could be determined [191]. With the same technique, the axial and radial component of surface electric field induced in a BSO crystal at the impact of an ionization wave generated by a helium APPJ was monitored with spatial and temporal resolution. Figure 16, taken from [192], shows the comparison of these measurements with the results of a 2D fluid model of the APPJ, showing excellent agreement for both the surface electric field component as well as the surface charge density.
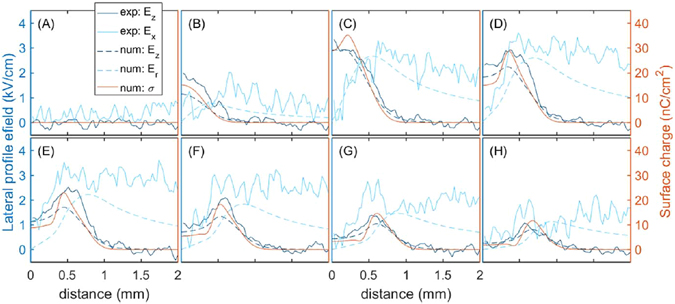
Figure 16. Comparison between experimental and modelling values of electric field (radial and axial components) and surface charges induced on a BSO dielectric target as a function of the time after impact of a kHz helium APPJ. Reproduced from [192]. © IOP Publishing Ltd. All rights reserved.
Download figure:
Standard image High-resolution imageIt is worth noting here that in all these measurements [189–192], the surface charge density is between 1 and 100 nC cm−2 (in agreement with the ∼160 nC cm−2 estimated in [32] and mentioned in section 2.3.1) irrespective of the gas in which the ionization waves are generated because it is the capacitance of the dielectric material that primarily controls the maximum achievable surface charge density. Whether by Mueller polarimetry or by other techniques being developed (e.g. IR spectroscopy of surface charges in [193]), the measurement of σ on catalytic surfaces is becoming possible.
4.3.2. Radicals and vibrationally excited molecules
Radicals and vibrationally excited molecules play a major role in the plasma–catalyst synergy due to their high chemical reactivity (see section 2). Because they are very reactive, their absolute density and their lifetime at atmospheric pressure are respectively very small and short, making them highly challenging to measure. In addition, all absorption measurement techniques that are often suitable for radicals and vibrational temperature measurement are poorly suited to the small dimensions and inhomogeneity of atmospheric-pressure plasmas. Measurements at atmospheric pressure are, therefore, often limited to OES. For instance, in [194], OES was performed on CH(A2∆) radicals in a packed bed DBD for methane steam reforming. The rotational temperature of this radical was shown to be in equilibrium with the gas temperature, which allowed the determination of Tg in the catalytic bed. On the other hand, the measured vibrational temperature only corresponds to the vibrational temperature of the excited electronic state of this radical, which is not necessarily in equilibrium even with the ground state of CH. The main difficulty of OES measurements is the uncertainty surrounding the link between the properties measured on excited electronic states and the bulk properties of the gas. Nevertheless, in [194], it was observed that the vibrational temperature of CH(A2D) is affected by the presence of the nickel catalyst.
More direct measurements of radicals and vibrational temperature (Tv) at atmospheric pressure would be beneficial. Two-photon laser-induced fluorescence (TALIF) can be used to measure the densities of various radicals (O, H, OH, etc) with good spatial and temporal resolution. One of the difficulties at atmospheric pressure is the characteristic time of the quenching of the state excited by the laser beam. However, the development of 'fast-TALIF' (with a picosecond or even femtosecond laser) has given excellent results in flames and is starting to be used in atmospheric-pressure plasmas [195]. A limitation to using fast TALIF in plasma–catalysis systems, however, is that it is difficult to measure close to (typically within 1 mm of) the surface. Mass spectrometry can be performed in atmospheric-pressure plasmas, providing information about stable molecules, and also radicals and even ions [196], which would be interesting for sampling done at a catalytic surface exposed to the plasma. Infrared absorption spectroscopy measurements performed directly through the plasma is a powerful technique to measure the vibrational temperature of molecules [197]. The approach has been applied recently at high pressure with FTIR in an RF discharge [198] and in a nanosecond discharge with quantum cascade laser absorption [199]. The same measurements could be performed with a catalytic surface despite the limitations of line-of-sight integrated techniques.
A complementary approach for gaining understanding of the interaction with catalysts, is to use low-pressure discharges in which the radical densities and vibrational temperatures can be precisely determined. For instance, in [200], the vibrational de-excitation of N2 on various catalysts was investigated in a low-pressure RF discharge. In [201], silica fibres commercially available as catalyst supports were placed on the inner wall of a low-pressure glow discharge in CO2. It has been shown that the very high recombination probability of O atoms on this material was responsible for an increase of vibrational temperature of both CO2 and CO, highlighting the importance of CO2 vibrational quenching by O atoms.
4.3.3. In situ surface chemistry diagnostics
Many techniques commonly used for the characterization of catalysts (x-ray diffraction, O2 chemisorption, Fourier-transform Raman, x-ray photoelectron spectroscopy, NMR, TEM, etc) are difficult to use in situ under direct plasma exposure. It is, of course, always interesting to use these techniques before and after exposing the catalyst to plasma to check the permanent structural changes caused by the plasma. However, to really understand the plasma–catalyst interactions, it is also necessary to have access to the temporal evolution and to the reversible phenomena under plasma exposure. The surface measurement technique that has been the most developed for in situ measurements to date remains infrared absorption, whether by diffuse reflectance infrared Fourier transform spectroscopy [202], transmission through pellets [203], or attenuated total reflectance [204]. These variants of broadband infrared absorption techniques on surfaces allow the temporal evolution of stable molecules adsorbed on the catalyst to be followed. If these measurements can be associated with measurements of the composition of the gas phase produced by the plasma, they become a powerful tool to study the coupled chemical kinetics of the gas and adsorbed phases. However, it must be kept in mind that the molecules detected by IR on the surface are primarily those that accumulate there and thus are not necessarily the most reactive species. A method to increase the sensitivity of IR absorption detection and, therefore, to have access to species with lower surface densities is polarization-modulation infrared reflection-absorption spectroscopy (PM-IRAS). The oxidation of CH4 by plasma on Ni and SiO2 surfaces has recently been studied with PM-IRAS in combination with OES and mass spectrometry to monitor both gas and surface species [205]. As PM-IRAS relies on reflections, it is, however, more often used on metal surfaces.
Temperature programmed desorption is another technique commonly used to identify species adsorbed on catalyst surfaces. TPD has recently been adapted to study CO2 hydrogenation in DBDs with Co and Cu catalysts [174]. The gas-phase composition was also monitored with gas chromatography and mass spectrometry. Pre-treatment of the surface with isotopically labelled CO2 allowed the authors to track the exchange of atoms between the gas and the surface. Isotopic labelling is a powerful technique that has already been used, for instance, in [206] to investigate the chemical pathways in NH3/D2/N2 in a DBD-PBR filled with lead zirconate titanate catalyst.
Even techniques based on x-rays, which in principle are only applicable at very low pressure, become accessible for in situ structural analysis of catalysts thanks to the brightness of synchrotron radiation. In [177], it was shown that the structure of Pd particles supported on Al2O3 in a DBD-PBR was not affected by the plasma.
All these characterization techniques associated with in situ measurements of the plasma phase are undoubtedly essential to improve our understanding of the fundamental mechanisms of plasma–catalyst interactions and should eventually allow quantitative comparisons with the models described in section 2.
5. Applications
The environmental applications of plasma catalysis can be divided into gas cleaning and gas conversion, as was noted in section 1. Gas cleaning refers to the removal of relatively low concentrations of unwanted components from a gas stream. Examples of these components include VOCs and nitrogen oxides (NOx ). In gas conversion, the input gases are in high concentration. They are typically converted to products of higher value, although removal of certain input gases, such as CO2, may also be a goal. Examples of gas conversion include splitting and hydrogenation of CO2, dry reforming of CH4 to produce syngas, higher hydrocarbons or oxygenates, and the production of NH3 from N2 and H2.
The different applications can be used to illustrate the many challenges inherent in developing successful applications of plasma catalysis. Some challenges, such as the need to improve energy efficiency and to design optimal catalysts, are generic. Others, such as enhanced product yield and specificity, only apply to gas conversion applications. Particular applications can also be used to highlight concepts, including the need to tailor the electron energy distribution to favour preferred gas-phase reactions, the relation between the excited species created in the plasma and the dominant surface reactions, and the associated shift in the 'volcano curve' that affects the choice of catalyst.
An important distinction is between in-plasma catalysis, in which the catalyst is situated within the plasma, and post-plasma catalysis, in which the catalyst is downstream of the plasma. In-plasma catalysis is only suitable for plasmas with low gas temperatures, such as DBDs, since high temperatures inactivate the catalyst, for example by sintering or changing the crystalline phase. However, post-plasma catalysis is only effective if the plasma species used in the catalytic reactions are long-lived, which rules out most radicals and excited molecules.
5.1. Gas cleaning
Gas cleaning encompasses many applications, including removing VOCs, particulates, NOx , and sulphur oxides (SOx ) from gas streams. Plasma processes are widely applied for these purposes, such as the corona discharges used in electrostatic precipitators for particulate removal from the exhaust gas of coal-fired power plants [207]. Plasma catalysis is less widely used but has found commercial implementation for the removal of VOCs and has been developed to pilot scale for NOx removal. Other applications, including particulate and SOx removal, are being researched [9].
5.1.1. Removal of volatile organic compounds
The use of combinations of non-thermal plasmas and catalytic materials to remove VOCs has been studied for decades. Several reviews have been published, for example [208–212].
The standard approach is the use of a DBD combined with a packed bed of catalytic material. The VOC is adsorbed on the catalyst surface before oxidation by species generated by the plasma. The VOCs are typically at low concentrations, and the adsorption acts as a pre-concentration step before plasma treatment [9]. A wide range of VOCs has been treated, including chain hydrocarbons, aromatics and, more recently, chlorinated species.
The most widely used catalytic materials are metal oxides, such as TiO2, Al2O3, SiO2 and CeO2. Metal oxides are less expensive than the metal-loaded catalysts typically used for thermal catalysis and in plasma–catalytic gas conversion. MnO2, which has poor thermal catalytic activity, is also widely used because it efficiently decomposes the ozone produced by the plasma as well as adsorbing VOCs. The application of metal oxides in plasma removal of VOCs provides an example of the different catalytic materials used for plasma and thermal catalysis applications. Indeed, strictly speaking, the metal oxides are not true catalysts since while they facilitate reactions, they do not lower their energy barriers.
Three main approaches can be distinguished: continuous in-plasma catalysis and post-plasma catalysis, which are differentiated by the location of the catalytic bed in relation to the plasma, and sequential in-plasma catalysis, in which adsorption of the VOC and plasma regeneration take place sequentially [213, 214]. Kim et al calculated that reactive species such as O (3P) and OH, with respective lifetimes of 50 μs and 100 μs, must be produced within about 60 μm of the catalyst surface for interactions to occur [214]. Therefore, such species will not be active in post-plasma catalysis; the dominant reactive species will be ozone, whose lifetime is several minutes. Indeed, in some implementations, the only role of the plasma is to produce ozone [6].
Sequential and continuous in-plasma catalysis can both give excellent removal of VOCs. The sequential approach can substantially decrease energy use, but this can be at the expense of less complete oxidation of the VOCs to CO2 [215]. Sequential operation also offers the possibility of using oxygen as the plasma gas, which increases the decomposition rate and removes the possibility of NOx formation [216].
5.1.2. Removal of NOx
Thermal catalytic approaches for the removal of NOx from exhaust gases include selective catalytic reduction (SCR) using ammonia (NH3-SCR) and hydrocarbons (HC-SCR). HC-SCR has a poor activity below 300 °C and requires the addition of HC, although this may be provided by unburned fuel. NH3-SCR can operate at lower temperatures but requires a separate tank of NH3.
The use of a plasma can avoid problems such as the requirement for expensive noble metal catalysts, the need for high temperatures, particularly in HC-SCR, and the formation of N2O instead of N2 as the product of NOx reduction.
Post-plasma catalysis is widely used since stable intermediate species can be produced by the interaction of the plasma with exhaust gases. The plasma partially oxidizes the NO and hydrocarbons to form NO2 and oxygenates (alcohols and aldehydes), as well as organic nitroso-compounds such as CH3ONO and HNO2 [9]. The species then interact with the catalyst to form, ideally, N2, CO2 and H2O.
An example, analogous to that mentioned in section 2.3.4 [40], is given in figure 17 [217]. The simulated exhaust gas contained 435 ppm NO, 10 ppm NO2, 6000 ppm C2H4, 8% O2, and the balance was N2. A DBD reactor partially oxidized the NO to NO2 and converted the C2H4 to HCHO, CH3ONO2 and other organic species. The gas mixture then passed over an Ag/Al2O3 catalyst, where the organics were removed, and up to 90% of the NOx was reduced to N2. The catalyst temperature was 240 °C, which is too low to activate C2H6; however, the organics produced by the plasma were activated and could contribute to NOx reduction. The strong synergistic effect of the plasma and catalyst is clear; the catalyst alone had a removal efficiency of only 7% [217].

Figure 17. Dependence on the plasma energy density of NO and NO2 concentrations after plasma treatment (left axis) and NOx removal efficiency after plasma treatment and after both the plasma and catalyst stages (right axis). Adapted from [217].
Download figure:
Standard image High-resolution imageIn-plasma catalysis has also been shown to reduce NOx strongly. Complete oxidation of the hydrocarbon in the plasma decreases NOx reduction since the beneficial intermediate organic species are not available, so it is important to limit the reaction temperature to ensure only partial oxidation occurs [218]. In situ measurements indicate that the plasma may play a role in cleaning the surface of the catalyst, reducing deactivation [202, 218]. In both post- and in-plasma catalysis, the role of the intermediate species formed in the plasma is critical to allowing HC-SCR to proceed at relatively low temperatures, below the usual activation temperature of the catalyst.
Plasma can also enhance NH3-SCR. It has been demonstrated that the NOx conversion rate in NH3-SCR is increased at low temperatures (below 250 °C) if the NO2/NO ratio is increased to 50%. This suggests that post-plasma catalysis, with the plasma used to partially oxidize the NO, can be advantageous [218]. This has been confirmed experimentally. For example, Rajanikanth et al [219] found that treating the exhaust gas from a diesel generator with a plasma before passing to an NH3-SCR reactor increased the NOx removal efficiency from 10% to 90%, with the NO2/NO ratio after the plasma stage and the NOx removal efficiency increasing with the plasma energy density. Moreover, the NOx removal efficiency increased much less rapidly with the plasma energy density once the NO2/NO ratio reached 50%, confirming that this is an optimum ratio.
5.2. Gas conversion
Plasma processes are naturally suited to coupling to renewable energy sources since they can be turned on and off rapidly to accommodate energy availability. Moreover, they can usually be designed for a range of scales to suit the energy source. In contrast, thermal catalysis processes have prolonged heating and cooling times and are typically more efficient at large scales. Nevertheless, many gas conversion processes using thermal catalysis have been developed and optimized over many decades, reaching impressive performance levels. It is unrealistic to expect novel processes such as plasma catalysis to be competitive at an early stage.
In assessing a gas conversion process, there are many factors to consider, including the energy cost (the energy consumed by the process for a given amount of product), energy efficiency (the ratio of the reaction enthalpy and the energy cost, relevant to endothermic reactions), the conversion yield (the fraction of the input gas that is converted to the target product), the product selectivity (the fraction of the target product in all the products), the conversion rate (the amount of the input gas converted per unit time) and the conversion (the fraction of the input gas converted).
We can distinguish between gas conversion reactions that are thermodynamically downhill (ΔG < 0) and uphill (ΔG > 0), where G is the Gibbs free energy [9]. In this section, we consider two examples of the former, i.e., NH3 production and CO2 methanation, and two examples of the latter, i.e., dry reforming of CH4 and CO2 splitting.
For thermodynamically downhill reactions, the reaction rate can be enhanced by vibrational and electronic excitation of the input molecules in the plasma since the height of the activation barrier relative to the reactant energy is decreased—see figure 3(a) and the discussion in sections 2.2 and 2.3. The decrease may allow lower temperature operation and means that catalysts that interact relatively weakly with reactants and products are preferred (which shifts the volcano curve to the right).
For thermodynamically uphill reactions, bond breaking in the plasma is required (via strong vibrational or direct electronic activation) since standard catalysts will be active for both the backward and forward reactions—see figure 3(b). Therefore, an effective catalyst should be inactive for the target reaction; it should instead enhance favourable downhill reactions of the plasma-produced species or their products. An alternative is to operate at higher temperatures, for which the entropy increase leads to ΔG < 0.
5.2.1. Ammonia production
NH3 production from N2 and H2 is the simplest example of plasma–catalytic gas production. The reaction is exothermic

where ΔH0 is the change in enthalpy, but has a large energy barrier due to the strong triple bond of the N2 molecule.
The Haber–Bosch process uses a thermal catalyst to reduce the energy barrier through reactions between surface-adsorbed N and H atoms. The reaction mechanism is given in table 1. Appropriate catalysts have to bind N2 molecules sufficiently strongly to allow easy dissociation, but not so strongly that they limit desorption or slow the hydrogenation reactions. Iron-based catalysts are typically used since they satisfy this requirement and are relatively inexpensive. However, high temperatures (at least 700 K) are required for catalyst activation. At such temperatures, the chemical equilibrium production of NH3 is negligible. From Le Chatelier's principle, increasing the pressure increases the conversion yield since there are fewer product than reactant molecules; however, only by increasing the pressure to 100 bar can an acceptable yield of 15% be obtained.
Table 1. Reaction mechanism for NH3 synthesis by thermal catalysis; (s) denotes a surface-adsorbed species, Surf(s) denotes a vacant surface site.
| Description | Reaction |
|---|---|
| H2 dissociative adsorption | H2 + 2 Surf(s) → 2H(s) |
| N2 dissociative adsorption | N2 + 2 Surf(s) → 2N(s) |
| L–H hydrogenation reactions | N(s) + H(s) → NH(s) + Surf(s) |
| NH(s) + H(s) → NH2(s) + Surf(s) | |
| NH2(s) + H(s) → NH3(s) + Surf(s) | |
| NH3 desorption | NH3(s) → NH3 + Surf(s) |
The energy cost of the Haber–Bosch process is typically very low, about 0.1 MJ mol−1 (corresponding to an energy yield of 600 g (kWh)−1), excluding the energy cost of H2 production. However, at the smaller scales (∼10 t day−1) compatible with renewable energy sources, 0.4 MJ mol−1 (corresponding to 150 g (kWh)−1) is typical [211].
Applying a nonequilibrium plasma allows the reaction to proceed at ambient temperature and pressure, although higher temperatures have proved advantageous. Most experiments have used packed-bed DBDs; MW and rf discharges have also been tested. Figure 18 summarizes the energy yields and NH3 concentrations that have been achieved and shows a suggested target range of 100–200 g (kWh)−1 energy yield and 1% conversion yield [8]. Energy costs of 1.8 MJ mol−1 (corresponding to 30 g (kWh)−1) have been achieved, but only at yields below 1%. Yields up to 9% have been demonstrated, but the best energy costs for yields above 1% are about 4 MJ mol−1 (corresponding to 15 g (kWh)−1) [8, 211, 220].
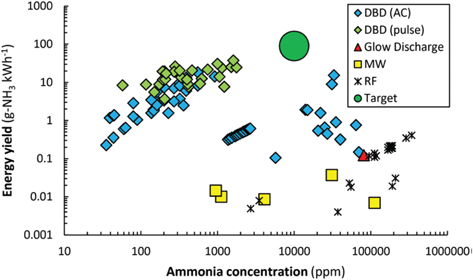
Figure 18. Reported energy yield and NH3 concentration for different plasmas. A nominal target is also shown. Reprinted with permission from [8]. Copyright (2020) American Chemical Society.
Download figure:
Standard image High-resolution imageWhile it is possible to produce NH3 in a plasma through gas-phase reactions alone (see figure 1(a)), the presence of surfaces, particularly catalysts, significantly increases the conversion yield. Two main mechanisms have been proposed [8].
The first is by providing vibrational energy to N2 molecules to promote their dissociative adsorption. This is an example of the vibrational and electronic excitation for thermodynamically downhill reactions mentioned at the start of section 5.2, which may lead to a change in the optimum catalyst. The dominant reaction mechanism, illustrated in figure 1(d), is essentially the same as that shown in table 1, with the addition of vibrational excitation of N2 and H2. Mehta et al [11, 221] predicted using microkinetic modelling that metals that bind N2 weakly will be favoured since N2 activation is the rate-limiting step. This corresponds to a shift in the peak of the volcano curve away from the iron-based catalysts used in the Haber–Bosch process toward cobalt- and nickel-based catalysts, which bind N2 less tightly, as shown in figure 19.

Figure 19. Predicted TOF, corresponding to NH3 synthesis rates, at 200 °C and 1 bar over step sites on different metal catalysts for ground-state (plasma-off) and vibrationally excited (plasma-on) N2. Metals with low binding energy EN bind N2 more strongly than those with high EN. The dashed line shows the maximum possible hydrogenation rate. Reprinted by permission from Springer Nature Customer Service Centre GmbH: [NATURE CATALYSIS][Mehta, P., Barboun, P., Herrera, F.A. et al. Overcoming ammonia synthesis scaling relations with plasma-enabled catalysis. Nat Catal 1, 269–275 (2018). https://doi.org/10.1038/s41929-018-0045-1]
Download figure:
Standard image High-resolution imageThe second proposed mechanism is the dissociation of N2 in the plasma, which has been called surface-enhanced plasma-driven NH3 synthesis [8]. Here, dissociation of N2 occurs predominantly in the gas phase. The reaction mechanism becomes more complex. Important reactions include adsorption of N on the catalyst, after which L–H reactions with surface-adsorbed H occur (this has also been called plasma-enhanced semi-catalytic NH3 synthesis [12], as discussed in section 2.1) and E–R reactions of N with surface-adsorbed H. The reaction mechanisms are illustrated in figures 1(b) and (c), respectively.
Detailed kinetic modelling of the reactions occurring in packed-bed DBDs has been performed [64, 80, 222], as discussed in some detail in section 3.2.3. Together with experimental studies, the models indicate the importance of temperature in determining the dominant mechanisms. Kinetic modelling predicts that at low temperatures, surfaces become saturated with adsorbed N and NH3, leaving limited sites available for dissociative adsorption of N2 or adsorption of N. Increasing the temperature, particularly above about 500 K, is predicted to free surface sites for N adsorption [221]. Measurements, such as those shown in figure 20, demonstrate that an enhancement of NH3 production occurs in the presence of a catalyst at higher temperatures, which is attributed to the dissociative adsorption of vibrationally excited N2 and adsorption of N. The presence of the plasma significantly increases the NH3 production, indicating the ability of plasma catalysis to exceed thermal equilibrium limits [13, 223].

Figure 20. NH3 concentration obtained for plasma-driven and thermal-catalytic synthesis at different temperatures for an empty DBD reactor and DBD reactors packed with different materials. Reproduced from [13]. CC BY 3.0.
Download figure:
Standard image High-resolution imageThe energy requirements of different gas-phase reactions, shown in table 2, provide insights into the energy efficiency of NH3 production using a plasma. It is clear that ionization of N2 or H2, and dissociation of H2, in the plasma are ixncompatible with a target energy yield of 100 g-NH3 (kWh)−1. Vibrational and electronic activation, and possibly dissociation, of N2 are likely to be compatible, depending on the energy requirements of the many other reactions that will occur.
Table 2. Energy requirements for electron-impact activation, dissociation and ionization reactions of N2 and H2. Adapted from [8].
| Reaction | Energy requirement | ||
|---|---|---|---|
| eV | g-NH3 (kWh)−1 | ||
| N2 vibrational excitation | N2(X) → N2(X, ν = 1) | 0.29 | 5000 |
| N2 electronic excitation | N2(X) → N2(A3) | 6.17 | 205 |
| N2 dissociation | N2 + e → 2N + e | 15.6 | 129.8 |
| H2 dissociation | H2 + e → 2H + e | 15.4 | 93.7 |
| N2 & H2 dissociation | 54.4 | ||
| N2 ionization | N2 + e → N2 + + e | 15.6 | 81.5 |
| H2 ionization | H2 + e → H2 + + e | 15.4 | 27.5 |
| N2 & H2 ionization | 20.6 | ||
The reduced electric field (E/N) in MW and GA reactors is typically around 50 Td (1 Td = 10−21 V m2). In contrast, DBD reactors have reduced electric fields over 200 Td, which is appropriate for direct electron impact dissociation and ionization.
An examination of the energy transferred to different electron-impact processes, shown in figure 21, indicates that vibrational excitation of N2 and dissociation of H2 are dominant below 20 Td, electronic excitation of N2 and dissociation of H2 between 20 and 200 Td, and ionization of N2 and H2 and dissociation of N2 above 200 Td. Hence, DBD reactors tend to couple energy to ionization reactions and N2 dissociation.
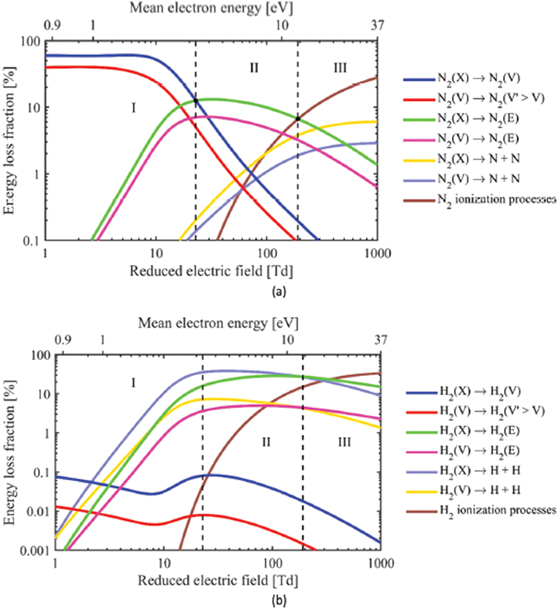
Figure 21. Fraction of electron energy transferred to different mechanisms in a stoichiometric N2/H2 mixture at a gas temperature of 400 K and vibrational temperature of 300 K as a function of mean electron energy and reduced electric field for (a) N2 and (b) H2. (X), (V) and (E) respectively denote ground state, vibrationally excited and electronically excited levels. Reprinted with permission from [8]. Copyright (2020) American Chemical Society.
Download figure:
Standard image High-resolution imageThe data indicate that, for plasma-only processes, GAs and MW discharges should have higher energy yields. However, as shown in figure 18, only low energy yields have been obtained. Moreover, such discharges are only compatible with post-plasma catalysis because of their high gas temperatures. The lifetime of vibrationally excited N2 molecules is only about 40 ns [224], so post-plasma catalysis will not be able to make use of such molecules.
DBD reactors are unlikely to provide the required energy efficiency, even in the presence of a catalyst, since ionization and dissociation reactions will dominate over vibrational and electronic excitation processes. This indicates the need for new strategies. One possibility is to use H2O as the precursor molecule rather than H2 [225]. This saves the large amount of energy (237 kJ mol−1) required to produce the H2 from water. For a typical water electrolyzer energy requirement of 0.35 MJ mol−1, the target energy cost to produce NH3 from N2 and H2O is around 1.2 MJ mol−1, approximately twice that for production from N2 and H2. The approach is complicated by the competing reactions to form NOx , however. Innovative approaches, such as using an electrochemical reactor to produce H2 from H2O and coupling this to a N2 plasma through a proton-conducting membrane, are being developed [226].
5.2.2. CO2 conversion
Transforming CO2 into valuable products using renewable energy is an attractive element of a sustainable low-carbon economy. Potential products include CO, CH4, olefins and liquid fuels. A major challenge is the thermodynamic stability of CO2; substantial energy is required for its dissociation.
There is an extensive effort to apply plasmas for the conversion of CO2 to useful products. Many reactions are being investigated. The include CO2 splitting to form CO and O2, CO2 hydrogenation to form CH4, CO and methanol, CO2 reforming with CH4 to form syngas (CO and H2), higher hydrocarbons and oxygenates, and CO2 reduction with water to form syngas. The reader is referred to reviews of CO2 conversion [6, 227] for more detailed discussions of mechanisms and progress.
CO2 reforming with CH4, known as dry reforming, will be discussed in section 5.2.3. Here we consider CO2 splitting and CO2 hydrogenation. A comparison of the two processes provides insights into the applicability of plasma catalysis to different chemical reactions.
CO2 splitting proceeds via the reaction

While the reaction is endothermic at room temperature, the equilibrium conversion increases at temperatures above about 1500 K because of the entropy contribution to the Gibbs free energy. It is instructive to consider the different excitation mechanisms and their energy requirements compared to the enthalpy of formation of CO. Direct electron-impact dissociative excitation,  , requires an electron energy of around 11.5 eV. A single vibrational excitation allows the bound CO + O(3P) state to be accessed:
  . This reduces the energy barrier to 5.5 eV. The stepwise vibrational excitation mechanism, in which overpopulation associated with the initial vibrational excitation is transferred up the vibrational ladder by excitation exchange in collisions between CO2 molecules, has a threshold electron energy of only 0.3 eV.
As noted for the case of NH3 production, MW and GA reactors have electron energies suited to transferring energy to vibrational excitation, as shown in figure 22 for the case of CO2. In contrast, DBD reactors have reduced electric fields above 200 Td, which is appropriate for direct electron-impact dissociation.

Figure 22. Fraction of electron energy transferred to vibrational and electronic excitation, dissociation and ionization of CO2 as a function of the reduced electric field. The E/N regions characteristic of MW, GA and DBD reactors are also shown. Reproduced from [6]. CC BY 3.0.
Download figure:
Standard image High-resolution imageDBDs have only reached about 20% energy efficiency for CO2 splitting, with typical values below 10% [227]. This is a consequence of the high reduced electric field, typically above 200 Td, which yields average electron energies of 2 to 3 eV [228], too high for the efficient population of CO2 vibrational levels, as shown in figure 22. The addition of a packed bed to the DBD generally increases the conversion, with a strong dependence on the packing material and its size [117], without changing the energy efficiency greatly. The increased conversion is generally attributed to affecting the physical parameters of the discharge, with no strong evidence of a contribution due to catalysis. A useful catalyst would need to assist the dissociation of vibrationally excited CO2 molecules on the surface.
MW and GA plasmas have been found to give far higher energy efficiencies than DBDs for CO2 conversion [6, 227]. This is partly a consequence of the more favourable E/N and partly because of the higher gas temperatures, which give a higher equilibrium yield and efficiency. However, MW and GA plasmas are generally incompatible with in situ plasma catalysis because of the high temperatures. Post-plasma catalysis has not been tested extensively. A problem is the lifetime of the vibrationally excited CO2 molecules, which is limited by collisions with ground-state molecules (VT relaxation); the relaxation rate increases with translational temperature, with the lifetime falling below 1 μs for temperatures above 1000 K [229]. The development of lower temperature sources would allow the catalyst to be placed closer to the reaction zone and also increase the lifetime of vibrationally excited molecules.
While the energy efficiency obtainable using a DBDs is unavoidably limited by their high E/N, their suitability for in situ catalysis makes possible direct production of value-added chemicals when a hydrogen-containing precursor is added to CO2. This contrasts with the need for an additional synthesis step (e.g. a Fischer–Tropsch process) to convert the CO and H2 to useful compounds.
CO2 hydrogenation is an exothermic process; for example, the reaction to produce CH4 (known as CO2 methanation or the Sabatier reaction) is

A wide range of products can be obtained in addition to CH4. These include methanol, other alcohols, aldehydes and acids.
The simplest example is methanation (reaction (12)). If the H2 is obtained by electrolyzing water, the process is a method of converting CO2 to CH4 using renewable energy [230, 231]. Nickel-based catalysts are typically used for thermal catalysis, with a temperature of 300 to 400 °C required. The equilibrium CO2 conversion is around 90% at 350 °C and 1 bar. As for NH3 production, Le Chatelier's Principle indicates that this can be improved by increasing the pressure or reducing the temperature [231]. A plasma process offers the possibility of operation at a reduced temperature, allowing, in principle, higher CO2 conversion.
CO2 conversion and CH4 yield of up to 80% have been obtained using plasma catalysis in DBD reactors, as shown in figure 23. Note that the CH4 yield is the product of the CO2 conversion and the CH4 selectivity, so the best selectivity approaches 100%. The presence of a catalyst greatly improves the performance compared to the use of a plasma alone. For example, Ahmad et al [232] obtained CO2 conversion of 60% and CH4 selectivity above 97% at 150 °C using an Ni/Al2O3 catalyst in a DBD plasma. The synergy between the plasma and the Ni catalyst was demonstrated by the greatly reduced (<10%) CO2 conversion obtained both when Al2O3 alone was used and when the Ni/Al2O3 catalyst was placed downstream of the plasma (post-plasma catalysis). OES measurements showed the presence of vibrationally excited CO2, CO and other species, indicating the occurrence of excitation and dissociation of CO2 in the plasma. This is in accordance with the results of Parastaev et al [174], who used isotope-labelled CO2 and temperature-programmed plasma–surface reaction techniques to provide evidence that dissociation of CO2 occurred mainly in the gas phase, with CO dissociatively adsorbed on the catalyst and hydrogenated to form CH4.
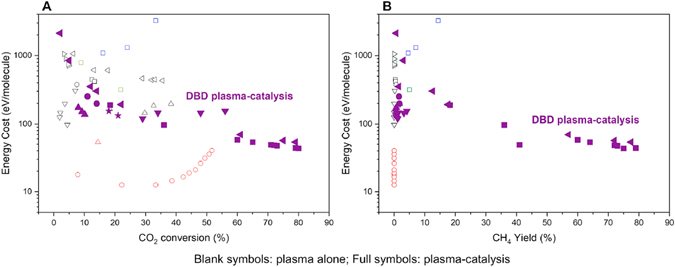
Figure 23. Energy costs for plasma methanation of CO2 against (a) CO2 conversion and (b) CH4 yield. Results are shown for plasma catalysis in DBDs (solid violet symbols), and plasma alone (open symbols) in DBDs (grey), MW plasmas (red) and RF plasmas (green). Reprinted from [231], Copyright (2019), with permission from Elsevier.
Download figure:
Standard image High-resolution imageThe energy efficiency of the plasma processes is shown in figure 23. It is clear that the use of a catalyst improves the energy efficiency and the conversion and yield in DBD reactors. However, the energy cost remains too high, despite the inherent advantages of plasma reactors, such as lower-temperature operation and suitability for coupling to renewable electricity sources. As shown in figure 22, the electron energy in DBDs is preferentially coupled to electronic excitation and dissociation of CO2. The lowest-energy mechanism (vibrational excitation of CO2 to promote dissociative adsorption on the catalyst) is therefore not favoured. It is important to note that the catalysts that are optimal for thermal catalysis are unlikely to be so for plasma catalysis. As noted for NH3 synthesis in section 5.2.1, vibrational excitation of the precursor will shift the volcano curve to weaker binding of the reactants and products. Dissociation of CO2 in the gas phase will favour catalysts suitable for reacting CO with H, rather than CO2.
A possibly more attractive case is the synthesis of methanol

The reaction mechanism for thermal catalysis proceeds via the adsorption of CO2 to produce adsorbed formate (HCOO) or CO intermediates, followed by stepwise hydrogenation reactions. As for NH3 production and CO2 methanation, the reaction is favoured by low temperatures and high pressures because it is exothermic and reduces the number of molecules. However, low temperatures limit the activation of the catalyst, so typically temperatures of 200 to 350 °C and pressures of 17 to 100 bar are used.
Plasma catalysis again offers the possibility of low temperature and atmospheric pressure reactions. Wang et al [233] demonstrated CO2 conversion of 21% in a DBD packed with Cu/Al2O3 catalyst at 30 °C and 1 bar, which is comparable to that reported for thermal catalysis. A feature of the reactor was the use of a water ground electrode to maintain a low temperature in the reactor. The selectivity for methanol (54%) was lower than in thermal catalysis, and the energy cost was around 11.5 MJ mol−1 of methanol (119 eV molecule−1). This is about nine times higher than that for industrial-scale thermal catalysis.
5.2.3. Hydrocarbon conversion
Hydrocarbon conversion includes a wide range of reactions. The most extensively examined is the dry reforming of CH4, the reaction of CH4 and CO2 to produce syngas (a mixture of CO and H2)

The thermal catalytic process has to be carried out at high temperatures, i.e., 900 to 1200 K, to ensure the entropy increase outweighs the enthalpy decrease, giving a negative Gibbs free energy. Unlike CO2 methanation, lower pressures are favoured because the number of product molecules exceeds the number of reactant molecules.
Dry reforming by thermal catalysis has been studied for close to a century, without wide industrial implementation. A particular problem is soot deposition and the resulting catalyst deactivation [6]. A target energy cost for commercial plasma dry reforming to produce syngas of 4.27 eV per molecule of CH4 and CO2 converted, corresponding to an energy efficiency of 60% [6]. The theoretical conversion and energy efficiency, assuming chemical equilibrium, are shown in figure 24. An energy efficiency of 60% is possible at 1500 K, the lowest temperature for which complete conversion can occur.

Figure 24. Chemical equilibrium conversion and energy efficiency for dry reforming of CH4. Reproduced from [6]. CC BY 3.0.
Download figure:
Standard image High-resolution imageThe non-equilibrium nature of non-thermal plasmas allows reactions to occur under conditions that are not thermodynamically accessible. A collection of results for different discharge types is shown in figure 25. DBD reactors without packing have achieved conversions of up to 60%, but at an energy cost of over 20 eV per molecule. GAs have achieved energy costs as low as 0.75 to 2.6 eV per molecule with a conversion of 40 to 80%. Promising results have also been obtained for nanosecond-pulsed discharges, spark discharges and atmospheric-pressure glow discharges.

Figure 25. Energy cost and total conversion for dry reforming of CH4 in different types of plasma. The target energy cost of 4.27 eV per molecule is shown by the green horizontal line. Reproduced from [6]. CC BY 3.0.
Download figure:
Standard image High-resolution imageMost experiments relevant to plasma catalysis have used packed-bed DBD reactors. The review by Mehta et al [221] noted the critical role of the reactor temperature. The results of Kim et al [26], shown in figure 26, demonstrate the point. At low temperatures, for which ΔG > 0, the presence of a plasma, irrespective of the presence of packing or a catalyst, leads to CH4 conversion. In contrast, at high temperatures, for which ΔG < 0, a plasma alone or a plasma with non-catalytic packing is inactive. However, the combination of a plasma and catalyst leads to improved conversion compared to thermal catalysis.
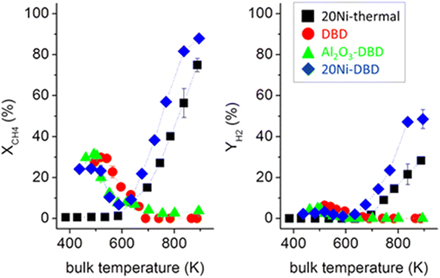
Figure 26. Temperature dependence of CH4 conversion and H2 yield for a DBD plasma reactor under four conditions: packed with 20 wt% Ni on Al2O3 with plasma off, no packing with plasma on, packed with Al2O3 with plasma on, packed with 20 wt% Ni on Al2O3 with plasma on. Reprinted with permission from [26]. Copyright (2016) American Chemical Society.
Download figure:
Standard image High-resolution image
The results illustrate several of the points elucidated in section 5.2. The first is that bond breaking in the plasma is required for thermodynamically uphill reactions to proceed. In this case, the plasma-driven conversion is predicted to be initiated by electron-impact dissociation of CO2 and CH4. The second is that standard catalysts will not be effective for thermodynamically uphill reactions since they will be active for both forward and backward reactions. While different authors have reported an increase or decrease in CO2 and CH4 conversion upon packing the reactor with a catalyst or support, this is usually attributed to the effects of the packing on the discharge characteristics [221].
The final point illustrated is that, for thermodynamically downhill reactions, the vibrational excitation of molecules can increase reaction rates in the presence of an appropriate catalyst. The significant enhancement of CH4 conversion at higher temperatures in the presence of a plasma and Ni catalyst was attributed to the reduction of the energy barrier due to the interaction of vibrationally excited CH4 with Ni sites, based on the dependence of the reaction rate on CH4 partial pressure [235]. Sheng et al [236] reached similar conclusions from a study of a DBD reactor packed with lanthanum-modified Ni/Al2O3 catalyst at 400 to 700 °C. They observed a strong influence of plasma catalysis for 100 kHz excitation and a weak influence for 12 kHz excitation. Noting that the lifetime of bending-mode vibrational excitation of CH4 is 31 μs, they attributed the difference to the influence of vibrationally excited CH4, whose interaction with the catalyst would be much more significant for the 100 kHz excitation, with half-cycle period of 5 μs, compared to 12 kHz with half-cycle period of 42 μs.
For the low-temperature regime, a wide range of products is obtained, including CO, H2, C2–C4 hydrocarbons and oxygenates (methanol, ethanol, formic acid, acetic acid, etc). Plasmas on their own are not selective, although the input ratio of CO2 to CH4 has an influence on the products. However, the combination of a plasma and catalyst does allow the product selectivity to be manipulated. For example, Wang et al [237] were able to alter the selectivity to gaseous and liquid products using Cu/Al2O3, Au/Al2O3 and Pt/Al2O3 catalysts. In particular, Cu/Al2O3 was selective towards acetic acid, and Au/Al2O3 and Pt/Al2O3 allowed the production of formic acid, which was not accessible without a catalyst. This result illustrates the potential of plasma catalysis to directly produce valuable chemicals and fuels, for which the required energy efficiency would be significantly lower (perhaps a factor of 2 to 3) than for syngas production because of the avoidance of an additional step for beneficiation of the syngas [6].
Post-plasma catalysis has been found to be effective for both gliding-arc discharges and atmospheric-pressure glow discharge plasma jet [6]. For example, Allah and Whitehead [238] found an increase in CH4 and CO2 conversion of 20% and 16%, respectively, and a 22% increase in energy efficiency when an NiO/Al2O3 catalyst bed was placed in contact with the afterglow of a GA discharge. It seems likely that the location of catalyst in the afterglow is critical given the short lifetimes of the species produced in the plasma.
6. Technology transfer: successes and challenges
There is a long development path from a laboratory experiment to an industrial process. Success depends on many factors, including scalability, reliability, capital and operating costs, competing technologies and the legislative environment.
The removal of VOCs is the most advanced plasma catalysis application, with devices for odour reduction, for example, commercially available for many years. The scalability of plasma devices is important in such applications; it is relatively simple to tailor the device to the application and location. The TRL of gas conversion applications is much lower, consistent with the broader range of challenges in their development. Nevertheless, the example of ozone production using DBD reactors indicates that success is possible with appropriate reactor optimization.
6.1. Current state-of-play
The 2020 plasma catalysis roadmap [9] presented a table of the TRL of a wide range of plasma catalysis processes. The only processes with TRLs of 6 or greater (indicating that the technology had been demonstrated in an industrially relevant environment) were removal technologies: odour control with TRL 8–9, oxidation of non-halogenated VOCs with TRL 6–7 and NOx reduction by hydrocarbons and by NH3 with TRL 4–7. This reflects the fact that it is typically less challenging to remove impurities from a gas stream than to substantially convert a gas stream.
Commercial devices for VOC removal, particularly odour control, have been available for decades. Systems have been designed and implemented for a wide range of situations, including factories, shops, households and vehicles [1]. Indoor air cleaning devices have been widely adopted in Japan and China [211].
While plasma–catalytic NOx reduction has not been demonstrated on vehicles, a pilot-scale system that combines non-thermal plasma and adsorption of NOx has been demonstrated to meet the most recent International Maritime Organization emissions standards by removing 94% if NOx in the exhaust of a 1 MW marine diesel engine [239]. The plasma was only used using the desorption cycle, and used about 6% of the output engine power.
The development of gas conversion processes is still at the laboratory scale. Conversion of CO2 is at TRL 1–3, and CH4 reforming is at TRL 1–3, depending on the target product, while NH3 synthesis is at TRL 1–2. TRL 3 corresponds to experimental proof of concept. This reflects the challenges in designing reactors to reduce the energy cost while maintaining acceptable conversion yields.
6.2. Challenges for wider implementation
Decisions on the implementation of a particular technology are complex and take into account economic, environmental and other factors. An analysis of the energy costs and CO2 emissions of plasma synthesis of NH3 using different H2 sources demonstrates the difficulties in making such decisions [240]. This is even before capital costs and local factors such as availability of precursors, cost of energy, government incentives, and the price (if any) on carbon are considered. Moreover, there are inevitably competing technologies to consider, both mature and developing. For example, as well as the well-established thermal Haber–Bosch process for NH3 production, the electrolysis-based Haber–Bosch process, which is suitable for coupling to electricity, is also a mature technology. In addition, electrochemical, photochemical and chemical looping processes are being researched [241]. More broadly, there are other hydrogen storage and transport approaches, including pressurization and liquefaction. Other processes, such as CO2 splitting, do not have to compete against established technologies but are just one of many options for the production of fuels and other chemicals from CO2.
Despite this complexity, it is reasonable to state that increasing energy efficiency is the main challenge for the implementation of plasma–catalytic gas conversion. As discussed in section 5.2, energy costs are mostly significantly higher than those obtained with thermal catalysis. The advantages of plasma reactors, such as their suitability for coupling to renewable energy sources, cannot compensate for large surfeits in energy costs.
Energy efficiency is likewise a critical factor for NOx removal. In applications to vehicles, the power has to come from the engine and ideally should be reduced to 5% of the total engine power, which corresponds to about 30 eV per molecule, while achieving 95% NOx removal. While 20 eV per molecule has been achieved in laboratory trials, this is under controlled conditions and for only 70% NOx removal. Achieving the required efficiency is likely to require improved reactor and power supply design, as well as optimization of catalysts for conversion of species produced by plasmas [9].
An important point alluded to in the previous paragraph is that the industrial energy efficiency is from plug to product, and therefore has to be calculated taking into account the efficiency of the power supply. Laboratory-scale studies almost invariably neglect this factor, which rules out, for example, the use of ns-pulsed plasmas.
Reactor design is a critical issue. Packed-bed DBDs are very widely used for plasma catalysis experiments for reasons including ease of construction and their suitability for in-plasma catalysis. However, as shown in figures 21 and 22, the reduced electric field in DBDs is typically about 200 Td, favouring coupling to dissociation and ionization reactions, which require a great deal more energy than vibrational excitation. MW and GA reactors have lower electron energies, but the higher temperatures generally require the catalyst to be placed downstream of the plasma (post-plasma catalysis). This makes them suitable only for catalysis involving longer-lived species such as O3 and NO. Innovative reactor and process design will be required to overcome these limitations. One possibility is pulsing the MW plasma to reduce the temperature. Other examples include the recent proposals to use water as a precursor for plasma–catalytic NH3 production [225, 226], which were discussed in section 5.2.1. The integration of plasma catalysis into electrocatalysis, for example, to benefit electrocatalytic oxidation of CH4 to methanol by using the plasma activation of CH4 to improve selectivity, has also been proposed [2], as has investigating the coupling between surface phonons induced in photocatalysis and vibrationally excited molecules important in plasma catalysis [9].
Scale-up of plasma reactors for gas production has been demonstrated in the case of ozone production for the purification of drinking water, treatment of wastewater and bleaching of paper pulp. By placing large numbers of cylindrical DBD reactors in parallel, the production of hundreds of kg h−1 at concentrations of up to 18% from oxygen and 5% from dry air is routinely achieved. Powers of several MW are routinely used, and a large wastewater treatment plant being built in Montreal, Canada, will require 45 MVA electrical power for the ozone generators alone [242]. For comparison, modern wind turbines are typically designed to produce 2–3 MW, demonstrating the possibility of designing non-equilibrium plasma reactors at scales suitable for coupling to renewable energy sources.
Plasma reactors have important advantages over thermal catalysis processes, including the possibility of operating at or close to ambient conditions, and the ability to rapidly adapt to changes in energy delivery, feed gas composition, etc. If these advantages can be combined with innovative reactor design to improve energy efficiency, then the range of applications in which plasma catalysis is implemented is likely to increase.
Acknowledgment
We acknowldege financial support from the European Research Council (ERC) under the European Union's Horizon 2020 Research and Innovation programme (Grant Agreement No. 810182 – SCOPE ERC Synergy project) and the European Union's Horizon 2020 Research and Innovation programme under the Marie Sklodowska-Curie Grant Agreement No. 813393 (PIONEER).