
Abstract
Infrared IR absorption spectra of melamine-formaldehyde (MF) microparticles confined in an rf plasma are studied at different plasma conditions. Several absorption peaks have been analysed in dependence of plasma power and their temporal evolution. For comparison, the IR absorption spectra of heated MF microparticles without plasma exposition are used to determine the general influence of the temperature on the IR spectra. Measuring the temperature of the particles inside the plasma shows that the temperature is not the only process changing the particles' IR spectra. Chemical changes of the MF particles with increasing plasma power influence the absorption peak structure.
Export citation and abstract BibTeX RIS

Original content from this work may be used under the terms of the Creative Commons Attribution 4.0 licence. Any further distribution of this work must maintain attribution to the author(s) and the title of the work, journal citation and DOI.
1. Introduction
Plasmas with additional micron to submicron sized particles—so called colloidal or dusty plasmas—have been investigated in an increasing number of situations. Naturally occurring dusty plasmas are usually found in diverse environments like the rings of Saturn, in cometary tails or human-made in plasmas of manufacturing processes for e.g. the production of computer chips [1–5]. In technological situations particles formed and grown in low-pressure plasmas often emerge from carbon or silicon containing reactive gases. They usually are in the nanometer to submicron size range. For fundamental studies of colloidal plasmas a typical approach is to use externally manufactured micro- or nanoparticles. One of the most widely used particle material is melamine-formaldehyde (MF) available in a large variety of sizes, typically in the micrometer range.
In general, inside the plasma the particles gain a negative charge from ion and electron fluxes to the particle. This negative charge results in a strong electrostatic interaction between particles. Hence, in such colloidal plasmas the particles can arrange in ordered structures, such as Coulomb crystals [6–8], Coulomb clusters [9–11], or 3D extended dust clouds [12–14]. The ordering process is counteracted by the random thermal motion of the dust particles as expressed by the kinetic temperature of the dust. Hence, the kinetic temperature is an important and widely studied quantity [15–18].
Often, argon is used as a background gas in the plasma discharges. As a noble gas, chemical interactions with the microparticles are expected to be on a far lower level than in reactive gases like oxygen. Nevertheless, it has been reported, that argon plasmas can severely change the surface structure and also the size of particles [19]. Hence, it is of high interest to get an insight into the processes and changes happening to the chemical constitution of the particles during plasma exposition.
Here, we measure the power dependent infrared (IR) absorption spectra of MF microparticles confined in a plasma environment. The results are being compared to a heated sample without plasma exposition to study the influence of the particles temperature on the IR absorption. An additional measurement of the particles temperature in the plasma environment is used to get to know the impact of the temperature on the changes of the particles IR spectra in the plasma. Finally comparing the structure of the different IR absorption peaks, changes in the chemical bonds of the MF particles in the plasma are revealed.
2. Experiment
Using a Bruker Vertex 80v FTIR spectrometer, the IR absorption spectra of MF particles are measured both for particles trapped in a cloud in a gaseous plasma discharge and for dust in the internal sample compartment of the spectrometer under vacuum conditions, but without a plasma. For that purpose, the spectrometer is equipped with a decoupling device and an additional external detector to be able to use an external plasma chamber, see figure 1. This external plasma chamber has an inner diameter of 40 cm. In this plasma chamber, we ignite a capacitively coupled RF discharge (at 13.56 MHz). The MF particles are trapped in the sheath of the discharge. The chamber is equipped with four bigger ports to the side (two for the IR beam with KBr windows, two with regular windows) and a cover with several smaller ports. The lower part of the chamber offers access for power supply, vacuum and gas connections via several additional flanges. A turbo-molecular pump evacuates the device to a base pressure of ∼10−3 Pa. During the operation, a rotary vane pump is used in combination with a butterfly valve and a pressure controller to control the argon gas pressure and flow inside the device. The typical argon gas pressure ranges between 2 Pa and 6 Pa. The argon mass flow is adjusted accordingly to reach these small pressures between 3 sccm and 10 sccm.

Figure 1. Scheme of the experimental setup with the Bruker Vertex 80v FTIR spectrometer, the FTIR decoupling device, the plasma chamber with one large powered electrode and the FTIR detector. The measurements are taken either on sample I trapped in the plasma environment or on sample II in the sample compartment without plasma.
Download figure:
Standard image High-resolution imageIn the plasma chamber, there is one single powered electrode with a diameter of 30 cm. Compared to other dusty plasma experiments, this is a rather large electrode. The goal of this large electrode is to be able to confine more particles in the line of sight of the FTIR spectrometer to enhance the absorption by the dust. The rest of the plasma chamber is grounded. Hence, the capacitively coupled RF discharge, powered by an RF generator with powers in the range of up to 60 W in connection with a matching network, is burning between the electrode and the chamber walls. To confine particles in this plasma, an additional metallic potential barrier of 1 cm height, 28 cm length and 10 cm width is located on the electrode. To insert the particles into the plasma environment a dust shaker is used. A dust cloud is formed and trapped in the sheath of this plasma (dust sample I).
MF particles of 3.93 μm diameter are used for the experiments presented here. The trapped dust in the plasma (sample I) is exposed to different plasma conditions. The different flux of electrons and ions to the dust is expected to result in a different heating and chemical changes of the bulk and surface material of the dust. The FTIR spectra are then recorded for the various plasma conditions.
For measuring the spectra of dust inside the chamber, the FTIR beam is guided under vacuum conditions through the chamber to the external detector. Inside the plasma chamber, the IR beam has a focus of about 10 mm which is positioned about 15 mm above the electrode of the chamber.
A second dust sample (dust sample II) with the same type of particles as the trapped ones is placed on a sample holder in the evacuated internal sample compartment of the FTIR spectrometer (without any plasma). Then, the IR beam is guided through the internal chamber and the dust sample II. FTIR absorption measurements can easily be switched between sample I and II.
The sample holder consists of two KBr windows with a distance of 3 mm and a diameter of 50 mm. A small amount of the dust particles is sprinkled on one of the two windows. Despite the vertical alignment of the windows, a sufficient amount of particles stays attached to the window. The windows are separated from each other by a Teflon ring. The dust sample in the holder can also be heated by resistors attached to the sample holder. The Teflon separator contains two PT-1000 temperature sensors.
To obtain temperature-dependent absorption spectra without plasma, dust sample II is heated from room temperature to about 180 °C by applying different voltages to the heating resistors. The absorption spectra are measured at various temperatures as obtained from the PT-1000 sensors.
We then measure the IR absorption spectra of the particles confined in the plasma as well as the IR spectra of the particles in the internal sample compartment. This way, the measurement of both samples (with and without plasma) can be done nearly simultaneously. Another advantage of using the same FTIR spectrometer is that we use the same IR source and internal beam path setup for both measurements and therefore minimize the risk of uncertainties by using different devices.
3. Results
Here, we present the results of our FTIR absorption measurements of the two dust samples. We start with the spectra of the particles trapped in the plasma, where we measured the absorption as a function of plasma power.
3.1. The IR spectrum of MF particles in the plasma environment
To investigate the behaviour of the MF particles under the influence of the flux of the plasma particles (ions and electrons) on the microparticle, FTIR absorption measurements are carried out with MF particles confined in the sheath of the plasma at different plasma powers in the range from 2 W to 60 W and gas pressures in the range from 2 Pa to 6 Pa. These power and pressure ranges have been found to be suitable to confine a reasonable number of particles in the pathway of the FTIR beam. Figure 2 shows the absorption spectra of the trapped particles (sample I) at an Ar gas pressure of 3 Pa. The interesting part of the spectrum is in the wavenumber range from 1800 cm−1 to 750 cm−1, as shown in figure 2(a). Here, we can see different absorption peaks with a strength of up to 20%. From this, the particle density can be estimated to be of the order of nd = 4 × 10¹¹ m−3. This agrees with other measurements [21].
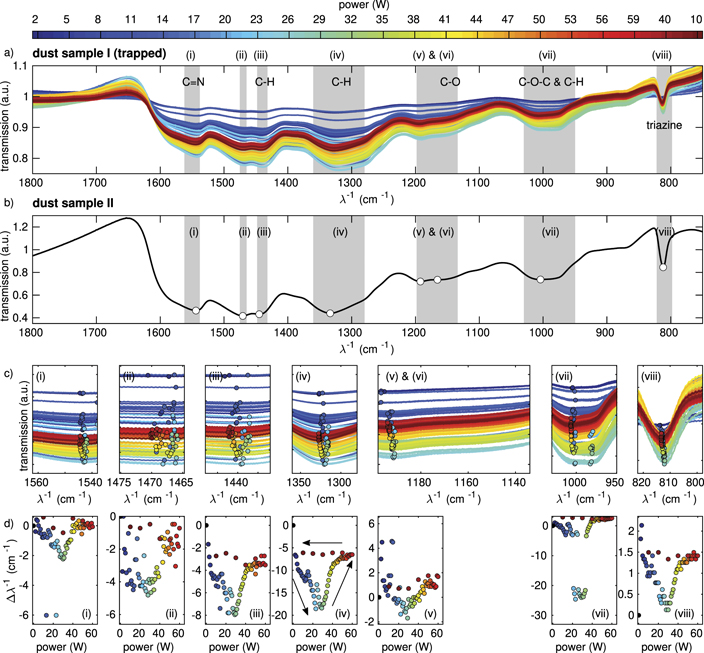
Figure 2. (a) IR spectra of MF microparticles confined in an argon plasma (sample I) at different powers indicated by colours at an argon gas pressure of 3 Pa and (b) MF microparticles in the sample compartment (sample II). (c) Magnified view of the IR spectra in the regions (i)–(viii). The circles denote the minimum positions of the IR spectra for the different plasma powers. (d) (i)–(viii) shift of the minimum position of each corresponding peak of sample I in relation to the position in the sample compartment (sample II taken as 0 W). Corresponding molecular vibrations in (a) from Merline et al [20].
Download figure:
Standard image High-resolution imageThe chemical properties of the individual peaks will be discussed below in more detail. In the general overview, the spectra seem to differ not very much. The absolute transmission values usually change due to different particle numbers in the pathway of the FTIR beam. For comparison, the spectrum of the MF particles at room temperature in the internal sample compartment (sample II) shows a similar absorption, see figure 2(b). We now want to investigate the position of the absorption peaks a little more in detail. Hence, in figure 2(c) we have zoomed into the marked absorption regions (i) to (viii) of figures 2(a) and (b). First, we determine, for each absorption peak, the wavenumber position of maximum absorption. For that purpose, a polynomial of ninth 1 order has been fitted to each peak in the surrounding wavenumber region. From that the position of maximum absorption has been determined for each peak. As mentioned before, the absolute transmission values depend on the actual number of particles in the FTIR beam path. Hence, we focus on the wavenumber position of those peaks. Figure 2(d) shows the shift in the position of the absorption peak with respect to the internal dust sample II (zero position) for each peak.
Generally, we see a significant shift with plasma power variation in the range between 2 W and 60 W. Compared to the peak position at the lowest applied plasma power (2 W), the peaks shift to smaller wavenumbers with plasma power. The strongest (negative) shifts are found for plasma powers between 20 W and 30 W. For powers larger than 30 W, the absolute shift decreases again. At 60 W the peaks have shifted back nearly to the starting position at 2 W. The amplitudes of the shifts differ for all the peaks from about 2 cm−1 for peaks (i) and (viii), about 4 cm−1 for peak (ii), 6 cm−1 for peak (v), 8 cm−1 for peak (iii), 20 cm−1 for peak (iv) and up to 25 cm−1 for peak (vii). This extremely strong shift of peak (vii) is due to the double-well-like structure of the absorption. The rather flat and broad minimum of peak (vii) tilts to the other minimum in the power range between 20 W and 35 W and hence, causes a strong gap in the otherwise rather smooth behaviour of the shift.
After increasing the plasma power to 60 W in rather small steps, we decreased the plasma power back to 10 W in bigger steps. Here we see, that the shift stays rather constant over the whole power range. They do not follow the path during power increase. This hysteretic behaviour hints at non-reversible changes of the particles. Asnaz et al reported that deep grooves are being formed in the surface of plastic particles by plasma exposure [19]. A possible reason for the observed hysteretic behaviour might be that the etched grooves are not refilled with material during the power reduction and hence, a non-reversible process can be assumed. It seems a little counter-intuitive that the shift decreases again for powers above 30 W. Being speculative, one might argue that chemical changes in the lower power range might be cured for higher powers due to the higher plasma activity.
Peak (vi) is clearly identifiable in dust sample II (which is not exposed to the plasma). This peak is hardly discernible in the spectra of the plasma exposed dust sample I. Thus, we have not shown a shift for this peak (vi), see also the discussion in section 3.4.
The influence of the gas pressure of the plasma has also been investigated. We did not observe significant shifts of peaks with gas pressure. For all investigated gas pressures, the shifts of the peak positions with plasma power were very similar.
3.2. The IR spectrum of heated MF particles
It is known that, for materials like MgO and LiF [22] and MF [20, 23, 24], absorption peaks in the IR spectra shift and change structure with increasing temperature. To relate our observed trend of a shift of the different absorption peaks to smaller wavenumbers with increasing plasma power, we now study the influence of an increase of the particle temperature on the shifting of the peaks.
To determine the influence of the temperature, IR spectra of heated dust are measured in the internal chamber (sample II). Therefore, the KBr windows and the dust in between are placed into the internal sample compartment of the FTIR spectrometer and heated by applying a voltage to the mounted resistors to around 180 °C. While heating up, several spectra are taken while measuring the sample temperature with a PT-1000 sensor. Figure 3 shows the results of these measurements. Similar as for the particles in the plasma environment, the interesting spectral range is again between 1800 cm−1 and 750 cm−1. Here, the most prominent peaks are marked again and are further analysed as described in the previous section.
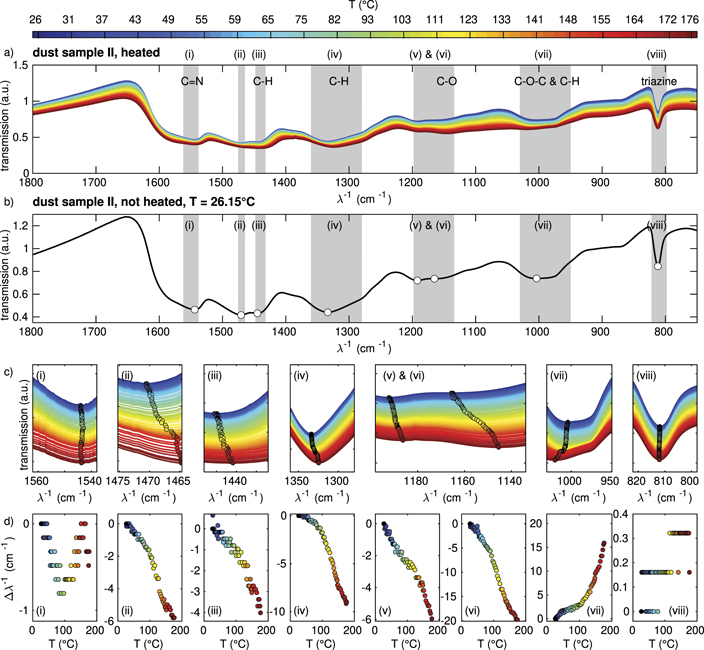
Figure 3. IR spectra of MF microparticles in the internal sample compartment (sample II) at (a) different temperatures and (b) at room temperature. (c) Magnified view of the IR spectra in the regions (i)–(viii). The circles denote the minimum positions of the IR spectra for the different plasma powers. (d) (i)–(viii) shift of the minimum position of each corresponding peak in relation to the position at room temperature.
Download figure:
Standard image High-resolution imageAs can be seen in figures 3(c) and (d), some of the peaks' movement show a clear dependence on the temperature [peaks (ii)–(vii)], while for other peaks [(i), (viii)] only marginal shifts are observed.
Peaks (ii)–(vi) show a rather similar trend: the position of minimal transmission shifts towards smaller wavenumbers with increasing temperature. Again, the strength of this shift is different and ranges from 4 cm−1 for peak (iii) to a maximum of 20 cm−1 for peak (vi) in the temperature range from 26 °C to 180 °C.
Contrary to the peaks (ii) to (vi), peak (vii) shifts towards higher wavenumbers with increasing temperature. This will be further discussed in section 3.4.
Comparing the IR spectra of the heated and the plasma-exposed samples, it can be seen, that the strength of the shift correlates in both samples. In both samples, peak (iv) shifts most strongly, for peaks (ii), (iii) and (v) moderate shifts are observed. Peaks (i) and (viii) that have nearly no shift when heated also show only weak shifts in the plasma environment. In the heated sample peak (vi) can be identified and tracked with temperature in contrast to the plasma-exposed situation.
These results imply, that the particle temperature may cause some of the changes in the absorption spectra in the plasma environment (figure 2). Hence, it is necessary to determine the particle temperature inside the plasma environment to judge the influence of temperature and power.
3.3. Determination of the particle temperature inside the plasma
We have determined the particle bulk temperature using the fluorescence of Rhodamine B (RhB)-doped MF particles (d = 3.87 μm). This technique has been previously applied to measure dust temperatures in the plasma [25, 26]. There, one exploits that the spectral width of the fluorescence light peak increases with bulk temperature. For such temperature measurements in the plasma, the doped particles are dropped into the discharge just as the regular MF particles. A 532 nm laser sheet illuminates the particles, and excites the fluorescence at around 580 nm. The resulting light emission is measured with a USB-spectrometer. For each measurement a background scan without laser illumination and a sample scan with laser illumination is recorded. We then use the difference of sample spectrum and background spectrum for further analyzing the flourescence emission peak. The absolute height of the fluorescence signal decreases with increasing temperature, while the general width of the peak increases with increasing temperature [25]. Hence, we determined the FWHM as a measure for the temperature by fitting a skew normal 2 distribution to the peaks intensity
with the fit parameters pi and the complementary error function erfc(λ). The FWHM is then derived from p3 as

To extract the temperature from the FWHM of the fluorescent signal, a calibration measurement with defined temperatures has to be done. Killer et al [26] dispersed the RhB doped MF particles in glycerol and water, used a heating plate with a magnetic stirrer and illuminated the solution with a laser of 532 nm. As they have shown, the resulting FWHM depends on the used solvent glycerol or water. To make our calibration measurement as comparable as possible with the measurement in the plasma environment, we use our heatable sample holder from the FTIR measurements, where the particles are only in contact with the surrounding air and the KBr windows. We then illuminate the RhB-doped MF particles in between the KBr windows with the same laser as for the measurements in the plasma and measure the temperature depending flourescence spectrum in the range from 20 °C to 160 °C, see figure 4. By comparing the plasma spectral width of the fluorescence of the particles trapped in the plasma and the externally heated particles, a bulk temperature can be obtained, see figure 5. Here, we see, that the temperature increases from about 50 °C at 5 W to about 100 °C at 50 W.
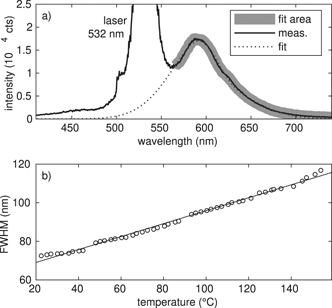
Figure 4. (a) Measured emission spectrum of RhB doped MF particles in sample holder II enlightened by a 532 nm laser. In addition to the original measurement the fitted skew normal distribution and the corresponding fitting area are shown. (b) Resulting FWHM in dependence of the temperature from the calibration measurements with linear fit.
Download figure:
Standard image High-resolution image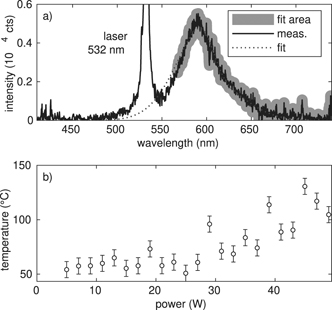
Figure 5. (a) Emission spectrum of RhB doped MF particles in the plasma environment enlightened by a 532 nm laser-measurement, fit and fit area. (b) Obtained particle temperatures in dependence of the plasma power the fluorescence method.
Download figure:
Standard image High-resolution imageHowever, combining both FTIR measurements (sample I and II) to determine a temperature from these by using the heated sample (II) as a calibration, one would find significantly higher temperatures. For example, looking at peaks (iii) and (iv) in figures 2 and 3, we see a stronger shift of the peaks with the power than with the maximum temperature of 180 °C. This would indicate particle temperatures exceeding at least 200 °C. Now, one might argue that the temperatures obtained by both methods might be different, like one being the surface and one rather the bulk temperature. However, the particles are transparent in the visible wavelength range and the fluorescent dye is distributed in the particle [27]. Hence, the fluorescence should indicate the temperature of the particle bulk. For the FTIR measurements, the wavenumber range of interest corresponds to wavelengths of 5 μm to 13 μm. We assume, that the IR wave penetrates into the particle of the order of one wavelength. With a particle radius of roughly 4 μm that means, that the IR wave reaches through the whole particle and bulk properties are measured here as well. Hence, the seen changes in the IR absorption cannot only be described by changes in the particle temperature.
3.4. The structure of the peaks
In addition to the temperature-induced shifts of absorption peaks we now take a deeper look into the (chemical) structure of the peaks. For that purpose, we have normalized the single peak structures in their wavenumber interval where the respective maximum transmission is set to 1 and the minimum transmission is set to 0. The normalized transmission is shown in figure 6. Here, the different absorption peaks are represented by rows (peaks (ii) and (iii), as well as (v) and (vi) are combined). The left column shows the normalized absorption peaks of the heated sample II. The second and third column show the absorption peaks of sample I in the plasma environment in dependency of the applied power. For the sake of clarity, the power behaviour is split into two columns. The second column shows the measurements in the power range from 2 W to 23 W and the third column for powers between 24 W and 60 W. In the following, we will discuss the change of the structure of the peaks:
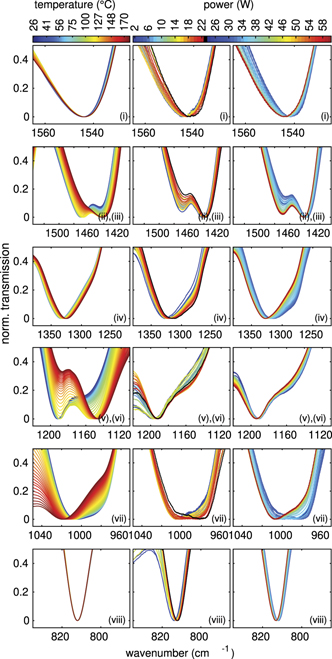
Figure 6. Structural analysis of the absorption peaks of the temperature resolved measurement (first column) and the power resolved measurement (centre and right column).
Download figure:
Standard image High-resolution imageFor peak (i) the peak structures look quite similar. We see a small shift of the peak with temperature. For the measurement in the plasma environment with powers in the range from 2 W to 23 W a stronger shift with increasing plasma power can be seen. The shift is in the same direction as with temperature. For larger powers, this behaviour is turned around. The shift goes back towards larger wavenumbers again. The main shift seems to happen in the range from 24 W to 35 W. Above this power, the peak does not shift significantly anymore. This peak can be attributed to the C=N bond in the central triazine ring [23]. Here, bigger changes in the structure are not expected since large chemical changes of this central part seem unlikely. Nevertheless, the shift of the absorbance with plasma power is somewhat stronger than it would be expected from a change in the temperature, here. This could hint at changes to the chemical groups attached to the central ring.
Peaks (ii) and (iii) form a double peak structure. In the heated sample II it can be seen, that peak (ii) reduces in strength with rising temperature while peak (iii) becomes the dominant peak. In the plasma sample I peak (iii) is dominant for all powers and does not change that much with power. However, peak (ii) is getting less prominent with increasing power up to 23 W and is getting more prominent for higher powers, again. Both absorptions are caused by methylene (CH2) and methyl (CH3) vibrations. Although both bands somewhat overlap, the CH2 absorption can be attributed to the peak with the higher wavenumber and the CH3 to the peak at the lower wavenumber [28]. During heating the CH2 bending seems to nearly vanish while during the plasma exposition both absorption peaks are present. It is interesting to note here that the peak structure even at the lowest plasma powers differs quite clearly from the heated sample. This hints at immediate chemical changes upon plasma exposure.
Similar to peak (i), peak (iv) shifts slightly towards smaller wavenumbers with increasing temperature. In the plasma sample I, this shift can also be seen in the lower power interval with increasing power. In the higher power interval, this shift goes back again with increasing power. In addition, around a plasma power of 23 W, a knee at about 1275 cm−1 develops. This knee does only barely show up in the heated sample II. The main peak structure can be attributed to aromatic amines CAr−N stretching vibrations in connection with methylene ether or methylene bridges [23]. The formation of the knee structure also clearly indicates chemical changes during plasma exposure.
In the heated sample II the peaks (v) and (vi) form a double peak structure very similar to peaks (ii) and (iii). With increasing temperature, peak (v) is getting less prominent, while peak (vi) evolves from a knee structure to the more prominent peak in this interval. For the plasma measurements (sample I), peak (v) stays the prominent (only) peak for all powers. Peak (vi) does only appear as a knee which is even less prominent at strongest prominence (23 W–24 W) than for the smallest temperature in sample II. This rather little knee gets clearer for powers around 23 W, and vanishes for higher powers, again. Here, peak (v) at 1190 cm−1 corresponds to a secondary amines C–N stretch [28]. Peak (vi) at 1150 cm−1 indicates the presence of CR−N stretching vibrations and asymmetric C–O–C vibrations. These only occur dominantely during the heating, while during plasma exposition, an absorption band can hardly be indentified. It should be noted that the C–O–C peak at 1150 cm−1 occurs only in MF cured at low temperatures [24]. These C–O–C bridges seem to be destroyed immediately at plasma exposure.
For low temperatures, peak (vii) shows a rather broad structure with a minimum in transmission at roughly 1010 cm−1 in addition to a small, but noticeable knee at 980 cm−1. With increasing temperature, this knee gets less prominent and the whole structure shifts towards larger wavenumbers. This is the only peak structure, where a shift towards larger wavenumbers can be seen. In the plasma sample I, it can be seen, that the knee at about 980 cm−1 gets more prominent with increasing power up to 23 W and decreases again for further increasing power. Due to this more prominent knee, the direction of shift with temperature is in the opposite direction to the general behaviour of the shift with the plasma power. The attributed C–O stretching vibration at 990 cm−1 indicates a loss of methylol functions with increasing temperature. In contrast, with increasing plasma power, it seems like methylol functions increase as well until the break point 23 W. For higher powers a loss of methylol functions can be detected, again [23]. It can be speculated that the missing C–O bonds of peak (vi) partially show up in peak (vii).
The triazine absorption, peak (viii), does not show any changes with the temperature. However, in the plasma sample I, peak (viii) shifts with increasing plasma power up to 23 W towards smaller wavenumbers and shifts back to larger wavenumbers for larger plasma powers, as seen in most other peaks as well. However, this shift is very small, but still larger than with heating. This again indicates changes not to the ring, but to groups attached to the triazine ring.
Concluding on this structure analysis, it can be seen, that the sample I in the plasma environment generally shifts with increasing power up to 23 W towards smaller wavenumbers and shifts back for higher wavenumbers. Changes in the appearance in the structures (ii) and (iii), as well as (v) and (vi) can be explained by the change in the temperature for powers up to 23 W. For higher powers, chemical processes seem to be more effective. Although the temperature has been measured to be rising for powers above 23 W, the shift goes generally back again and does not correlate with the temperature anymore. Hence, we assume, that the influence of the changing of the absorption of the particles is not only temperature induced, but also by plasma chemistry. Especially the changes in peaks (ii)–(vii) indicate chemical changes in the methylene ether and methylene bridges and C–O–C bridges. The absorption bands associated to bindings in or close to the central triazine ring change only little [peaks (i), (iv), (viii)], while the surrounding bindings do change significantly.
Previous studies have shown, that the plasma has significant influence on the particles' size and density distributions. For example, Asnaz et al investigated on dusty plasmas with PMMA microparticles [19]. Using different diagnostics, they found not only a decrease of the particles' radius, but also a strong loss of the mass density of the particles with time. Further analysis revealed a roughening of the surface structure, while the mass density of the particle core did not change significantly. An explanation for this behaviour is the impinging of ions accelerated in the plasma sheath. Those ions have a rather short penetration depth of only a few nanometers, but, nevertheless, form grooves in the particles' surface of up to 1 μm, as has been shown in experiments with PMMA foil exposed to non-reactive plasmas [29]. Due to their rather physical than chemical behaviour, we assume that similar processes occur in our experiments as well, although the used material differs from our used MF particles.
But also for experiments with MF microparticles changes in the mass and size have been detected [26, 30–32]. Kohlmann et al found etching rates from −1.25 nm min−1 to −1.69 nm min−1 for MF particles causing the particles to shrink [32].
In experiments performed by Killer et al [26], a quadrupole mass-spectrometer has been used to investigate on the outgassing/etching components of plasmas with MF particles. They have shown that molecules containing nitrogen, oxygen and carbon are being detected during plasma exposition of the particles. The detected changes in the IR spectra of our measurements can be easily attributed to those base elements and hence, underline our results. Changes in the density of the molecules appeared right after the injection of the MF microparticles. The biggest change of the density for all outgassing/etching components occurred within a time scale of less than 5 min after particle injection [26]. Hence, an additional investigation of the temporal evolution of the IR spectra seems reasonable.
3.5. Temporal evolution
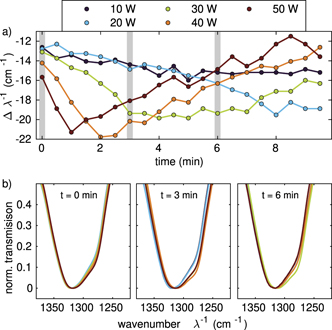
Next to the variation of the plasma power and gas pressure in the discharge, it is interesting to investigate the time evolution of the processes mentioned before. Hence, we repeatedly measured the IR absorption spectra at defined time intervals (every 30 s) for different, but constant plasma powers. Exemplarily, we have chosen peak (iv) to display the results in figure 7(a). Here, we determined the position of minimal transmission in the same way as in section 3.1. As can be seen, the strongest shift is reached right after 1 min of plasma exposition at the highest applied plasma power of 50 W. For lower applied powers, this point is reached later: for 40 W after 2 min, for 30 W after 4 min and for 20 W after 8 min. In the measurement with an applied power of 10 W the minimum has not been reached within the 10 min measurement interval. In addition to the faster reactions with higher applied plasma powers, we also determined, that the absolute shift at minimal transmission is also depending on the power: the higher the power, the stronger the shift at minimal transmission.
Figure 7. (a) Temporal Evolution of the shift of peak structure (iv) at different applied plasma powers. (b) Structural analysis of peak (iv) at different applied plasma power at t = 0, 3, 6 min.
Download figure:
Standard image High-resolution image
In addition, we have looked at the normalized absorptions in analogy to section 3.4 for the different applied powers at 0 min, 3 min and 6 min, see figure 7(b). At 0 min, all structures look rather similar, only for the higher powers the knee at 1280 cm−1 is slightly stronger pronounced. This behaviour can be seen more clearly at 3 min, where for the two lowest powers (10 W and 20 W) the knee is still not clearly detectable, while for the higher powers this knee is strongly distinct. Here, we can see, that with increasing power a gain of methylol can be identified. After another 3 min, the most prominent knee is seen for the medium power of 30 W while for the lower powers the methylol knee did not form yet and for higher powers already formed back.
However, using both methods, it can be seen, that the processes changing the materials chemical structure is both time and power dependent.
4. Summary
We have presented measurements of IR absorption spectra of MF microparticles inside a colloidal plasma. The changes of the absorption with increasing plasma power have been studied. It has been shown, that single absorption peak positions shift and alter their structure during plasma exposition. These changes occurred until a defined applied plasma power and were mainly reversed for higher plasma powers. Comparisons of IR absorption measurements with heated microparticles without plasma exposition have shown similar shifts and changes in the peaks' structures with rising temperature, although a reversal of this behaviour could not be indentified in the range of reasonable temperatures. An additional measurement of the particles' bulk temperature showed a general trend of increasing temperature of the particles for increasing plasma powers. Taking this into account, it can be shown, that the temperature is not the only factor for changes in the particles absorption features. The analysis of the chemical changes altering the MF material during heating and plasma exposition revealed a change of the materials chemical composition that shows only little variation of bonds around the central triazine ring of MF but rather the surrounding amine groups and C–H compounds. Especially the reversal of the features with further increasing plasma powers cannot be explained by changes in the temperature. Here, we expect other plasma chemical, etching and outgassing processes to be accountable for the changes.
Acknowledgments
This work was financially supported by the Deutsche Forschungsgemeinschaft via Project DFG 1534 Me8-1. We would also like to thank P Druckrey for the technical support in the preparation phase of the experiments.
Data availability statement
The data generated and/or analysed during the current study are not publicly available for legal/ethical reasons but are available from the corresponding author on reasonable request.
Footnotes
- 1
Due to the peaked and rather asymmetric geometry of the peaks, ninth order polynomial fits have been used. By reducing the inspected interval, the order of the polynomial fit can be reduced as well, but this does not have an effect on the determined peak position.
- 2
We have fitted differently modified normal distributions to the data. This skew normal distribution has empirically been found to be best fitting for the fluorescent signal.