

Abstract
A nanosecond-two-photon absorption laser-induced fluorescence (ns-TALIF) technique was employed to investigate the transients of a strongly emissive, pulsed microwave discharge. We analysed the conditions that have to be fulfilled in order to use the TALIF intensities measured with the laser central frequency tuned to the absorption peak instead of the fully integrated laser excitation spectrum absorption for measuring N-atom densities. We demonstrated the validity of the method under our conditions and applied it to the straightforward monitoring of N-atom densities during the transients of a pulsed ECR plasma. In particular, we demonstrated the existence of an unexpected increase in N(4S) atom density of about 10% at the early stage of the transition from high- to low-power phase. Using a self-consistent, quasi-homogenous plasma model encompassing a detailed state-to-state kinetics, a thorough analysis of the N-atom and N2(B) kinetics was carried out and enabled this enhancement to be attributed to surface de-excitation of N(2D) and N(2P) atoms. The rise of the N(4S) atom density can serve as an indicator of the concentration of N(2D) and N(2P) atoms in the discharge.
Export citation and abstract BibTeX RIS
1. Introduction
The monitoring of N-atom density in discharge plasmas and plasmas post-discharge has received much attention from many research groups. This interest was motivated by the variety of applications that would benefit from the development of effective high-yield N-atom sources. These include material processing [1–3], biomedical applications [4, 5] and nitrogen fixation [6, 7].
The development of the two-photon absorption laser-induced fluorescence (TALIF) technique [8, 9] brought many important improvements to the experimental determination of atomic densities in terms of space- and time-resolution, accuracy and flexibility. Two TALIF schemes were proposed for the N-atom. The first one makes use of the [(2p3) 4S0, (3p) 4D0, (3s) 4P] excited state system with a two-photon absorption at 2 × 211 nm and a subsequent fluorescence at 869 nm [8], while the second one makes use of the [(2p3) 4S0, (3p) 4S0, (3s) 4P] system with a two-photon absorption at 2 × 206.67 nm and subsequent fluorescence lines at 742.364, 744.230 and 746.831 nm [10]. The latter system is generally preferred due to a larger two-photon absorption cross-section and more easily detectable fluorescence [11]. Whatever the adopted system, the use of TALIF to monitor absolute N-atom density requires calibration. While early calibration experiments were performed using NO titration on a dedicated setup [12], a straightforward and reliable calibration method based on the use of the TALIF signal in Kr was proposed two decades ago [13]. In fact, Kr is a rare gas that provides a TALIF system, i.e. [(4p6)1S0, 5p'[3/2]2, 5s[3/2]1], with wavelength values for laser two-photon absorption (2 × 204.13 nm) and fluorescence (587.09 nm) that are similar to those of the N-atom. This method was successfully used for space- and time-resolved measurements of the absolute N-atom density in a variety of moderately- emissive plasmas and plasmas post-discharge [14–25].
Surprisingly, despite this notable success, achieving N-atom absolute density measurements in strongly emissive nitrogen plasmas remains a challenging task from an experimental point of view [16, 17, 26]. As a matter of fact, N-atom fluorescence takes place inside the emission domain of the first positive system (FPS) of molecular nitrogen. Even though the N-atom fluorescence (742–746 nm) occurs between the N2 FPS band-heads located at 738 and 750 nm, the emission from the FPS remains very strong over the whole spectral range of N-atom fluorescence (742–746 nm) (cf figure 2 of reference [11]). It is therefore often very difficult to extract the fluorescence signal in strongly emissive non-equilibrium nitrogen-containing plasma [16, 26]. The situation is even more critical when measurements are performed in a large strongly emissive plasma since the FPS emission comes from a much larger plasma volume as compared to the fluorescence volume. Several solutions have been proposed to circumvent this issue. The first makes use of spatial and spectral filtering around the probed volume and the fluorescence wavelength, respectively [11, 16, 18]. Unfortunately, although this approach usually results in the decrease in the FPS emission, it also leads to a decrease in the fluorescence intensity, which introduces significant uncertainty in the measured value of the N-atom density. The second approach used to get rid of the FPS emission consists of operating the plasma in a pulsed mode and performing TALIF measurements under post-discharge conditions during the plasma-off phase [18, 26, 27]. The N-atom absolute density in the plasma-on phase is estimated by time-extrapolating the absolute density values determined during the post-discharge phase. In this case, it is usually assumed that the N-atom depletion mechanism is driven by a diffusion/wall recombination process [27]. Besides the uncertainty that may result from the extrapolation procedure, the validity of this approach requires the absence of fast kinetic effects that alter the N(4S) density during the early stage of the plasma-off phase. For instance, the authors of reference [17] have clearly shown that the change in the discharge characteristics, electron density and temperature, etc, when transitioning from the plasma-on to the plasma-off phase in pulsed microwave plasma can yield unexpected N(4S) time variations during the very early post-discharge phase. In such a situation the determination of plasma-on N-atom density by extrapolating the time evolution of the N-atom density during the post-discharge phase may not be valid. This shows that direct measurement of N-atom density during the plasma-on phase is still needed for such strongly emissive discharges.
A widely used method of performing atom density measurements by TALIF is to estimate the temporally and spectrally integrated fluorescence signals of the atoms [27–29]. This means that one measurement will require temporal acquisitions from several laser shots, the laser frequency being varied systematically around the peak excitation frequency of the atom. The obtained time integrals must be further spectrally integrated [28]. This method is very robust and accurate, and we refer to it as the full excitation method (FEM) in the paper. One of the drawbacks of the FEM is that it is highly demanding when making time-resolved measurements as is the case for the pulsed plasma considered in this study. This is the reason why some authors measure atomic densities from a single laser shot with the laser central frequency tuned to the absorption peak [28]. We refer to this as the peak excitation method (PEM) in the paper. In principle, the PEM can only yield the N-atom density if the fluorescence at the absorption peak varies linearly with the spectrally integrated fluorescence.
The validity of the PEM has been mentioned only by few authors for very specific situations where the spectral integral may be easily obtained from the peak value [28, 29, 30]. Note that almost all the works published on nitrogen plasma use the FEM [8–15]. Fluorescence signals at the absorption peak were used in [16] to determine the N-atom densities in highly emissive discharge conditions, for which the use of frequency-integrated laser excitation spectra was very difficult. However, no detailed assessment of the validity of the approach was provided. To the best of our knowledge, there has been no general and explicit investigation, assessment and validation of the PEM approach.
Therefore, the present paper will explicitly discuss and investigate the conditions permissible for using the PEM. We apply this method to perform time-resolved measurements of the N-atom absolute density in a low-pressure, high-density, pulsed ECR discharge that is excited with magnetized dipolar sources [31, 32]. These measurements were performed along with optical emission spectroscopy (OES) and a state-to-state kinetic model in order to investigate the processes that govern N-atom and N2(B) excited states kinetics during the transients in the pulsed ECR plasma.
The article is organized as follows. The experimental setup used is presented in section 2. In section 3 we show how the methodology generally used to infer an absolute atom density from frequency-integrated laser excitation spectra can be simplified provided that some constraints on the atomic absorption line broadening are satisfied. We also discuss how the time and frequency profiles of the fluorescence signals are processed to properly filter out the strong background emission and determine the N-atom density during the plasma-on phase. The results are discussed in section 4 where the PEM is first validated by comparing the resulting N-atom density values with those obtained using the FEM. We then use the PEM along with OES measurements to determine the N(4S)-atom density in the ECR plasmas as a function of the peak power and to investigate the processes governing the N-atom and N2(B) excited states kinetics during the transients of the pulsed ECR plasmas under investigation. The interpretation that may be drawn from our measurements along with the comparison with other published works further validate the simplified approach proposed in this paper for non-equilibrium nitrogen-containing plasmas that show moderate change in the gas temperature.
2. Experimental setup
2.1. The plasma source
The microwave (MW)-assisted plasma was generated using a commercial ECR source (Sairem Aura-Wave) detailed in [33]. The magnet is placed on the plasma source such that the magnetic field ensuring the ECR regime is directed toward the center of the reactor chamber, thus minimizing the electron losses at the walls. The magnetic field has an intensity of 0.0875 T and the resulting plasma has a toroidal shape (figure 1). The MW power is supplied through a coaxial feed from a solid-state MW generator (Sairem GMS 200) that delivers a maximum power of 200 W. The operating MW frequency was tuned between 2.4 and 2.5 GHz in order to achieve optimal impedance matching between the source and the discharge system. The plasma may be operated in both continuous and pulsed modes. The pulsed mode regime makes use of a square waveform power pulse and is characterized by the pulse period, the peak power and the duty cycle which represents the ratio of the high power phase duration to the pulse period. The plasma source was pulsed at the laser frequency of 10 Hz and the pressure was fixed at 20 Pa in all the experiments of this work.
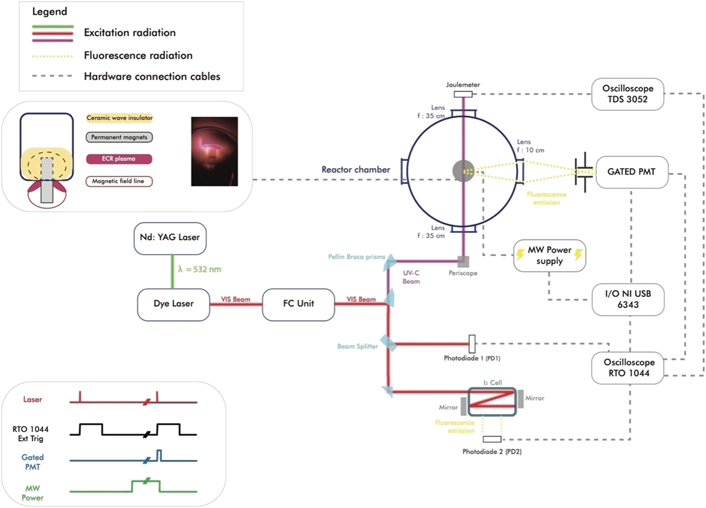
Figure 1. Experimental setup.
Download figure:
Standard image High-resolution imageThe source was embedded in a 100 mm diameter stainless-steel six-way cross and was placed on a specifically designed flange at the top of the cross. Three flanges were dedicated to optical viewports. The laser beam enters and exits the plasma reactor through two fused silica viewports (90% transmission at 205 nm). The fluorescence was collected perpendicularly to the laser beam through a borosilicate viewport. A metallic grid was placed at each viewport in order to prevent MW leakage outside the cavity. The vacuum was obtained using a set of turbo-molecular and rotary pumps (Edwards EXT75DX and Pfeiffer Duo 6M), allowing a residual pressure of 10−5 Pa to be achieved. The working pressure in the chamber was monitored using a capacitive gauge (Pfeiffer CCR363) working in the range 0.133–1333 Pa. The gases were injected in the reactor using mass flow controllers (Bronkhorst EL flow), the flowrate being set at 5 sccm.
2.2. Nanosecond-TALIF setup
The characterization of the pulsed MW plasma by means of a nanosecond-two-photon absorption laser-induced fluorescence (ns-TALIF) diagnostic was carried out using a dye laser pumped by a pulsed Nd:YAG laser, the TALIF signal being acquired with a gated photomultiplier tube. In the following a detailed description of each component of this setup is given (figure 1).
2.2.1. Laser system
The ns-TALIF spectroscopy was performed using a tunable dye laser (SirahLasertechnik Cobra-Stretch) pumped by the second harmonic of a 500 mJ pulse−1 Nd:YAG laser (Spectra-Physics Quanta-Ray Lab-Series 170-10). The dye laser beam was subsequently processed by two Barium borate (BBO) crystals, which yielded a laser beam with three harmonics that were separated using two fused silica Pellin–Broca prisms. The desired third harmonic that may be tuned between 204 nm and 207 nm was spatially selected by the Pellin–Broca prisms. A typical energy value obtained for this harmonic is 2.5 mJ pulse−1. The laser wavelength was systematically calibrated during LIF experiments using an iodine cell.
The obtained pure UV-C radiation was shifted vertically by means of a periscope and then focused with a 35 cm focal length lens at the center of the reactor chamber. In order to measure the laser energy, the beam exiting the chamber was collimated and collected with a calorimeter (Coherent J-10MB-LE), which was connected to an oscilloscope (Tektronix TDS 3052, 500 MHz, 5 GS s−1).
2.2.2. Fluorescence collection system
One of the difficulties encountered with the investigated discharge is the very high level of the background emission that often obscures the relatively weak TALIF signal. The collection of N-atom fluorescence was therefore performed with a photomultiplier tube that allows for gated operations (Hamamatsu H11526-20-NF) and provides a linear regime up to 30 mA current. However, this system does not offer an option to remove the continuous component of the plasma background and extract the fluorescence signal by using convenient RC filters. A focusing lens (f = 10 cm) in a 4f configuration along with a 600 μm slit, and appropriate band-pass filters, were used to limit the probed volume, and the wavelength range to the fluorescence domain, respectively. With this configuration, the amount of background emission collected by the photomultiplier tube is suppressed, and the TALIF signal-to-noise ratio (S/N) is improved.
The anticipated time-resolved TALIF experiments require the synchronization of the microwave power pulse that ignites the plasma, the laser source that generates the fluorescence, and the gated photomultiplier tube that collects the fluorescence signal. For this purpose, the whole system was triggered using the visible component of the dye laser that was directed to a photodiode (PD1, ThorlabsSM05PD2A) connected to a 4 GHz, 20 GS s−1 oscilloscope (Rohde & Schwartz RTO 1044). The oscilloscope converts the nanosecond signal received from the photodiode to a 1 ms signal that triggers a multifunction I/O device (National Instruments USB 6343, 500 kS s−1, 1 MHz). This device generates the triggers for the plasma and the photomultiplier tube. Actually, for a single TALIF measurement, two laser pulses are needed: the first is to trigger the system and the second is needed to generate and monitor the fluorescence signal. Therefore, a delay is imposed between the triggering laser shot and the 5 μs photomultiplier tube gate so as to capture the whole 400 ns fluorescence signal (see figure 1). Similarly, the delay between the triggering laser shot and the microwave pulse is varied so as to explore the temporal evolution of the plasma.
The control of the whole platform, along with the signal acquisition and data processing was performed using a dedicated LabVIEWTM application.
A typical TALIF experiment performed in the frame of this work consisted of scanning the laser frequency (νl) around 206.67 nm and 204.13 nm for the N-atom and the Kr-atom, respectively, and acquiring for each value of νl: (a) the time-resolved fluorescence signal  recorded during a time duration dt around t, i.e. during (t − dt/2, t + dt/2), generated by the laser radiation in the frequency range (νl − dνl/2, νl
+ dνl/2), (b) the laser pulse energy signal El, and (c) the iodine fluorescence signal used for wavelength calibration.
recorded during a time duration dt around t, i.e. during (t − dt/2, t + dt/2), generated by the laser radiation in the frequency range (νl − dνl/2, νl
+ dνl/2), (b) the laser pulse energy signal El, and (c) the iodine fluorescence signal used for wavelength calibration.
3. N-atom absolute density measurement
3.1. N-atom density determination using Kr calibration
We have used the TALIF scheme proposed by Bengtsson et al [10] that shows much higher sensitivity [11] than the very first scheme proposed by Bischel et al [8]. In this scheme, a N-atom in the (2p3)4
 ground state, denoted as N in the following, absorbs two photons produced by a laser pulse centred around 206.67 nm, and undergoes an electronic transition to the (3p)4
 excited state hereafter denoted N*. Assuming that the laser–atom interaction is dominated by the two-photon absorption, the density of the produced excited state is directly related to the offset frequency δνN = 2νl − νN where νl and νN are the laser central frequency and the atomic transition frequency of the absorption line, respectively. After the laser pulse, N* undergoes a first-order de-excitation through radiative decay and collisional quenching. The radiative de-excitation to the (3s)4P1/2,3/2,5/2 degenerate state produces three fluorescence lines at 742.364, 744.230 and 746.831 nm. Thus, during the de-excitation phase just after the laser pulse, the N* density follows an exponential decay, with a time constant
  , Ai,3p→3s being the Einstein coefficient of the ith radiative de-excitation process [34] and Q being the rate of collisional quenching of N*. The resulting incremental time-variation,
  , during dt, of the instantaneous density of the excited state,
  (νl ± d(νl), t), resulting from a laser pulse centred at a laser frequency νl ± d(νl), corresponding to an offset frequency δνN ± d(δνN), can be expressed as:
where  and
and  are the two-photon statistical factor and the two-photon excitation cross-section (m4) for the 2p → 3p transition at a frequency νN, respectively. Il and
  are the radiant exposure (J m−2) and the normalized time profile (s−1) of the laser pulse.
  is the statistical overlap factor between the nitrogen absorption line and the normalized laser line such that
  .
.  also represents the laser energy fraction that is actually used to excite the atoms.
The measured fluorescence signal  during a time interval dt is proportional to the instantaneous density of the excited state
  as follows:

with Ti,3p→3s the transmittance of the optics used for collecting the fluorescence signal and ηN the sensitivity of the sensor over the spectral width of the fluorescence signal. Kg is a geometrical factor that depends on several optical parameters that are difficult to estimate, e.g. the probed volume and the solid angle of the fluorescence volume subtended on the sensor. This factor shows the same value for N and Kr TALIF systems.
Substituting  by its value as a function of
  given by equation (2) in equation (1), and integrating over a long time period, one gets:
where El is the laser pulse energy recorded by the photodiode such that Il
= El/S, S being the cross-section of the laser beam. The factor  is the ratio of the number of detected fluorescence photons during dt to the square of the number of laser photons for a laser central frequency in the range νl ± d(νl).
In order to eliminate the unknown geometrical factors and to determine the N-atom density, Kr is used as calibrating gas as described by Niemi et al [13]. A factor dΨKr may also be defined for Kr and expressed as a function of the Kr-atom density using an equation similar to (3):
where TKr and ηKr are the transmittance and the sensitivity of the photomultiplier tube for the spectral range used for the detection of the Kr-atom fluorescence. AKr5p→5s is the radiative decay rate for the Kr 5p → 5s transition observed [35].
Taking the ratio of equations (3) and (4) one may express the ground state N-atom density as a function of the known Kr-atom density:

The ratio of the generalized two-photon excitation cross-sections  and
and  , for Kr (4p6)1S0 → 5p'[3/2]2 and N (2p3)4
 → (3p)4
 , respectively, is taken from [13].
In equation (5), all the quantities except the ratio  are readily available after capturing the fluorescence generated by one laser pulse. The estimation of this ratio requires knowledge of the profiles of the laser beam and the absorption lines of the N-atom and the Kr-atom. In particular, the absorption line profiles depend on the local plasma conditions and are not always easy to determine from the experiments.
This difficulty is generally circumvented by capturing the fluorescence signals generated by several laser pulses with different central frequency values νl around 0.5νA (A = N or Kr) and integrating dΨA over the whole laser central frequency range. As a matter of fact, if we consider the case of N-atom fluorescence, integrating equation (3) over the laser frequency domain yields the following relationship:
A similar equation can be derived for the Kr-atom which is:

Taking the ratios of equations (6) and (7), yields the following expression for the N-atom density:
Equation (8), referred to as the FEM, is widely used in the literature to determine N-atom densities by TALIF experiments. It implicitly captures the overlap factor without any assumption. However, its use requires the determination of the time- and frequency-integrated fluorescence signals for each density value measurement. In our experiments, this typically would require the acquistion of 70 spectral points, taking approximately 20 minutes. This is obviously not suitable for the time-resolved measurements required in the context of the present work on pulsed plasma.
To circumvent this issue, we first make use of the specific discharge conditions investigated here in order to estimate  , with A = N or Kr, and subsequently use equation (5) to readily determine the N-atom density using a single laser shot at the central frequency of 0.5νA. The procedure used for this purpose is discussed in the following.
From the experimental point of view,  may be determined from the full excitation spectrum; by taking the ratio of equations (3) and (6), one obtains for an atom A = N or Kr:

Actually,  depends on the spectral profiles of the laser and the absorption lines. The spectral profile of the laser in this study is Gaussian and this is also the case for the absorption lines under our conditions, since they are dominated by Doppler broadening for both the N-atom and the Kr-atom. In this case, the overlap factors may be easily expressed as:
where  is the effective Gaussian full-width at half maximum (FWHM) due to convolution of the laser (ΔνG,l) and the transition profiles (ΔνG,A).
  is experimentally obtained from the full excitation spectrum.
The laser broadening ΔνG,l was determined from the TALIF signal of Kr at 300 K (without plasma). In such a condition, the Doppler broadening of the Kr absorption line is estimated to be 0.13 cm−1. The measured broadening of the Kr full excitation spectrum line is 1.59 cm−1 which is much greater than the Doppler broadening of Kr at 300 K. The resulting value of the laser line broadening is 1.10 cm−1. It is worth mentioning that this value is significantly larger than those usually reported in the literature, e.g. 0.25 and 0.36 cm−1 in [14] and [21], respectively.
Determination of the absorption line broadening, ΔνG,N, for the N-atom in the plasma requires knowledge of the gas temperature. This was estimated from the rotational temperature of the N2(C3Πu) electronically excited state, using OES applied to the transition N2(C3Πu →B3Πg, Δv = −2) and for stationary operation of the MW plasma. The assumption of rotational equilibrium with the gas temperature (Trot,N2(C) = Tg) may be questionable for the N2(C) system in some cases. However, under the considered discharge conditions, the N2(C) is predominantly produced by electron impact excitation of N2 ground states and lost by radiative de-excitation. The Franck–Condon principle makes the rotational distribution of the ground (X) and excited (C) states identical and in thermal equilibrium with the gas temperature [36]. Therefore, we can use the rotational temperature of the N2(C) system as a measure of the gas temperature. The rotational temperature inferred from the rotational structure of the emission band varied between 500 and 600 K in the investigated range of MW power. The resulting Doppler broadening for nitrogen is almost constant at a value of approximately 0.46 cm−1, which is two times smaller than the laser broadening. Consequently, ΔνG,N and  should remain almost constant for the considered discharge parameters. This was confirmed by measuring the FWHM of the excitation spectrum
  over a wide range of plasma conditions as shown in figure 2.
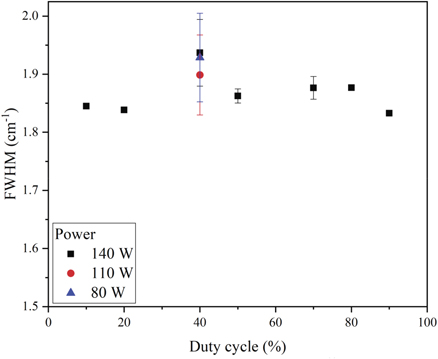
Figure 2. Experimental spectral width of the excitation spectrum  in cm−1, measured at the fundamental wavelength of the dye laser (16 125.135 cm−1), and deduced from the laser excitation spectra for several duty cycles and three MW powers.
Download figure:
Standard image High-resolution imageThis finding resulted in a significant simplification of the measurement procedure. As a matter of fact, the experiments to estimate the full integral  have to be performed only once in order to obtain
  . The N-atom density can then be readily determined through equation (5) using a single laser shot at a central frequency of 0.5νA, which significantly simplifies the measurement procedure. The use of the peak value at 0.5νA achieves the maximum overlap between the laser and the absorption lines, thus limiting the uncertainties of the measured N-atom density.
3.2. Signal processing procedure
The temporal integral  and τf are directly determined from the analysis of the time-resolved TALIF signal. The raw photomultipliertube signal for nitrogen was composed of two parts: (a) the time varying N*atom fluorescence and (b) a plasma background emission identified as the N2 FPS, i.e. N2(B3Πg → A3
 , Δv = −2), that was collected in the 728–750 nm wavelength range (denoted as 728–750 nm FPS emission). The overlap between these two components resulted in very poor signal-to-noise ratios, varying between 8 for the best case and 1.6 for most cases.
In order to capture the spectral profile of the laserexcitation spectrum, a two-step time- and spectral-fitting/filtering procedure was used, as described below. Firstly, the photomultiplier signal was post-processed using a non-linear least squares fit prior to performing the temporal integration. Figure 3 shows a typical raw photomultipliertube signal along with its non-linear least squares fit. As indicated in figure 3, one may distinguish three different sections of the signal: (I) the constant plasma background region before the initiation of the laser pulse at a time t0, (II) the fast increase of the fluorescence signal during the laser pulse and (III) the exponential decay with time constant τf after time t1.
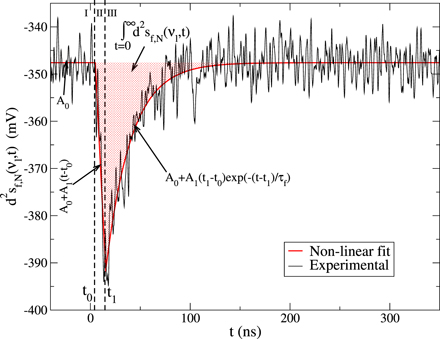
Figure 3. A sample raw photomultiplier tube signal of N-atom fluorescence (black line) and the corresponding fit, indicating the three regions, I–III, of the signal (as described in the text) and the corresponding temporal integral of the signal  . The time constant τf evaluated for the sample signal is 25.39 ns.
Download figure:
Standard image High-resolution imageThe fitting function is given by:
All the parameters of the fit (τf, A0, A1, t1 and t0) are obtained simultaneously. Thus, the time-integrated signal (filtered) for the N-atom can be written as follows:

 was determined from the laser excitation spectral profile of dΨN(δνN). For this purpose, the fitting procedure was applied to a set of 70 raw photomultiplier tube signals (figure 3) resulting from the fluorescence generated by 70 laser pulses with central frequencies varying between 96 743 cm−1 and 96 754 cm−1 (103.35–103.37 nm). The as determined
  laser excitation spectral profile (red-filled circle) along with its Gaussian fit is shown in figure 4. A similar procedure was applied to determine the LIF laser excitation spectrum of I2 used for laser wavelength calibration. This is also depicted in figure 4 showing that the spectrum broadening extends over several I2 fluorescence maxima, which indicates a fairly large broadening of the laser line, typically 2 cm−1.
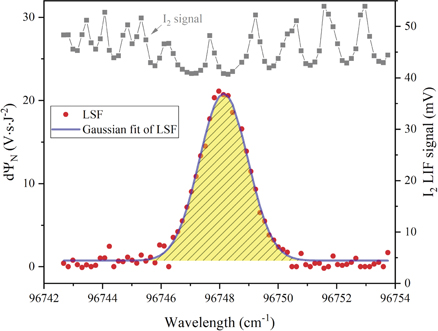
Figure 4. N-atom TALIF laser excitation spectra obtained from data processed using the non-linear least-squares fitting procedure (red solid circles) and their Gaussian fit (blue line). The pressure is equal to 20 Pa and the maximum MW power is equal to 140 W. The I2 LIF laser excitation spectrum (grey solid squares) used for absolute calibration of the laser wavelength is also plotted above.
Download figure:
Standard image High-resolution image3.3. Fluorescence decay time measurements for Kr- and N-atoms
The determination of the N-atom density (equation (8) or (10)) requires determining the ratio of the fluorescence decay times of Kr and N. The decay time for the Kr fluorescence line intensity at 587.09 nm was measured at 10 Pa and a value of 31.0 ± 1.2 ns was found. In fact under the low-pressure conditions considered, the quenching is negligible and the fluorescence decay time is almost equal to the 5p'[3/2]2 radiative lifetime. Using the quenching rate constant values given in [13] we estimated a value of 31.8 ± 1.3 ns for this radiative lifetime. This value is slightly lower than those previously reported in reference [13], i.e. 34.1 ns, and [37], i.e. 35.4 ns, but larger than the value of 26.9 ns given in reference [38].
The fluorescence decay time for N(4S)-atoms was measured at 20 Pa and was found to be 26.0 ± 1.4 ns for all the investigated plasma conditions (figure 5). Using the rate constant values given in references [11, 13] for the quenching of N(4S) by N2 molecules, we found a value of 26.2 ± 2 ns for the N(3p4S0) radiative lifetime in agreement with the literature [10, 11, 15]. As expected, the collisional quenching by N2 molecules is negligible and barely reduces the fluorescence decay time.
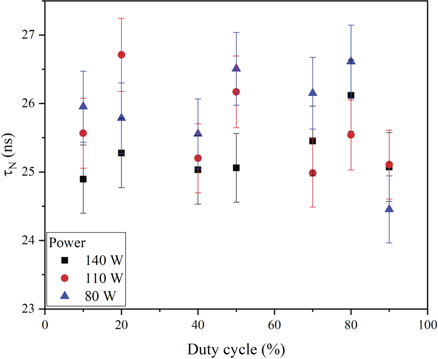
Figure 5. Decay time of N-atom fluorescence as a function of the duty cycle for different average input power values. The mean value of N(4S) fluorescence decay time estimated from all these data was 26 ± 1.4 ns.
Download figure:
Standard image High-resolution image3.4. Uncertainty analysis
The uncertainty of the measured N-atom densities was calculated using the propagation of uncertainties of the independent variables [39]. The uncertainties of the TALIF integrals (dΨ and  ),
),  and τf
were obtained directly from the non-linear fitting procedures [40]. The other independent variables were either obtained from the literature (two-photon absorption cross-sections) or datasheets from the manufacturers (transmission of filters and photomultiplier sensitivity). Figure 6 shows the contributions of the different independent variables to the uncertainty of the N-atom density. The largest contribution to the relative error on N-atom density comes by far from the uncertainty of the ratio of the two-photon absorption cross-sections for nitrogen and krypton, 50% [13]. The second error source comes from the uncertainty of the Kr radiative lifetime, 20% [35]. The uncertainties of the time-integrated peak fluorescence intensity, dΨ, determined using the procedure described above contributes 10%–15% to the global relative error on the density. The contributions of the other error sources are below 5%.
and τf
were obtained directly from the non-linear fitting procedures [40]. The other independent variables were either obtained from the literature (two-photon absorption cross-sections) or datasheets from the manufacturers (transmission of filters and photomultiplier sensitivity). Figure 6 shows the contributions of the different independent variables to the uncertainty of the N-atom density. The largest contribution to the relative error on N-atom density comes by far from the uncertainty of the ratio of the two-photon absorption cross-sections for nitrogen and krypton, 50% [13]. The second error source comes from the uncertainty of the Kr radiative lifetime, 20% [35]. The uncertainties of the time-integrated peak fluorescence intensity, dΨ, determined using the procedure described above contributes 10%–15% to the global relative error on the density. The contributions of the other error sources are below 5%.

Figure 6. Relative errors for the different terms of equation (5).
Download figure:
Standard image High-resolution image3.5. Power dependence
The different standard procedures used to determine atomic densities from TALIF measurements are generally valid only if the laser instantaneous and local power density remains low enough to avoid additional laser–atom interaction phenomena such as field coupling, photoionization, photo-dissociation and stimulated emission [29, 41]. The analysis of the TALIF signal intensity dependence on the laser energy, i.e. the so-called power dependence or PD factor [42], makes it possible to check if the experimental conditions ensure a laser–atom interaction dominated by the processes involved in the TALIF scheme. A value of 2 for the PD factor, i.e. a quadratic regime of excitation, indicates that the fluorescence dominates the laser–atom interaction processes.
From the experimental point of view several methods may be used to vary the laser energy in order to determine the PD value. Unfortunately, there is no clear conclusion on the best one. Therefore, in this work, we tested three approaches. In the first one the energy was changed using a half-wave plate and a Glan–Taylor polarizer. In the second one, the energy was varied by modifying the angle of the second BBO crystal in the dye laser. The third method was based on the use of a set of neutral density (ND) filters.
The method based on Glan–Taylor polarizer is very sensitive to the beam polarization, which resulted in repeatability issues since it was very difficult to inject the laser beam at the Brewster angle in the Pellin–Broca prism. As for the second method, the laser shape changed significantly with the energy, which prevented using equation (1) that assumes a constant beam shape. The last method was in fact the most reliable and straightforward. It yielded a power dependence of ∼2 for both nitrogen TALIF at 20 Pa and krypton TALIF at 1 Pa over the laser energy range 100–300 μJ (figure 7).
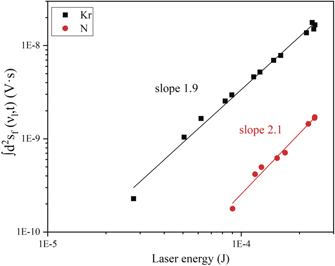
Figure 7. Measured variations of the time-integrated TALIF signal intensities as a function of the laser energy for nitrogen and krypton. For these measurements, the laser frequency was set at the peak of absorption (νl = νA/2).
Download figure:
Standard image High-resolution image4. Results and discussion
The plasma source was pulsed at the laser frequency of 10 Hz and the pressure was fixed at 20 Pa in all the experiments. The pulsed plasma regime is characterized by high- and low-power phases. Actually a zero input power during the low-power phase prevents the plasma re-ignition at the start of the high-power phase. Thus, it was mandatory to use an absorbed MW power value of 20 W during the low-power phase. In comparison, the absorbed power during the high-power phase was set to 80, 110 or 140 W. Under such power conditions, the volume of the highly emissive plasma zone, where a major part of MW power is likely to be dissipated, did not change significantly. In this study, we made measurements at a single position, 10 mm below the magnet (see figure 1). Actually, the N-atom diffusion time over a characteristic length of 10 mm at a pressure of 20 Pa is of the order of 1 ms, which is much smaller than the plasma pulse duration. Thus, this would result in approximately spatially homogeneous N-atom density that may be characterized by a single spatial measurement.
4.1. Comparison between the PEM and FEM approaches
Figures 8(a) and (b) show the variation of N-atom densities measured using the FEM and the PEM at different times and as a function of the power coupled to the plasma. The considered discharge conditions correspond to a duty cycle of 0.4. The results obtained by the two approaches are in a very good agreement. Hence, we subsequently employed the straightforward PEM to determine the N-atom density.

Figure 8. Comparison of the N-atom density obtained using the FEM and the PEM for (a) the time evolution at a high power of 150 W and (b) three MW power values of the high-power phase with measurements performed 1 ms after the plasma was switched off. The pressure was 20 Pa and the duty cycle 0.4.
Download figure:
Standard image High-resolution image4.2. N-atom density measurements during the high-power phase
Figure 9 shows the variations of the stationary values reached by the N-atom density and the 728–750 nm FPS emission intensity during the high-power phase as a function of the MW power deposited during this phase for a pulse period and a duty cycle of 100 ms and 0.5, respectively. Both are seen to increase similarly and linearly with the MW power.
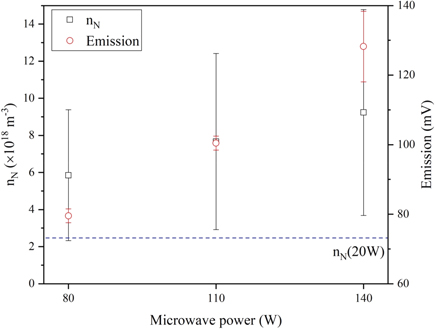
Figure 9. N-atom densities deduced from TALIF measurements (black open squares) and 728–750 nm FPS emission intensity (red open circles) during the high-power phase as a function of the coupled MW power. Also represented is the N-atom density measured during the low-power phase (blue dashed line) i.e. at 20 W MW power.
Download figure:
Standard image High-resolution imageIn fact, for the considered values of duty cycle and pulsed period, the plasma reaches a stationary state during the pulse (see section 4.3 and figure 10). The electron temperature is therefore mainly determined by the balance between the electron production and loss terms and does not depend on the deposited power [43, 44]. The increase in the 728–750 nm FPS emission and the N-atom density with the power can only be explained by the increase in the electron density which is proportional to the power density if the plasma composition does not change significantly [43, 44]. Thus, for the current experiments, we have a constant electron temperature, and the N-atom density and the FPS emission intensity would be proportional to the electron density and therefore to the power density. Since the measurements reported in figure 9 show that the N-atom density and the FPS emission intensity are proportional to the power, we can conclude that the power density is proportional to the absorbed power, which means that the plasma volume remains almost constant. We can also conclude that, despite the very emissive nature of the plasma, the methodology developed in this work enables prediction of consistent trends of N-atom densities with MW power and FPS emission.

Figure 10. Temporal evolution of the N(4S)-atom density, the N2(B) emission intensity and the MW power for (a) the high- power phase and (b) the low-power phase at a pressure of 20 Pa and 50% duty cycle. The time origin, t = 0, i.e. when transitioning between the high- and low-power phases, is chosen at the start of the power increase (a) or decrease (b). Time resolution of these measurements is 250 μs.
Download figure:
Standard image High-resolution image4.3. N(4S) time-resolved density measurement and kinetic analysis during the transients
The time evolution of the N-atom density, the 728–750 nm FPS emission intensity and the MW power are shown in figure 10. In this figure, the time origin, t = 0 s, is chosen at the start of the power increase (a) or decrease (b) at the transition between the high- and low-power phases. The variation of the 728–750 nm FPS emission intensity is indicative of the change in the population of the N2(B3Πg) electronic state (denoted as N2(B) in the following).
Also shown in the figure are the time variation fits using first-order exponential growth and decay functions that are used to estimate the characteristic rise and decay times. The rise and decay times of the absorbed MW power are approximately 0.45 ms and 0.07 ms, respectively. These are much smaller than the rise and decay times of the N2(B) emission intensity and the N(4S)-atom density. Also, the measured plasma characteristics reach steady-state values during both high- and low-power phases. This indicates that the characteristic times for the governing processes of N(4S)-atom and N2(B) kinetics are much smaller than the 100 ms pulse period.
The dynamics of the electron heating in pulsed plasmas is very fast and the electron temperature usually closely follows the timescale of the absorbed MW power [45] (see also the discussion and figures at the end of this section). The sudden increase in the MW power should result in substantial electron heating that leads to enhanced excitation, ionization and dissociation kinetics. Figure 10(a) shows that N(4S)-atom density and N2(B) emission exhibit similar characteristic rise times, i.e. around 1 ms. Assuming average values of 2 eV and 5 × 1010 cm−3 for the electron temperature and density, respectively, during the ignition phase, we estimate a time constant of 300 μs for the ionization kinetics. This means that the electron density is constantly evolving during almost 1 ms after the plasma ignition. Therefore, the excitation and dissociation rates are also evolving with time and it is indeed the ionization kinetics that drives the growth of the FPS and N-atom during the discharge ignition phase.
Since the gas temperatures is fairly low, i.e. Tg = 500–600 K, the excitation is governed by electron impact processes (R1) while the dissociation involves both an electron impact process on the ground state (R2) and the well-known vibrational excitation/relaxation route (R3) which also requires vibrational excitation by electron impact. Thus the time variation of the N(4S)-atom density and the N2(B) emission intensity are also indicative of electron density buildup and ionization timescale.


As for the decay phase, since the dynamics of the electron heating is very fast, one would expect the electron temperature drop to closely follow the MW power variation. Therefore the high-energy threshold electron impact excitation, ionization and dissociation processes are very likely to be rapidly quenched during the power decay phase (see also the discussion at the end of this section).
If the loss process of N2(B) was mainly through radiative de-excitation, which has a characteristic lifetime of 10 μs [46], the decay of the N2(B) emission would have closely followed the MW power decay. This is obviously not the case in this experiment which showed a much longer decay time of 600 μs for the FPS emission. Actually, N2(B) kinetics probably follows a complex mechanism similar to that observed in a short-lived afterglow [47–49]. In that case, the kinetics of N2(A), N2(B) and N2(C) are strongly coupled in a collisional-radiative loop involving several processes that are reported in reference [50]. The major exit channels from this loop are the processes:


If we assume a large de-excitation probability of N2(A) at the wall, the diffusion/wall de-excitation of this metastable should be diffusion limited. In this case, the N2(A) de-excitation characteristic time, i.e. reaction (R4), would correspond to the diffusion characteristic time of N2(A) that is given by Λ2/D where Λ is the plasma characteristic length and D the diffusion coefficient. Assuming the same value for the diffusion coefficients of all N2 electronic states and a Lenard-Jones N2–N2 interaction potential, a value of 0.03 m2 s−1 was estimated for D at a pressure of 20 Pa and a temperature of 600 K. This yields a 5 ms diffusion characteristic time for the 2 cm length scale estimated from the volume-to-surface ratio in our system. This diffusion timescale is much longer than the observed decay time and we can conclude that reaction (R4) does not dictate the loss mechanism of electronic excited states of N2. The estimation of the characteristic times of reactions (R5) and (R6) is more difficult since it requires knowledge of the N2(A) and N2(a') densities. Lower limits for these timescales however may be estimated by noticing that the relative densities of these excited states with respect to N2 ground states are always below 10−3 [47, 48]. Using this value of relative density and the rate constants given in [51] we can estimate lower limits of 42 ms and 5 ms for the characteristic times of reactions (R5) and (R6), respectively. These values are also much larger than the observed sub-millisecond decrease of the FPS emission intensity. These processes do not result in a depletion of the excited triplet state that is consistent with the one observed for the FPS emission during the early stage of the low-power phase. Using the N-atom density measured in the present study, i.e. nN ≈ 1019 m−3, a characteristic time of 2.5 ms was estimated for reaction (R7) that is also not fast enough to explain the time decrease of the FPS just after the transition to the low-power phase. Eventually, a value of 275 μs was estimated for reaction (R). It appears therefore that reaction (R8) is the major loss mechanism of excited electronic states in our discharge conditions. The characteristic time inferred from this reaction rate constant is not very far from the one measured experimentally, i.e. 600 μs. Taking into account the qualitative nature of our reaction timescale analysis as well as the uncertainty of the rate constant value for (R8) [50] one can even consider that the agreement is satisfactory.
The characteristic time of N-atom density decay is longer than that of the plasma emission. It was estimated to be 2.5 ms. Over such a long timescale, it is usually assumed that the consumption of N-atoms takes place through surface recombination processes at the reactor walls:

Surface recombination is generally a first-order reaction which is controlled by the balance between the diffusion and surface recombination at the wall:

where D is the diffusion coefficient, Λ is the plasma characteristic length, γ is the sticking coefficient and  is the mean thermal velocity. Further, xg and xw are the N-atom mole-fractions in the gas phase and at the reactor wall, respectively. Assuming a Lennard-Jones N–N2 interaction potential, a value of 0.15 m2 s−1 was estimated for the diffusion coefficient of N-atoms at 20 Pa and 600 K.
This yields a value of 3.4 ms for the diffusion characteristic time, which is very close to the decay time seen in our experiments. This shows that the measured depletion kinetics of N(4S)-atoms agrees with a diffusion-limited recombination process. In fact if we assume that the recombination process is limited by the surface reaction, the value of γ determined from the measured decay time would be approximately 10−2 which is significantly larger than the value of 10−3 reported in reference [27] for stainless steel. Therefore, we cannot comment on the surface recombination. The only thing we can conclude is that the surface recombination timescales are either of the same order of magnitude or shorter than the diffusion timescales. In both cases, the measured characteristic time would be consistent with the diffusion-limited recombination. Of course the surface recombination timescales may have similar values to diffusion. In any case, the agreement between the measured decay time and estimated diffusion time would tend to validate our N(4S)-density measurements.
Actually, the N(4S) loss kinetics involves much more complex kinetics than a simple diffusion/recombination process. Looking at figure 10(b), one can notice a surge in the N-atom density just at the transition between the high- and low-power phases despite the poor time resolution in this figure. This reproducible surge is similar to the one observed in reference [17] where the authors showed an unexpected increase of N(4S) TALIF signal at the start of the plasma-off phase in a pulsed microwave plasma. The methodology used in the present work provides TALIF measurements with a time resolution as low as 5 μs and straightforward signal processing which enables investigating short timescale kinetics effects for N(4S). This has been used to confirm and further study the existence of this fast increase in N-atom TALIF signal that is expected to occur within 500 μs during the early stage of the low-power phase. Figure 11 shows time-resolved measurements with a much better resolution, i.e. 10 μs resolution, of the N(4S)-atom density and the background plasma emission near the transition between the high- and low-power phases. This figure confirms the existence of a significant increase in the N-atom density (more than 1018 m−3, which represents more than 10% relative variation) just after the transition to the low-power phase. In fact, a high N(4S) density level is maintained during almost 1 ms after the power transition. Note that such behavior is not observed for the plasma emission intensity that decreases sharply just after the transition.
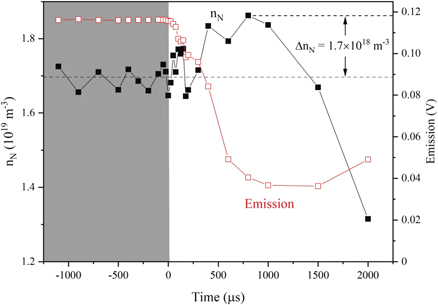
Figure 11. Time-resolved measurement of N-atom (black circles, left axis) and N2(B3Πg) emission (red squares, right axis) around the transition between the high- and low-power phases and during the early stage of the low-power phase.
Download figure:
Standard image High-resolution imageThe increase in the N(4S) density can be only due to the change in the kinetics of very short characteristic time processes. This may involve either a decrease in the rates of N-atom consumption processes or an increase in the rates of N-atom production processes at the transition between the high- and low-power phases. Therefore, beside reactions (R2), (R7) and (R9), we considered the following gas-phase processes that are reported in the literature [50–52] as far as N(4S) kinetics is concerned:


As mentioned previously (see also the discussion at the end of this section), the rapid transition from the high - to the low-power phases will first result in a decrease of the electron temperature, which immediately affects the rates of the electron impact processes, and more particularly the ionization and dissociation processes. Then, the time evolution of N(4S) is governed by the interplay of all the process mentioned previously, i.e. (R2), (R3), (R7) and (R9)–(R14).
To evaluate the relative predominance of these channels in the evolution of the N(4S)-atom density, we made use of a self-consistent N2 plasma model that solves for the two-term expansion electron Boltzmann equation [45] coupled to the balance equations of the vibrational states of the N2 ground state (46 levels), and the N2 and N electronically excited states that result from collisional-radiative models of N2 (18 states) and N (26 states), as well as the total energy equation that yields the gas temperature. The detailed description of this model, that makes use of the methodology described in reference [45] and a collisional-radiative model similar to those described in references [50–52], is out of the scope of this paper. Here, we limit ourselves to the use of this model for the analysis of the time variation of the electron density, the electron temperature, the N2 vibrational distribution and the N-atom densities in order to evaluate the relative predominance of the different processes involved in the N(4S) kinetics.
Figure 12 shows the timevariation of the calculated electrontemperature (Te) and electron density (ne) at the transition between the high- and low-power phases. When the power is suddenly decreased at the end of the high-power phase, the electron recombination being much slower than the electron energy relaxation, the electrons experience very strong cooling which result in the observed strong and very fast decrease of Te from 17000 K to 7000 K. During this rapid decrease phase, the temperature adjusts so as to fulfil the power balance and the time evolution of Te is actually driven by the recombination kinetics (electron density decrease). The Te value required to fulfil the power balance when the recombination is under progress, is much lower than the value of 15 000 K required for sustaining the low-power phase plasma. Eventually, under a given level of ne, Te starts increasing again so as to fulfil the power and density balances of charged species. It ends up reaching a 15000 K steady-state value for the low-power phase. Therefore, it appears that the calculated ne and Te are coupled. They are governed by the electron kinetics and more precisely by the balance between the ionization and electron loss processes. These later are dominated by wall recombination.
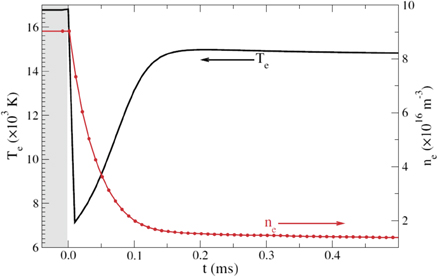
Figure 12. Time variation of the electron temperature and electron density. The simulation was performed for a pressure of 20 Pa, a power density of 1 W cm−3, a pulse period of 100 ms and a duty cycle of 0.5. The emphasis is put on the high/low power transition.
Download figure:
Standard image High-resolution imageFigure 13 shows the calculated timevariation of the vibrational distribution functions (VDF) at different stages of the transient between high- and low-power phases. It is worth mentioning that the y-axis scale is extended for the low population value in order to emphasize the relevant population changes during the transition. The relative density of high-lying vibrational states (v > 34) strongly decreases during the early low-power phase. A detailed rate analysis shows that this decrease benefits the low-lying vibrational states through a vibrational de-excitation process, the contribution towards vibrational dissociation during the 500 μs being negligible (see figure 14). Note that the total variation of relative density of the high vibrational levels is below 10−5 which is much below the observed N(4S) relative density increase that is around 10−3.
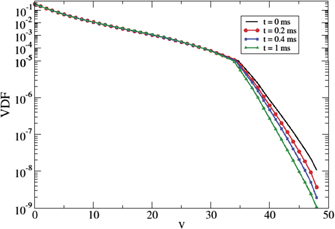
Figure 13. Time variation of the VDF during the transition to the low-power phase. The simulation was performed for a pressure of 20 Pa, a power density of 1 W cm−3, a pulse period of 100 ms and a duty cycle of 0.5. The emphasis is put on the high/low power transition.
Download figure:
Standard image High-resolution image
Figure 14. Time -variation of the main electron impact processes involved in the kinetics of N(4S)-atoms at the transition between the high- and low-power phases. The rate of surface recombination processes are also shown for comparison. Also shown in the insert is the increase of surface recombination of N(4S) in the low-power phase.
Download figure:
Standard image High-resolution image
The time variation of the rates of the processes involved in the kinetics of N(4S) are shown in figure 14 confirming that the contribution of process (R3), i.e. v–d mechanism, to N(4S) kinetics is very weak. Actually, during the high-power phase, the kinetics of N(4S) is essentially governed by the balance between (a) the production through electron impact dissociation of N2 (reaction (R2)) and the de-excitation of N(2D/2P) at the wall (reaction (R11)) and, to a lesser extent, by super-elastic collisions (reaction (R13)), on one hand and (b) the loss through electron impact excitation of N(4S) to N(2D) and N(2P) states (reaction (R14)) and wall recombination (reaction (R9)) on the other hand. When the power is decreased, the electron cooling affects this balance through a strong decrease in the electron impact dissociation of N2, the N(4S)-atom excitation and, to a lesser extent, the N(2D/2P) de-excitation. As a result, the kinetics of the N(4S)-atom becomes dominated by the wall de-excitation of N(2D/2P), as a source, and the wall recombination, as a loss term, during the transient. This results in a net production of N(4S) during 200 μs, which explains the observed short timescale increase in N(4S) density in both the experiment and simulation (not shown). Actually, the surface recombination rate increases by approximately 10% during the early low-power phase (which can be easily seen in the insert in figure 14). This indicates a slight increase in the N(4S) density over the short timescale considered in figure 14, which is in agreement with the TALIF measurements (figure 11).
This finding leads to a slightly different interpretation from the one given in reference [17] where the observed increase in N(4S)-atom density during the early post-discharge phase of a pulsed plasma was attributed to super-elastic collisions on N(2P/2D). Here, we showed that this increase is most probably due to the wall de-excitation of the metastable state N(2D/2P)-atoms that results in a net production of N(4S), and therefore an increased N(4S) density, during 200 μs, which is consistent with the results obtained from the TALIF measurements. Note that this short timescale kinetic effect may be more or less important depending on the discharge conditions. It seemed in particular much more pronounced under the experimental conditions considered in reference [17].
In any case, the contribution of N(2D) and N(2P) metastable states to N(4S) kinetics should be considered if the N-atom density in a strongly emissive plasma is to be extrapolated from post-discharge density TALIF measurements. In fact, the increase in N(4S) in the early low-power discharge phase is directly related to the densities of the N(2D/2P)-atoms during the high-power phase. Our results tend to show that the metastable density represents approximately 10% of the N(4S) density during the high-power phase.
5. Conclusion
In this paper we showed the validity of the PEM under the conditions of ECR microwave plasmas. This method is valid as long as the spectral profiles of the absorption lines chosen for TALIF measurements do not change over the investigated plasma conditions. The approach seems to be particularly suitable for low temperature, moderate pressure plasmas where the change in line broadening width due to Doppler and Stark effects remains fairly limited.
TALIF measurements using the PEM were then used to investigate plasma kinetics in strongly emissive pulsed ECR microwave plasmas. The measurements showed a linear increase in both the N(4S)-atom density and the FPS emission intensity with the coupled power, which would indicate a linear increase in the power density with the power (which means that the plasma volume is constant). This consistency between the variations of the power density, the FPS emission and the measured N(4S)-atom density further supports the validity of this simplified approach.
The ns-TALIF PEM was also used to investigate the transients at the transition between the low- and high-power phases of pulsed plasmas. We confirmed the existence of the unexpected increase in N(4S)-atom density at the early stage of the low-power phase reported in reference [17]. We used a quasi-homogenous plasma model that involves detailed collisional-radiative models for N2 and N to identify the kinetic effects that lead to the observed density increase. We particularly showed that this increase is due to the surface de-excitation of N(2D) and N(2P), the role of super-elastic collisions suggested in reference [17] being much less important with our conditions. From a practical point of view, the results obtained show that such increase should be taken into account when using extrapolated values from N-atom densities measured in the post- discharge in order to determine the dissociation yield in an emissive discharge. On the other hand, the rise of N(4S)-atom densities can serve as an indicator of the concentration of N(2D)- and N(2P)-atoms in the discharge.
Acknowledgments
The authors thank Dr. S Iséni, Dr. C Drag and Dr. N Sadeghi for helpful discussion. This work was supported by the PRC program of the French National Research Agency under the ASPEN Project Agreement ANR-16-CE30-0004, by the SESAME research and innovation programme of the Ile-de-France Region under the Project Grant DIAGPLAS and the CNRS 'Réseau Plasmas Froids'. One of the authors (EB) was supported by the European Union's Horizon 2020 research and innovation programme under the Marie Skłodowska-Curie Grant Agreement No. 665850. One of the authors (KH) acknowledges the support of the Institut Universitaire de France.
Data availability statement
All data that support the findings of this study are included within the article (and any supplementary files).