

Abstract
The energy flux of a nanosecond pulsed cold atmospheric pressure (CAP) plasma jet in contact with a substrate surface was measured to improve the understanding of the correlation between energy flux, flow dynamics and applied electrical power. The flow pattern properties of the CAP jet were imaged using Rayleigh scattering showing a transition from laminar to turbulent flow at Reynolds number of 700, significantly smaller than the conventional critical Reynolds number of 2040. The energy flux to the surface was determined using a passive thermal probe as a substrate dummy. As expected, the energy flux decreases with increasing distance to the nozzle. Measurements of the floating potential of the probe revealed a strong positive charging (up to 165 V) attributed to ion flux originating mainly from Penning ionization by helium metastables. Negative biasing of the probe doubled the energy flux and showed a significantly increased ion contribution up to a nozzle distance of 6 mm to the surface. For positive biasing an increased contribution of electrons and negative ions was only found at 3 mm distance. The relevance of particle transport to the surface is shown by switching from laminar to turbulent flow resulting in a decreased energy flux. Furthermore, a linear correlation of energy flux and input power was found.
Export citation and abstract BibTeX RIS
1. Introduction
CAP plasma sources are of great interest for applications in the field of plasma medicine [1–3], plasma agriculture [4–7] and plasma surface treatment [8, 9] as they combine high chemical reactivity with low gas temperatures. Different diagnostics have been used to understand the multicomponent plasma processes such as the role of excited and charged species [10–12], (V)UV radiation [13], reactive oxygen and nitrogen species [14, 15] and energy flux due to thermal energy or electromagnetic fields [16, 17]. The energy flux to the surface can be separated into two types: (1) the kinetic particle flux by ions, electrons and fast neutrals that transfer their kinetic energy on impact, and (2) processes occurring directly at the substrate, such as recombination of ions or molecule formation, where the surface acts as third collision partner [18]. Furthermore, radiative energy transport leads to energy gain and loss at the surface. For many non-equilibrium plasmas, the radiative losses from the surface should be negligible as the substrate temperature stays near room temperature.
The passive thermal probe (PTP) used in the present work is a diagnostic device which determines the energy flux from the plasma to a substrate by the change in the substrate's temperature. The operating principle is based on reference [19] and the design has been refined in recent years to measure energy fluxes mainly in low pressure environments (P ⩽ 50 Pa) [20–24]. With the increasing relevance of atmospheric pressure plasmas, there have been efforts to make this diagnostic available for high and low energy plasma jets [16, 17, 25–27] and surface barrier discharges [28].
The present study contributes to understanding and interpretation of the energy flux of nanosecond CAP jets focusing on the link between the energy flux, flow dynamics, and applied electrical power. Rayleigh scattering measurements [29] were performed to map the transition from laminar to turbulent flow as a function of flow rate. A back current shunt (BCS) [30] was used to determine the applied electrical power and pulse voltage. The PTP was left floating during most measurements and its floating potential was measured in order to observe charging effects. Additionally, during a distance variation, an external bias was set to the PTP in order to gather information about the contribution of charged particles to the energy flux. Furthermore, a shielding gas device was used to determine the influence of chemical reaction dynamics on the energy flux to the substrate.
2. Experimental setup
2.1. Cold atmospheric plasma jet (CAP jet)
A custom-made CAP jet shown in figure 1 was used for the experiments. The housing is made of polyoxymethylene (POM) and has an outer diameter of 16.5 mm. Three symmetrically arranged gas inlets are used to achieve an even gas flow distribution and obtain a symmetric flow pattern. A ceramic cylinder with an inner diameter of 2.28 mm and a thickness of 1.25 mm is used as a dielectric barrier. The barrier limits the current and the energy introduced into the plasma, resulting in a non-equilibrium plasma generated between the electrodes. The cone-shaped needle electrode (302/304 stainless steel) in the center is placed 1.3 mm to the nozzle outlet. The diameter of the needle is 1.2 mm. A copper ring is incorporated in the polymer around the ceramic tube and grounded using copper tape. A shielding gas device similar to that used in [15] was mounted around the head to create a defined co-flow around the working gas.
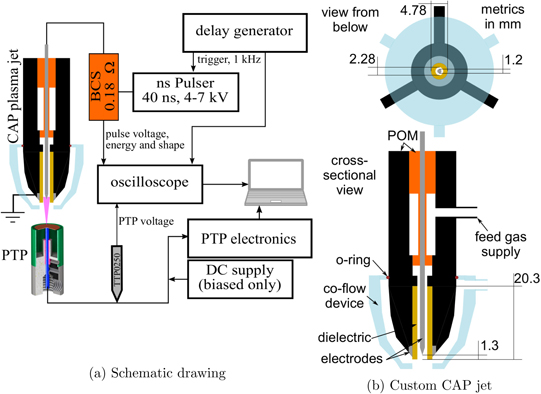
Figure 1. Schematic drawing of the experimental setup (a) and cross-sectional drawings of the jet with the mounted co-flow device (b).
Download figure:
Standard image High-resolution imageA high-voltage nanosecond pulse generator (FID FPG 20-10NM) provided 40 ns long positive pulses with voltages of around 5.5 kV and a frequency of 1 kHz to ignite the plasma. Calibrated mass flow controllers (MKS instruments) regulated the working gas and co-flow rates. The flow pattern of the CAP jet was mapped using Rayleigh scattering [29].
2.2. Electrical characterization
The electrical characterization of the CAP jet is performed using a back current shunt (BCS) to measure the ns pulse voltage and electrical power. The BCS consists of ten resistors soldered into a gap in the ground shield of the high-voltage cable. The voltage drop over the resistors reflects the current flowing through the inner conductor of the cable [30–32]. With a sufficiently long cable and short pulses it is possible to observe the incoming and the reflected pulse in the BCS signal. Figure 2 shows a circuit diagram representing the BCS, which is used to calculate the current and voltage applied through the cable [30]:


where Z is the impedance of the different resistors given in figure 2 and γ is the attenuator in front of the oscilloscope. The electrical power can be calculated from the absolute amplitude difference between the applied and reflected pulse voltages. The applied electrical power WBCS is calculated by [31]

where t0 and tpulse represent the pulse start time and end time. Vinc and Vref denote the incoming and reflected pulse voltages.

Download figure:
Standard image High-resolution imageFigure 3 shows representative BCS waveforms to explain the evaluation procedure. Figure 3(a) shows the ns pulse at around 30 ns and its reflection at around 90 ns. Furthermore, another negative peak is visible at around 170 ns followed by noise (not shown).

Figure 3. (a) Representative BCS data overlaid with E-FISH measurements to distinguish between applied pulse and reflections of the pulse and noise. (b) By superimposing the incoming ns pulse and its reflection, the visible difference provides the dissipated power. Following equation (3), the coupled in power can be calculated for each time step and is shown by the dashed lines. For the non-ignited case the power over time fluctuates around 0 kW and indicates the noise level. Negative power is an artifact of cable length. Time integration results in the electrical power of a single pulse. Color available online.
Download figure:
Standard image High-resolution imageTo demonstrate the separation of voltage applied to the jet electrodes and the voltage signal originating from the pulse reflection in the BCS waveform, time resolved electric field induced second harmonic generation (E-FISH) measurements were completed in a separate, sub-breakdown electric field for the same ns pulser voltage setting. The E-FISH method [33, 34] and experimental setup have been described in detail elsewhere [35]. The electric field measurement shown in figure 3(a) was performed on a field applied to two cylindrical electrodes. A femtosecond laser pulse was moved in time with respect to the applied voltage pulse. The time resolved measurement shows the actual applied field separated from the reflected pulse and from electromagnetic noise measured across the BCS. Absolute calibration was done on the same electrode setup using a DC electric field measured with a Tektronix P6015-A high voltage probe. Figure 3(a) shows, that the calibrated E-FISH measurements match well with the pulse rise, amplitude, and fall of the BCS response. Additionally, it can be seen that the reflected pulse measured between 60 and 120 ns does not show an electric field signal, indicating that this is a voltage artifact measured by the BCS rather than an actual electric field present on the discharge. Finally, between around 160 and 180 ns, we can see that the secondary reflected pulse indicates an actual voltage, which would be applied to the already ionized gas, although this secondary pulse is significantly weaker in both amplitude and duration than the primary applied voltage.
E-FISH measurements were not performed on the plasma jet itself, as the weak polarizability of helium prohibits accurate field measurements for the given conditions and do not add to the conclusion of the present work.
The duplicated datapoints (red and green in figure 3(b)) were shifted forward in time to superimpose upon the incident pulse. The difference between incident and reflected pulses represents the applied electrical power. It is shown as dashed lines on the second y-axis calculated by equation (3), followed by a conversion to power by taking the pulse-on time into account. An overlap of both pulses was obtained and expected if no plasma was ignited (red curves), and thus no electrical power is transmitted to the plasma. The calculated power fluctuates around 0 kW indicating the noise level of the measurement. During plasma ignition a difference between both curves is visible and a significant amount of electrical power is coupled in during the entire burst of 5000 pulses generated at 1 kHz repetition rate. Figure 3(b) shows the momentaneous power on the right, which at 1 kHz results in an average power in the order of 1 W. The procedure was repeated for the second pulse at around 170 ns, but was found to be negligible due to the V2 dependence of the electrical power. The evaluation was performed on each pulse within the burst during the measurements and the mean values and standard deviations across the burst were calculated to gain comprehensive results.
2.3. Energy flux measurements
The complete setup for the energy flux measurements is discussed first. A schematic drawing is shown in figure 1. The nanosecond pulser is triggered by a delay generator (Quantum Composers, model 9514) to control the discharge frequency (1 kHz) and the number of pulses within a burst (5000 pulses). For all measurements, 5000 pulses of around 40 ns were generated at a repetition rate of 1 kHz which results in a plasma burst time of 5 s. The pulse voltage was kept constant during each set of measurements. The applied voltage and dissipated electrical power were measured using the BCS (see section 2.2). The BCS data for each pulse was tracked on a digital oscilloscope (LeCroy, Wavepro 7300A or Tektronix, DPO5204B) and evaluated after the measurements. The electric potential of the PTP was measured by either a voltage probe (Tektronix, TPP0250) for the distance variation and biasing of the probe, and a digital multimeter for all other measurements. Helium was used as working gas.
Passive thermal probe (PTP). The PTP has been described elsewhere [28, 36, 37] and is only briefly discussed here. It consists of a 100 μm thick small copper plate with a diameter of 11 mm that acts as a substrate dummy and becomes treated (heated) by the plasma. A K-type thermocouple is spot-welded on its backside to measure substrate temperature with a sampling frequency of 100 Hz with an additional copper wire for biasing and potential measurements. The heat capacity of the probe was determined by a calibration procedure described in [21] to be CS = 0.0287 J K−1.
The precise heat capacity is an important quantity of the PTP, as it correlates the time derivative of the PTP's enthalpy ( ) with the time derivative of the substrate temperature (
 ) during plasma treatment/heating (Th-plasma source on) and cooling (Tc-plasma source off):


where Pin is the power of the plasma transferred to the substrate and Pout,h and Pout,c are the power losses of the substrate during heating and cooling. For small temperature changes and timescales, the power losses are assumed equal (Pout,h = Pout,c). Combination and rearrangement of equations (4) and (5) yields:

where Jin is the energy flux to the substrate of an area AS.
For the evaluation of the time-dependent temperature data, the 'kink method' [24] was used. This method minimizes the time and temperature changes between the data points used for evaluation and ensures the assumption Pout,h = Pout,c holds. The idea of the kink method is explained as follows: The PTP measurements are performed by switching the plasma source on for heating the substrate dummy for a short time (here 5 s). After heating, the plasma is switched off and the substrate dummy cools down (here around 120 s). A minimum or maximum in the logged temperature data occurs at the point the plasma is switched on or off, respectively. Around these turning points, called 'kinks', linear fitting over a short period of time (around 1 s) yields a good approximation of the exponential slope and only takes similar temperatures during heating and cooling into account. The energy flux can be calculated using equation (6) with knowledge about the temporal slopes at around one temperature turning point.
2.4. Flow field of the CAP jet
Rayleigh scattering setup. A critical aspect of the energy flux to the surface is the uniformity of the flow. This was measured using Rayleigh scattering. The setup for the Rayleigh scattering measurements is shown in figure 4. The second harmonic of an Nd:YAG laser (Spectra Physics Quanta-Ray Lab-170-10) was used as light source for the scattering experiments. A half-wave plate controlled the polarization, an iris blocked upstream scattering, and a cylindrical lens with a focal length of 20 cm formed a ∼3 mm wide laser sheet underneath the CAP jet. The jet itself was mounted onto an XYZ-translation stage to scan the effluent. An optical bandpass filter for 532 nm was placed between the jet nozzle and the camera (Princeton Instruments PI-MAX2). A signal-to-noise ratio (SNR) of 10 could be achieved starting at a distance of ∼3 mm to the nozzle. No measurements with an ignited plasma were performed, because the Rayleigh scattering was too weak and the plasma effluent could not be imaged. The plasma effluent is the afterglow of the plasma leaving the jet nozzle into open atmosphere, and typically corresponds to the region that can be observed by the naked eye due to emission from energy dissipation outside the core plasma. Rayleigh measurements without plasma ignition were done to map the transition from laminar to turbulent flow by increasing flow rate. No significant change of flow dynamics is caused by plasma ignition on the length scales used for the energy flux measurements according to the body of literature [38–41], so a reasonable estimation of the laminar to turbulent transition with ignited plasma can be made and used for the interpretation of the PTP data.
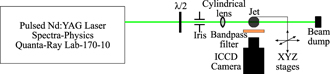
Figure 4. Schematics of the Rayleigh scattering setup.
Download figure:
Standard image High-resolution image
Flow field characterization. The aim of the flow field characterization was to find the transition region from a laminar to turbulent flow of the CAP jet. CO2 was used as working gas because its Rayleigh scattering cross-section is about twice that of air ( = 12.7 × 10⁻²⁷ cm2 [42] and σair = 5.16 × 10⁻²⁷ cm2 [29] at 532 nm). The CAP jet was translated with respect to the laser sheet to obtain scattering data at 13 different radial locations with a separation of 0.32 mm and 5 different heights spaced by 2.54 mm, totaling 65 different positions. For each position, the median over 128 pictures was taken. Mie scattering from heavier particles was removed by building the median for each pixel to filter high intensity values. The median pictures were stitched together. The admixture fraction can be determined by assuming a uniform pressure and air scattering outside of the jet flow, in regions where no CO2 is present. The signal intensity (S) depends on the laser intensity (I) and the Rayleigh scattering cross-section (σ) of the component gas multiplied by its mixture fraction (χ):

for an N component mixture. With only two components, (CO2 and air) one of the unknown fractions can be eliminated by χ1 + χ2 = 1 and equation (7) can be rearranged as:

The laser intensity I is normalized by the measured scattering signal outside of the jet flow where just air scattering can be assumed. Thus, equation (7) provides the laser intensity value I = S/σair. This procedure also normalizes shot-to-shot laser intensity fluctuations by normalizing the intensity using the scattering signal. The results of this evaluation are shown in figure 5 for flow rates of 600 sccm and 700 sccm, respectively.

Figure 5. Rayleigh scattering pictures taken with CO2 flow for two given flow rates. For 600 sccm a clear laminar flow is visible, while at 700 sccm turbulences start to appear. The pictures have been stitched together from 13 × 5 = 65 measurement positions with 128 single shot measurements each.
Download figure:
Standard image High-resolution imageThe effects of turbulence on the flow can be clearly seen in the averaged Rayleigh scattering data presented in figure 5. At a flow rate of 600 sccm, the laminar core flow is clearly identifiable as shown in figure 5(a). With the laminar flow, averaging can be effectively used to enhance the SNR as each individual image shows effectively the same spatial information (i.e.—mixture fraction). In comparison, figure 5(b) shows the effect of turbulence onset on the averaged image. At higher flow rates, the inner core flow is still clearly seen closest to the jet output, but a blurring of the core flow occurs downstream. This is due to the inner core flow mixing with the quiescent air due to the onset of Rayleigh–Taylor instabilities. The unique turbulent flow patterns can only be seen in the single-shot images (see figure 6). Thus, averaging of the images results in blurring of the flow channel when compared to the laminar flow, which is due to the mixing of air within the inner CO2 core flow.

Figure 6. Single shot pictures of the first laser sheet centered below the jet nozzle to visualize the onset of turbulence. The laminar flow channel is visible at 600 sccm while turbulences are visible at 700 sccm. For 2000 sccm, a clearly turbulent flow is shown. The intensity scales are the same for each image to show the decrease of CO2 content with higher turbulence.
Download figure:
Standard image High-resolution imageMeasurements were repeated with He as the working gas, resulting in the same transition region. Based on the Reynolds numbers, He should stay in the laminar regime at higher flow rates compared to CO2, making the result of the same transition region surprising. The Reynolds number of the CAP jet predicts the transition from laminar to turbulent flow for CO2 at more than double the flow rate based on the assumption of a smooth tube with inner diameter d of 2.28 mm. The flow speed v was calculated by the flow rate and the continuity equation. The viscosity  and gas density
  of CO2 were taken to be 14.932 μPa s and 1.808 kg m−3, respectively [43]. The Reynolds number Re is calculated by

which gives a critical Reynolds number of 2040 for CO2. For a transition region reaching up to about 1000 Reynolds numbers [44, 45], the flow rate for obtaining the critical Reynolds number should be at ∼1750 sccm and not at 700 sccm as measured. For He with ηHe = 19.846 μPa s and ρHe = 0.164 kg m−3 the much smaller fraction of ρHe/ηHe results in an even larger discrepancy between the theoretical and measured flow rates necessary for reaching the critical Reynolds number.
The large discrepancies indicate that the smooth walled tube model is too simple to correctly predict the transition from laminar to turbulent flow regime, likely due to the needle electrode in the center and other sources of turbulences, such as small imperfections from the manufacturing. Due to the same transition for CO2 and He, it seems that geometric and setup specific factors are highly relevant for the flow pattern. Thus, assumptions about flow patterns of CAP jets should not be purely based on the simplified Reynolds number. Real experiments as performed are necessary to obtain the related values. The transition at about 700 sccm is likely valid for other gases such as Ar, N2 and air.
3. Results and discussion
Prior to presentation and discussion of the energy flux measurements, a general comment must be made. Following equation (6), dividing the energy flux by the probe area is common for this diagnostic to gain the transferred energy per area and make different plasma sources comparable to each other. For low pressure plasmas, this principle has proven successful due to large plasma expansion which usually covers the complete probe. Atmospheric pressure plasmas, especially if filamentary, have characteristic diameters of a few tenth to hundreds of μm and are not always covering the complete probe surface with the visible effluent. Thus, one must define an effective probe area based on the dimensions of the visible effluent or design probes with a smaller diameter, as has been suggested previously [16, 17, 26]. On the other hand, each newly designed probe incorporates new features and new sources of systematic errors, which hinders a direct comparability of the plasma sources. Furthermore, the reactive gas is flowing across the surface, dissipating additional energy which contributes to the total energy flux, e.g. by surface reactions or recombination.
For these reasons, the decision was made to use a larger probe compared to the visible effluent and not to define an active probe area. The surface area is considered as a constant factor in the evaluation of the absolute energy flux values. It has no influence on the relative values and trends obtained by this diagnostic.
3.1. Influence of the distance and probe bias
The distance between the nozzle outlet and the PTP was varied between 3–9 mm while the PTP was set on a floating potential or biased at ±200 V to obtain information about the influence and range of charged particles. The floating potential settles after 25–30 single pulses (0.03 s). With the temperature measurements being temporal limited by heat conduction and the 100 Hz sample rate, the floating potential is assumed to be steady during the energy flux measurements. For the measurement a pulsed voltage of ∼5.5 kV was applied to the plasma jet and a working gas flow of 500 sccm He was used with a surrounding co-flow consisting of artificial air (80/20 N2/O2) with a flow rate of 500 sccm. The He flow rate was chosen to work in the laminar regime of the CAP jet as the transition to turbulent flow appears at higher flow rates. The co-flow decreased the noise level in the measurements because random ambient gas was kept away from the probe and the artificial air stream with a constant temperature resulted in identical framework conditions. No other differences with regards to the flow pattern and the energy flux were observed due to the co-flow.
Floating probe. The results for the energy flux measurements are shown in figure 7(a). They exhibit an exponential decay of the energy flux values at larger distances, and the highest energy flux to the probe surface is found at the shortest distance of 3 mm with a value of 63 ± 4 mW cm−2. The short ignition time during the nanosecond pulses results in low applied electrical powers in the range of 1 W. Thus, the energy flux as well as the gas temperature is significantly smaller for nanosecond pulsed discharges driven at low repetition rates, compared to radiofrequency driven discharges such as that of the kINPen [16, 17, 46].

Figure 7. (a) Energy flux measurements as a function of the nozzle to PTP distance for different probe biases. The measurements were done using a pulse voltage of ∼5.5 kV and a working gas flow of 500 sccm He with a 500 sccm artificial air co-flow. Fits were added to stress the energy flux contributions and are explained in the text. (b) The ratio of both terms of the sum of the fit function is shown for the different bias voltages of the probe.
Download figure:
Standard image High-resolution imageThe subsequent drop in the energy flux has been observed before [16, 17]. It is explained by the change of the contributions to the integral energy flux. The stronger decay at short distances is because fewer reactive particles reach the surface for increasing distances, as most of them have recombined due to their short lifetimes at atmospheric pressure. Based on the flow rate the particles reach 5 mm distance after 2.4 ms while typical lifetimes for ionic species are in the range of tens of μs [47]. An exponential decay is expected as the transport and recombination of ions and energy dissipation of neutrals is collision-dominated. The slower decay at distances above 5 mm is mostly caused by the drop in radiation intensity, as the probe distance to the radiation source is increased, resulting in a quadratic decay. With both contributions present, a sum of an exponential and quadratic decay was fitted onto the measured total energy flux values exemplary for a negative biasing of −200 V. A fit function for the energy flux (EF)

was chosen, where d represent the distance from the jet output and a, b, c are the fitting parameters. The first term in equation (10) reflects the drop caused by recombination of ions on the probe surface and the second is due to radiation. The determined fitting parameters were used to plot both terms of the sum separately to show the different contributions for a −200 V bias of the probe. For all probe voltages, the ratio of the exponential term to the quadratic term is shown in figure 7(b). For the floating probe, no exponential part was seen, which indicates an insignificant amount of charged particles and neutrals reaching the probe after the floating potential was settled. Radiation seems to be the main contribution to the measured energy flux. The biased cases will be discussed below.
A model based on a Boltzmann type of sigmoid function was proposed for the distance dependence of the energy flux of CAP jets, which would result in a decreasing slope and constant values for short distances [16]. This constant behavior is not found here and a possible explanation is due to the measured applied electrical power shown in figure 8. The applied electrical power rises at distances below 5 mm, which changes the energy flux due to an effect of the probe on the discharge. Since the probe is blocking the laminar gas stream, turbulences and vortices will arise and prohibit the ions and metastables from evacuation by the gas stream. He metastables are highly energetic and can ionize N2 and O2 by Penning ionization [48]. The short-living free electrons produced by Penning ionization close to the nozzle at a time between two pulses may serve as seed electrons for ignition of the next pulse. Thus, the plasma ignites earlier during the applied pulse and more power can be supplied within the discharge.
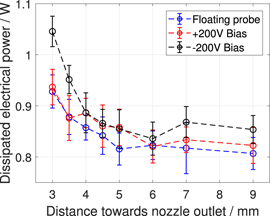
Figure 8. Applied electrical power calculated from the BCS data in dependence on the PTP distance and probe potential.
Download figure:
Standard image High-resolution imageFurthermore, an increase in the electron density measured by Thomson scattering in the presence of target materials was observed [12]. The electric field changes in presence of a target [49, 50] as well as the gas flow and He metastable production if a conductive target is brought into the effluent of a plasma jet [49, 51]. Even though these effects are not yet fully understood but cross-correlated to each other, it is feasible that the probe influences the discharge and the effect is stronger the closer it is to the source.
Penning ionization has been addressed before and further proof can be found in the measurements of the PTP potential, shown in figure 9. The floating potential of the probe was determined and stays nearly constant between the positive nanosecond pulses fired at 1 kHz. The depletion of surface charges was expected based on previous modeling [52], which predicts positive space charges on the surface and the plasma plume at the end of the positive voltage pulse. More indications for surface charges were seen in fluid dynamics measurements where it was suggested that the charged particles influence the flow pattern [38, 52–54]. These add up with the  and
and  ions formed by Penning ionization during transport to the probe surface by the laminar flow and charge it to 165 V at a 3 mm distance in 0.03 s. Thus, it was possible to confirm the previously predicted surface charges. Similar to the energy flux, the potential drops at larger distances and reaches zero between 7–9 mm, which indicates the range of ions produced through Penning ionization.

Figure 9. Probe potential measured by the Tektronix TPP0250 voltage probe as a function of distances towards the nozzle outlet for different probe biases. Statistical error bars are plotted for all points, although they are small.
Download figure:
Standard image High-resolution imageBiased probe. Figure 9 shows the measured probe bias as function of distance when the PTP probe was biased with both ±200 V. Using a positive and negative bias attracts and repels the charged species to better understand the different contributions of the measured integral energy flux. For a positive bias voltage, positive ions are repelled while negative ions and electrons are attracted. The influence of the positive bias on the energy flux measurements is shown in figure 7(a) (red symbols). A difference to the floating measurements is only visible at the shortest distance of 3 mm and surpasses the floating value slightly with 71 mW cm−2. This behavior is explained by the small potential difference shown in figure 9 between the floating probe and the biased one. Even without bias voltage the probe is charged to 165 V. Thus, the potential difference is only 35 V, which is not strong enough to repel positive ions as they follow the laminar flow due to the momentum transfer of neutral gas atoms during collisions. While the ion contribution stays similar to the floating case, additional negatively charged particles seem to reach the probe surface at very short distances and contribute to the energy flux. This is also shown in the ratio of the fit parts in figure 7(b). For distances below 4 mm an exponential part is visible. Due to the positive polarity of the voltage pulse negative ions are not as present. The electrical power in figure 8 shows no significant changes compared to the floating probe and, thus, the probe potential seems to have no influence on the discharge itself.
A negative biasing of the PTP results in an energy flux of 133 mW cm−2 for 3 mm distance (see figure 7(a)). Furthermore, a significant increase in the energy flux is visible up to 6 mm distance to the nozzle. The exponential part of the fit ratio shown in figure 7(b) even indicates a positive ion contribution up to 9 mm. This fact indicates a large contribution of positive ions to the energy flux and once again stresses the importance of Penning ionization. Contrary to negative ions, which are only formed directly in the discharge, positive ions are also formed due to Penning ionization if He metastables are present. With He metastables following the gas flow, positive ions can be formed at larger distances. With a potential difference of −365 V compared to the floating case, ions are attracted to the probe. This leads to an increased ion collection and an acceleration of impinging ions. The increased flux of ions is more likely to be the origin of the measured energy flux increase than the higher kinetic energy due to ion acceleration, because the mean free path is 68 nm in air [55] and 193 nm in He. A similar but less distinct effect was measured before in [17] with Ar as the working gas and a CAP jet operating in the turbulent regime. In Ar-driven CAP jets, Penning ionization is not strongly present and without the laminar transport to the probe, most ions are lost before reaching the surface (see section 3.2). Thus, different working gases result in different plasma chemical processes which change the composition of the energy flux.
The negative bias also influences the discharge itself, as can be seen in the applied electrical power. For distances of 3 and 4 mm, a significant increase in dissipated electrical power is measured. Furthermore, the pulse voltage decreased from 5505 ± 5 V for the floating and positive bias case to 5480 ± 5 V while the negative bias was applied. The lower necessary ignition voltage indicates an easier plasma ignition. With the existence of free electrons [12] under atmospheric pressure conditions, they could be pushed slightly backwards by electrostatic forces and serve as seed electrons for the next pulse. Another possibility would be the release of electrons from the copper substrate (probe) as the work function to overcome is decreased by the applied voltage. Secondary electron emission caused by the increased ion impact could also become more relevant. Nevertheless, further studies are necessary to prove these interpretations.
3.2. Influence of the flow rate
In order to investigate the influence of the gas flow rate, the PTP was mounted 4 mm away from the nozzle outlet without the co-flow device. The floating probe potential was measured using a digital multimeter and the voltage setting on the pulser was held constant during the measurement. The results for the measured energy flux and probe potential are shown in figure 10.
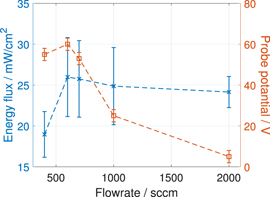
Figure 10. Energy flux and probe potential values as a function of the He flow rate. The PTP was mounted in a distance of 4 mm, no co-flow was used and the probe potential was measured using a multimeter.
Download figure:
Standard image High-resolution imageThe energy flux shows a strong increase from 400 to 600 sccm, as more particles are transported to the probe by the laminar flow. Further increase of the flow rate results in a slight decrease of the energy flux. Even though more particles could potentially reach the probe, the onset of turbulences enhances mixing between the energetic particles of the discharge and the cold particles of the ambient gas. This effect can also be seen in the floating potential of the probe (red data in figure 10) in a more illustrative manner. The charge of the probe rises until the flow becomes turbulent, at which point fewer He metastables and, thus, fewer positive ions reach the probe surface. Overall, these measurements suggest the possibility of making statements about the transition region from laminar to turbulent flow biased on PTP data for these discharges, which could be attractive for future applications due to the simplicity of PTP measurements.
The transition from laminar to turbulent flow is also visible in the electrical data of the BCS shown in figure 11. The maximum measured voltage, or measured pulse voltage, reaches its maximum at 700 sccm instead of 600 sccm as energy flux and probe potential measurements indicated. An explanation for this behavior is again the onset of turbulences starting at a greater distance to the nozzle. With increasing flow rate, turbulence onset moves closer to the nozzle as the strong decay to higher flow rates and the flow diagnostics have shown. With the turbulence present, more ions and He metastables can remain near the nozzle outlet generating seed electrons for the next ignition. Another indication for this speculative explanation is in the electrical power with its minimum at 600 sccm, where He metastables get depleted from the nozzle by the laminar flow. The rise in the applied electrical power with decreasing energy flux stresses the relevance of flow dynamics and suggests that flow pattern plays a more important role than the input power for surface treatments. This is a crucial result for designing efficient CAP jets, because working gas and electrical power could be optimized while achieving successful surface treatments.
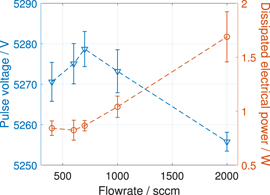
Figure 11. Evaluation of the BCS data related to the energy flux measurements for varied flow rates.
Download figure:
Standard image High-resolution image3.3. Influence of the shielding gas
The plasma chemistry of a CAP jet can be tuned by variation of the shielding gas to enhance NOx or Ox based reactions [15, 56, 57]. If ozone (O3) is produced in sufficiently large quantities and O3 is stable enough to take away their formation energy, a large O3 production could result in a loss of thermal energy.
The PTP was mounted at a distance of 4 mm, and the probe potential was measured with a multimeter. A He working gas flow of 500 sccm was used. Figure 12 shows that the co-flow was varied from pure N2 to an O2 shield around the He effluent with a total flow rate of 500 sccm. The measured pulse voltages and powers were constant during the measurements at 5711 ± 6 V and 0.98 ± 0.03 mW.
The energy flux values show no significant changes if the statistical error bars are considered. The measured energy flux drops with the introduction of O2 to the co-flow as expected, but rises again to its maximum at a O2 concentration of 60%, before dropping to its lowest value at 100% O2 shielding. To understand the rise between 10% and 60% of O2 admixture a combination of two possible effects is suggested. First, the total amount of chemical species (O radicals), which could react at and with the probe surface, rises. Second, and perhaps more importantly, the O2 in the shield gas results in a change of the ionization wave caused by the propagating electric field and the photoionization, followed by subsequent recombination of electrons and ions through the effluent. The so called propagation mechanism changes, as O2 tends to form negative ions that channel the electrons after leaving the nozzle [11]. Therefore, guided streamers are formed and the effluent could stay reactive over a larger distance. Saturation of this effect leads to the drop at high O2 concentrations (>60%) as the energy loss processes of O3 production and VUV absorption by O2 are taking over.

Figure 12. Energy flux and probe potential as a function of the co-flow composition. The PTP was mounted at a distance of 4 mm, the pulse voltage was set to 5711 ± 6 V, the electrical power was calculated to be 0.98 ± 0.03 W. The probe potential was measured using a multimeter. The He flow rate was set to 500 sccm and the total co-flow rate was also set to 500 sccm.
Download figure:
Standard image High-resolution imageThe channeling effect is also visible in the probe potential. At low O2 admixtures a drop in the potential is measured, probably due to negative ion formation. Increasing O2 content results in a fast potential increase, as the channel is formed and He metastables are produced over a larger distance. Furthermore, O2 is favored for Penning ionization due to its higher reaction rate of  = 17 × 10−11 cm−3 s−1 compared to
  = 8 × 10⁻¹¹ cm−3 s−1 for N2 [48]. At an 80% O2 content in the shield gas, the maximum potential of 136 V is reached as the channel is fully formed at even smaller concentrations and O2 is no longer the limiting factor for the Penning ionization process. The electric potential prohibits that more ions can reach the surface.
3.4. Influence of the applied electrical power
For the input power variation, again at a probe distance of 4 mm, a He flow rate of 500 sccm without co-flow, probe potential measurements via digital multimeter were chosen. The applied electrical power was varied by changing the pulse voltage. All results in this section are plotted versus the pulse voltage to examine correlation of the parameters. The results of the energy flux and probe potential measurements are shown in figure 13.
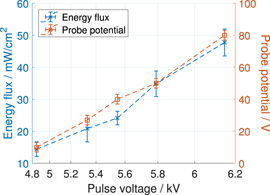
Figure 13. Thermal energy flux and probe potential as functions of the pulse voltage. The PTP was mounted in a distance of 4 mm, the He flow rate was set to 500 sccm without a co-flow and the potential was measured with a multimeter. The x-axis is scaled quadratic to show the quadratic coherence between the energy flux and the pulse voltage.
Download figure:
Standard image High-resolution imageWith increasing pulse voltage, a quadratic rise in the energy flux and probe potential can be seen. Based on equation (3), the quadratic dependence was expected, as was a linear dependence between the input power and the energy flux [26]. With the pulse voltage range limited by plasma ignition on the low limit and arcing at the high limit of operation voltage, it cannot be estimated whether this trend is limited due to geometrical factors which allow arcing, or other factors denying a better efficiency with even higher voltages. Furthermore, with the measured stronger rise of the probe potential compared to the energy flux, the He metastable and following Penning ionization process seems to become more efficient at higher voltages, since more ions charge the probe and, thus, contribute more to the charge than to the energy flux.
Relating electrical power to dissipated calorimetric energy. The following estimation helps to relate the energy flux measurements to the electrical power per pulse. To compare both values, the electrical power must be normalized by the breakdown area. The breakdown area, i.e. the discharge area, is assumed to be the same area as the ring-shaped cross-section between dielectric tube of the plasma jet and central pin electrode. The discharge area is, due to the cone shape of the pin electrode, between around 3 mm2 at the full electrode diameter of 1.2 mm to around 4 mm2 at the needle tip. Normalizing to a unit area of 1 cm2 results in a normalization factor between 25–33 used to calculate the electric energy flux in mW cm−2. The rescaled electrical power values for one pulse are the so called electric energy flux and show a good agreement with the thermal energy flux values shown in figure 14. Even though He tends to form a rather diffuse breakdown, the streamer mechanism [58] contradicts the assumption of a circular area. With an excitation frequency of 1 kHz and a resulting multiplication by a factor of 1000, the electrical energy flux is much larger than the measured thermal energy flux. While a larger value of the electrical power compared to the measured energy flux can be expected due to heating of the ceramic tube and conversion of electric power to chemical particle formation and radiation losses, the mismatch remains larger than expected.
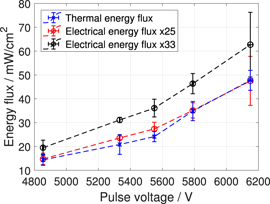
Figure 14. Relating to a circular area derived from the tip radius of the plasma jet, the electrical power was normalized to the area it enters the system using the model approach explained in the text. This enables a direct comparison between the applied electrical power, expressed electrical energy flux, and the measured thermal energy flux.
Download figure:
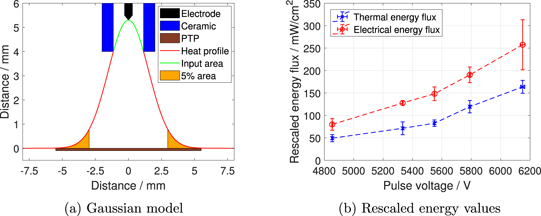
Standard image High-resolution imageNext we assume a Gaussian profile for the discharge generation and heat transport. A Gaussian profile is suited for energy flux profiles [26], etching [59] and deposition patterns [60] of jets. Furthermore, the heat transfer should follow the gas flow directed, collision-dominated diffusive transport [61]. The Gaussian is described by  , where l depicts the length scale in horizontal direction, a the profile height and c the width of the bell curve. The curve is given by the geometry of the experimental setup and illustrated in figure 15(a). Instead of a circle, the surface of the three-dimensional bell profile within the ceramic tube (shown in green) is used as the breakdown area to normalize the electrical power to the surface. The discharge pattern assumed here is promoted by excited and ionized species generated by previous pulses which serve as seed electrons for the next ignition as well as offer the shortest distance to the grounded electrode without a dielectric in between. The calculated surface area of the probe amounts approximately 7.38 mm2.
Figure 15. (a) 2D illustration of the Gaussian model approach to estimate the discharge and PTP area. The Gaussian is described by  with a = 5.3 mm and c ≈ 1.52 mm given by the CAP jet geometry and the PTP distance. The surface of the Gaussian within the ceramic tube is used as the input area. The effective PTP area is estimated by taking 95% of the Gaussian into account. (b) Thermal energy flux values normalized by the effective probe area and electrical energy flux values normalized by the Gaussian profile within the ceramic tube.
Download figure:
Standard image High-resolution image
To estimate the effective probe area, we use 95% of the Gaussian width at the surface based on the noise in the temperature measurements. Depending on the parameters, a temperature change between the probe's equilibrium temperature without plasma heating Teq,off and with plasma heating Teq,on amounts up to 5 K. The noise in the temperature measurements could amount up to 0.25 K, so changes in the magnitude of 5% cannot be detected. The effective probe area is estimated to be 27.71 mm2 and, thus, the calculated area is 1/3 of the full area of the PTP copper plate.
The rescaled power per area values are shown in figure 15(b). The agreement on the values is remarkably good. A power conversion of 60 ± 4% from electrical to calorimetric power is seen here, in good agreement with a previous calorimetric study which resulted in a conversion of 60%–80% [62]. While the chemical energy losses of atoms and molecules not interacting with the probe are probably negligible [62], radiation losses can play a significant role in the energy balance [63]. Other loss terms such as heating of the ceramic tube and the electrode should also add up with the previously mentioned contributions. Temperature measurements of these parts would help to estimate these losses in future experiments.
Despite the difficulty of giving absolute values, the demand for further studies is evident. Although both model approaches are simplified, one can compare the slopes and trends of the measurements with good agreement.
4. Conclusion
The energy flux of a nanosecond pulsed CAP jet was investigated and interpreted with respect to substrate distance, substrate bias, flow rate, input power and shielding gas. For an improved understanding of the energy flux, flow (Rayleigh scattering) and electrical (BCS) diagnostics were applied. The distance variation showed the expected decrease to larger distances. Negatively charged particles showed an effect on the energy flux up to a nozzle distance of 3 mm, while positive ions can be significantly detected up to 6 mm. This stresses the longer lifetime of ions compared to electrons on one side, but it also shows the effect of Penning ionization. He metastables are produced in the discharge and ionize N2 or O2 on their way towards the probe. The produced positive ions charge the PTP and a high floating potential of 165 V is measured. Furthermore, the PTP surface influences the discharge and changes its electrical characteristics for short distances and applied negative bias. At longer distances (>6 mm), radiation is the main source of the energy flux.
The flow regime (laminar or turbulent) changes the trends in the data drastically. Energy flux and probe potential drop as soon as the turbulent regime is entered because the charged particles and reactive species cannot reach the probe. Increasing the pure particle flow to the surface by increasing the flow rate is not necessarily beneficial for the surface treatment as the energetic particles get lost on the way to the substrate. For the design of an efficient CAP jet, it is important to be in the laminar regime to maximize the energy flux and, thus, the surface treatment success.
The energy flux measurements using a co-flow device to tune the plasma chemistry showed the limitations of the PTP in its current form but also proved potential of the PTP with future development, such as an increase of sensitivity and signal-to-noise ratio. Nevertheless, a thermal energy loss due to an increased O3 production was observed. Charging of the probe indicated a change of the streamer propagation and more efficient Penning ionization using O2 instead of N2 as collision partner for He metastables. With an increased resolution, it is possible to monitor energy losses caused by chemical reactions. The products of these reactions get lost without a reaction on the surface.
A linear correlation between the electrical input power and the measured energy flux (thermal energy) was found and two different approaches, one assuming a circular breakdown and one assuming a Gaussian profile for breakdown and plasma species propagation, were used to compare these energies. The Gaussian approach shows merit and should be refined in the future by further measurements and more precise fluid simulations. The stronger rise of the probe potential compared to the energy flux suggests a higher He metastable production compared to other plasma species.
In summary, this work has highlighted the complex mechanisms by which energy is transferred to surfaces by CAP jets. PTP, Rayleigh scattering and BCS have proven to be useful tools to characterize and understand plasma-surface processes, even at atmospheric pressure and with small energy fluxes. The presented correlations suggest the utility of the PTP for flow diagnostics on CAP jets. Verification of this application as well as refined modeling and measurement of non-equilibrium states has to be done in future work.
Acknowledgments
The authors thank N Tkach for his technical assistance. LH would like to thank Princeton University, especially Prof. Dr. Julia Mikhailova, for hosting as visiting student research collaborator and the German Academic Exchange Service (DAAD) for their financial support through the PROMOS program. BG gratefully acknowledges funding by the Army Research Office (ARO) (Grant W911NF15-1-0236 under Dr. Matthew Munson) and the National Aeronautics and Space Administration (NASA) (NNX16CA05C). Sandia National Laboratories is a multimission laboratory managed and operated by National Technology and Engineering Solutions of Sandia, LLC., a wholly owned subsidiary of Honeywell International, Inc., for the USDOE's National Nuclear Security Administration under contract DE-NA0003525. This paper describes objective technical results and analysis. Any subjective views or opinions that might be expressed in the paper do not necessarily represent the views of the USDOE or the United States Government. This material is based upon work supported by the Division of Chemical Sciences, Geosciences and Biosciences, Office of Basic Energy Sciences (BES), U.S. Department of Energy (USDOE). DF thanks the National Defense Science & Engineering Graduate Fellowship for their financial support. SR gratefully acknowledges funding by the Alexander von Humboldt Foundation and Princeton University. Data discussion and manuscript editing was performed during funding within the TransMedTech Institute by the Canada First Research Excellence Fund and Fonds de Recherche du Québec.
Data availability statement
The data that support the findings of this study are available upon reasonable request from the authors.