

Abstract
Laser induced fluorescence spectroscopy (LIF) is used to measure absolute ground state densities of nitric oxide (NO) in the effluent of the COST reference microplasma jet (COST-jet) with three-dimensional spatial resolution. The jet is operated in helium with a nitrogen/oxygen admixture. The experiments are performed with the jet expanding into open air and into a controlled He/synthetic air atmosphere. The most efficient production of NO is found at a 0.5% admixture of N2/O2 at a ratio of 4/1, that is considered to be synthetic air. Maximum NO densities of 3.25 × 1014 cm−3 and 4.5 × 1014 cm−3 are measured in the air and He/synthetic air atmosphere, respectively, at an axial distance of 2 mm from the nozzle. The distribution patterns are found to transit into a turbulent regime for air atmosphere at greater axial distances, while in the He/synthetic air atmosphere this effect is not observed. It is found that the expansion of the region of high NO density in the effluent is strongly coupled to the helium flow. Furthermore, the NO density is found to depend on the absolute feed gas flow, i.e. its maximum decreases as a function of the gas flow. This is a result of the longer residence time of the gas in the active plasma volume at lower gas flows and higher energy densities. For very high values of the applied radio frequency power the NO density is saturated. From time resolved measurements of the LIF signals the quenching coefficient for the NO(A2Σ+) state by air is found to be ku,air = 4.2(±0.5) × 10−11 cm3 s−1, while quenching by He is negligible, ku,He ⩽ 1 × 10⁻¹⁴ cm3 s−1. The amount of ambient air intruding the helium effluent is determined as well.
Export citation and abstract BibTeX RIS

Original content from this work may be used under the terms of the Creative Commons Attribution 4.0 licence. Any further distribution of this work must maintain attribution to the author(s) and the title of the work, journal citation and DOI.
1. Introduction
During the last decades non thermal atmospheric pressure plasmas jets (APPJ) received increased interest from a scientific and applications point of view. Heavy particles such as neutrals and ions in these discharges remain cold (i.e. near ambient temperature), while the electrons are heated to several thousands of Kelvin (Te typically reaches a few eV) by alternating electric fields in the active plasma volume. This leads to a strong thermal non-equilibrium between heavy particles and electrons, which provides the basis for a variety of chemical reactions, while the thermal stress for a treated sample remains low. These properties make APPJ advantageous for many applications, such as biomedicine or nanofabrication processes [1–5].
These plasmas are highly dynamic systems in which various plasma components such as (V)UV radiation, charged particles, electric fields and reactive species can contribute to processes and influence the plasma surface interaction. Due to the complex plasma chemistry various dissociation products are formed in plasmas containing admixtures of O2 and N2, such as atomic nitrogen (N), atomic oxygen (O) or hydroxyl radicals (OH), representing some of the highly reactive species. The generation of these reactive particles is largely determined by the spatio-temporal dynamics of energetic electrons in the active plasma volume. Understanding and controlling the electron power absorption dynamics, therefore, is crucially important to control/optimize their generation [6, 7, 8]. In addition to these primary reactive neutral species, secondary products are formed such as ozone (O3) or nitric oxide (NO) [9–12]. These species typically have longer lifetimes and are, therefore, likely to interact with any treated sample. In order to avoid potential health risks due to overdoses and to exploit the full potential of the applications a profound knowledge about the reactive species and their generation, distributions and absolute densities is crucially important.
While excess of NO was found to be harmful to the human body by e.g. triggering cytostatic and cytotoxic effects, at moderate concentrations it plays a vital role in many biological processes [13, 14]. It has an exceptionally long lifetime in biological systems (∼4 s) and reaches even up to 400 s in pure aqueous solutions [15, 16]. Additionally it diffuses rapidly through membranes and tissues and it is, therefore, proposed that NO is the only radical that is stable enough to act as an extracellular messenger and plays an important role for wound treatments by plasmas [17, 18].
Production of NO was intensively studied in the combustion community experimentally as well as from the modelling side [19–21]. In those thermal sources, the key reactions to create NO are considered to be caused by the so-called Zeldovich mechanism [22].


The rate coefficients k1,2(Tg ) show a strong dependence on the heavy particle temperature and are, thus, not expected to play a major role in non-thermal atmospheric pressure plasmas. The generation of NO in different atmospheric pressure plasma devices operated in He or Ar with admixtures of N2/O2 has been studied in other works [23–31]. In non-thermal plasma jets, NO is predominantly generated by the interaction of atomic nitrogen and oxygen with other molecular species in the background gas, e.g. NO2, O3, and O2. The generation of atomic species is affected by helium metastables. The addition of water vapour to the feed gas is known to influence the plasma chemistry. Hence, it might affect the NO densities in the plasma jet [23, 32–34]. However, this is excluded in this work by using stainless steel gas pipes and a tight system (leakage rate below 5 × 10⁻⁷ slm).
Due to the large variety of different plasma sources proposed over the last years results were hardly comparable and it turned out to be difficult to trace back the dependence of the plasma properties to the fundamental plasma processes. This is, however, crucial for knowledge based optimization of plasma jets especially for medical or surface applications. In this context, Golda et al introduced a reference source, namely the COST reference microplasma jet abbreviated in the following as COST-jet [35]. Spatial distributions of O and O3, inside and outside older versions of the jet operated in a He/O2 admixture (0.5%), were measured by Knake et al by Two-Photon Absorption Laser Induced Fluorescence [36], by Willems et al via quantitative molecular beam mass spectrometry [37] and also numerically modelled by Waskoenig et al [10]. Atomic oxygen is known to be highly reactive and important for many surface modification processes. Both, O and O3, play an important role in the kinetic reaction scheme to form or destroy NO [38–41]. However, these results were measured in prior (non-standardized) versions of atmospheric pressure plasma jets. Recently the importance of the tightness of the gas system and in particular the material of the tubes to suppress humidity was discussed by Winter et al [42]. This resulted in the requirement of a stainless steel system in the protocol to operate the COST-jet. For the COST-jet as a reference source profound knowledge about the fundamental plasma mechanisms, the reaction kinetics and the resulting density distributions is crucial. Not only in the plasma itself, but also in the effluent, which represents the interaction region for sample treatments, absolute densities of reactive species and their distributions are of central importance. In this context it is of interest to distinguish between 2 atmospheres. While in medical applications the jet is operated in open air, in surface modification processes it is possible to treat samples in a well defined gas mixture, minimizing or maximizing interactions and products that are undesirable or favourable for the respective surface. Furthermore, measurements in the controlled atmosphere facilitate approaches from the modelling site, since a well defined environment is created.
In this work, time averaged three-dimensional density distributions of ground state NO(X) in open air and in a He/synthetic air atmosphere are presented, measured by laser induced fluorescence (LIF) in the effluent of the COST-jet, in order to set benchmarks for hypotheses and modellers. Moreover, these results are relevant for applications, since they reveal details of the transport of NO(X) from the nozzle into the effluent, where samples would be placed to be plasma treated.
2. Experimental setup
2.1. Plasma source
The plasma source used in this work is the COST-jet [35]. It is driven by a sinusoidal voltage waveform at a radio frequency (RF) of 13.56 MHz. 0.2–2 slm of He (5.0 purity level) is used as feed gas with different reactive gas admixtures of O2 (4.8), N2 (5.0) or synthetic air (4.5), typically in the range of 0–2%. The jet itself consists of two parts, namely the housing and the head. The housing comprises an internal resonance coupling. Thus, there is no need for an external matchbox for this device. The coupling is realised by an LC circuit with a tuneable capacitor (C = 0.8–8 μF, L = 9.6 μH). The tuning capacitance is used to tune the circuit into resonance at 13.56 MHz. A shunt resistor of R = 4.7 Ω is used to measure the current as shown in figure 1.
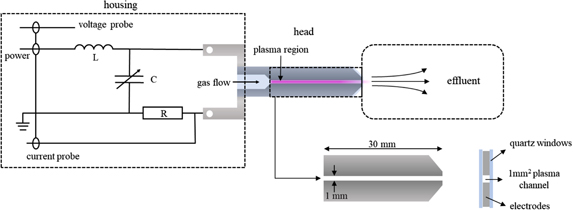
Figure 1. Sketch of the COST-jet. The internal resonance coupling is realized as an LC circuit mounted into the housing. The head comprises the electrode configuration where the plasma is generated. The discharge channel has a square cross section of 1 mm2 and is 30 mm long. This image is a modified version of a plot taken from [43].
Download figure:
Standard image High-resolution imageThe circuit has a high Q-factor of approximately 30, i.e. the input voltage is amplified by a factor of about 30, so that a power supply capable of around 15 V is enough to provide the voltage necessary for breakdown in between the electrodes that is in the range of VRMS ≈ 200–350 V (root mean square values) for the used gas mixture. Voltage, current, and their relative phase can be measured at the electrodes by integrated capacitive and resistive probes, respectively. In the jet power measurements are also performed by the internal probes yielding reliable results of the dissipated plasma power as described in detail in [44], while in older versions of the jet only the generator power was provided, without access to the power dissipated in the discharge. Hence, in this study, the mentioned power always describes the dissipated power in the plasma and not the applied RF power.
The head consists of two stainless steel electrodes of 1 mm width that are arranged in a plane parallel configuration with a discharge gap of 1 mm and a length of the discharge channel of 30 mm. They are fully covered by two quartz plates in order to confine the plasma in the 1 × 1 × 30 mm3 volume and to guarantee broadband optical access to the plasma channel. A sketch of the plasma source including the housing and the head is shown in figure 1. The source is operated with a steady gas flow and the discharge is generated in between the electrodes, where energetic electrons are generated and create reactive neutral species by electron impact dissociation of the background gas. The reactive neutral species are pushed out of the active plasma volume into the effluent by the gas stream where they finally interact with the treated sample.
The plasma source itself is placed inside a cylindrical vacuum chamber (40 cm diameter and height) and mounted on a motorized and vacuum compatible xyz-stage (Standa ltd.), so that all three spatial dimensions can be scanned with a maximum spatial resolution of 2.5 μm. For the experiments presented here the chamber is operated in two modes. First, the cover lid is opened, so that the jet is operated in ambient air and the NO density is measured as a function of the N2 and O2 admixture in close vicinity of the jet nozzle in the effluent to identify the optimum reactive gas admixture for NO production at this position. Second, the chamber is closed, pumped down, and operated in a controlled gas atmosphere. The pumping is done by a turbo-molecular pump, to a base pressure of pb ≈ 5 × 10⁻⁵ mbar. The leakage rate of the vacuum system is estimated to be below 5 × 10⁻⁷ slm. The chamber is then filled with He and the optimum admixture of N2 and O2 for NO production, that was identified in the frame of the first set of measurement in ambient air, at a pressure close to atmospheric pressure (≈970 mbar). This admixture is 0.5% of synthetic air. During the plasma jet operation, the pressure inside the chamber is kept constant using a PID controller (Pfeiffer RVC 300), a capacitance transmitter (Pfeiffer CMR 371) and a scroll pump (Edwards nxDS6i).
Three-dimensional spatially resolved measurements of the NO density are taken in the effluent as a function of the He gas flow in both modes of chamber operation, i.e. in a controlled gas atmosphere as well as in open air. The results are compared to identify the effects of the gas environment on the NO density distribution in the effluent. Such comparisons are particularly important for experimental verifications of simulation results, since in ambient air the amount of impurities and humidity is typically unknown and can be different depending on the location and time of operation. In simulations, however, a controlled gas environment is typically assumed. A simplified sketch of the experimental setup is shown in figure 2(a).

Figure 2. Sketch of the experimental setup for the LIF measurements. (a): vacuum chamber with the laser pathway and the optical setup. (b): zoomed view of the region where the NO density measurements are performed in the effluent including the plasma source and the used Cartesian coordinate system for the three-dimensional density distributions. The origin of the coordinate system is located at the end of the electrode tip centred between the electrodes and the lateral windows.
Download figure:
Standard image High-resolution imageThe coordinate system used for the experiments is shown in figure 2(b). The x-coordinate axis is perpendicular to the electrodes that are located at x = ±0.5 mm. The grounded electrode is located at x = −0.5 mm. The y-coordinate axis is perpendicular to the windows that are located at y = ±0.5 mm. This is also the direction of the laser beam. The z-coordinate axis points along the electrodes and the direction of the gas flow inside the jet, with positive values outside the plasma region. The origin of the system is located at the end of the stainless steel electrodes. Due to a 1 mm safety gap and further vignetting and reflection effects the first accessible point is at  , i.e. 2 mm away from the electrode tip in the effluent.
2.2. Laser induced fluorescence (LIF) of NO
The laser system used in this work consists of a dye laser (Narrowscan, RadiantDyes Laser GmbH) that is pumped by a frequency tripled Nd:YAG laser (Spitlight Compact DPSS, InnoLas Laser GmbH) at λ3ω,YAG = 355 nm. The used dye is Coumarin-47 that has a tuning range from 442–479 nm and its maximum efficiency at 460 nm. The emitted laser light from the dye laser is subsequently frequency doubled by a BBO crystal, finally yielding λ2ω,dye ≈ 226 nm at a repetition frequency of 100 Hz. Single pulses in this study typically reach energies up to Ep ≈ 50 μJ at pulse lengths of τp ≈ 5 ns and a spectral line width (FWHM) of 0.05 cm−1. For this energy range saturation effects of the LIF signals are not observed, which was checked by an energy dependent LIF measurement.
The laser beam is split in front of the entrance window of the reactor and partially guided onto a photo-diode (Thorlabs, SM05PD7A) in order to live monitor the single pulse energies during the measurements (see figure 2(a)). Beforehand an energy metre is used to cross calibrate the measured photo-diode values with absolute energies. This is necessary, since the energy metre is not fast enough to resolve single pulses and can, therefore, not be used to monitor these energies required for calibration and normalizing the LIF signals during the measurements. The laser beam is focussed into the discharge volume by a plano-convex quartz lens with a focal length of 100 mm to a beam waist of w0 ≈ 100 μm. The laser photons excite NO from the ground state into a higher electronic level according to the scheme NO(X2Π) → NO(A2Σ+) (v' = 0, v'' = 0), that represents the so called γ-band of NO, see figure 3. Here v' and v'' correspond to the upper and lower vibrational level of the involved transitions. Using this system allows to minimize the influence of O2, where the Schumann–Runge bands have strong absorption lines between 172–193 nm that lead to a known problem of interference with the NO fluorescence light from the γ-band [45, 46]. When passing the discharge volume, the transmitted beam is blocked by a black beam dump in order to avoid reflections and stray light from the chamber walls or other reflecting components into the light detection system. The fluorescence light corresponding to the transition NO(A2Σ+) → NO(X2Π) (v' = 0, v'' = 3) is detected at λF ≈ 257 nm with a spectral shift with respect to the excitation wavelength at 226 nm. From the interaction volume the fluorescence light is focussed by a two lens system into a 200 μm UV fibre (1:1 imaging) that eventually guides the light onto a photomultiplier (Hamamatsu R928). False light is suppressed by a bandpass-filter with a central wavelength and a FWHM transmitting light at λ0 = 257 ± 16 nm (FF01-257/12-25 by Semrock). The spectral separation of excitation and detection wavelengths is an additional feature to minimize stray light from the excitation laser itself. The PMT and the diode signal are constantly recorded during the measurements and the LIF signal is normalized by the laser energy for every single pulse.

Figure 3. Scheme of the transitions used for the experiments. Shown are the ground state denoted by 0, the upper excited state u and the continuum c. The different processes are indicated by arrows.  : excitation into any vibrational level v' of the upper state, where in this study v' = 0 and in the following text R0
u0:=Ru0 stimulated emission,
: excitation into any vibrational level v' of the upper state, where in this study v' = 0 and in the following text R0
u0:=Ru0 stimulated emission,  : spontaneous emission into different vibrational levels v'', where in this case v'' = 3 is used for detection, and Qu
: quenching.
: spontaneous emission into different vibrational levels v'', where in this case v'' = 3 is used for detection, and Qu
: quenching.
Download figure:
Standard image High-resolution imageIf the LIF experiments are performed in a regime of weak excitation, the signal will be directly proportional to the density of species in the ground state. In the following the involved electronic-vibronic states are denoted as 0 and u for the ground and the upper excited state and v', v'' for the upper and lower vibrational state, respectively.
The regime of weak excitation is characterized by the fact that spontaneous emission effects (Au0) dominate over ionization (Γu ) and stimulated emission (Ru0), so that Au0 ≫ Ru0 ≫ Γu (see figure 3). This can also be described in terms of cross sections for the different processes as σ0u ⋅ g(Δν) ≫ σi , where g is the convolution of the absorption line profile, g0u , and the laser profile gL:

σ0u and σi are the cross sections for the excitation from the ground state and for ionization, respectively. In this regime a dynamic equilibrium is established between excitation |0⟩ → |u⟩ and spontaneous emission from |u⟩ → |0⟩. Furthermore, the stimulated emission and the ionization can be neglected (Ru0 = Γu = 0). As the measurements are performed in the cold effluent region in the absence of charged particles, no higher states are populated and, hence, no contributions from higher states to the population of u are expected. Then the rate equation for the upper state simplifies to a single differential equation:

where Qu
= ∑j
ni
kuj
is the quenching rate for all possible collision partners leading to a radiation-less decay,  is the sum over all possible vibrational transitions from the upper (u) to the lower state (0) and
  is the excitation rate and νL the laser frequency. It can be shown that the integral solution for the density of the upper state is given by

By integrating the solution over the whole interaction volume and time, the absolute number of fluorescence photons is obtained as

where V and L are the interaction volume and its length, respectively and NL the number of laser photons. Equation (6) shows that, in the case of weak excitation, the fluorescence signal is directly related to the ground state density of the species of interest. More details on this topic can be found in [47].
To perform three-dimensional spatially resolved measurements of the NO density in the effluent, the jet is moved via the xyz-stage relative to the focus point of the laser, which corresponds to the position, where the NO density is measured. The spatial resolution of the single space coordinates is mainly determined by the beam waist w0 and the imaging system. In this case the beam waist is around 100 μm. In combination with the imaging system this results in a resolution of ≈200 μm for all three coordinates.
2.3. Calibration procedure
In order to obtain absolute densities, the experimental setup has to be calibrated. This is done by performing LIF measurements in a gas mixture with known NO density, ncal. We use a commercially available He/NO mixture (air liquide, He + 5% vol. NO). The procedure for the calibration is as follows: first the evacuated chamber is filled up with the He/NO admixture to about pcal ≈ 10 mbar. The density of NO, ncal, can be calculated via the ideal gas law,  , where kB is the Boltzmann constant and T = 293.15 K the room temperature. Afterwards the chamber is filled up close to atmospheric pressure ≈950 mbar (set well below lab pressure of 970 mbar to avoid overpressure and leaking of NO), with pure helium. After a LIF signal is recorded, the chamber is pumped down to ≈500 mbar and subsequently filled up with helium and the next LIF signal is taken. This procedure is repeated several times to adjust various degrees of dilution of NO in helium until the detection limit is reached. By recording the signals after each pumping iteration a linear ILIF(nNO) dependence is observed from which the absolute densities can be determined. The intensity of the LIF signal ILIF is directly proportional to the absolute number of fluorescence photons,
  , calculated by equation (6). Hence the fluorescence intensity is a linear function of the NO(X) ground state density.
The ground state density of NO(X), nNO, can then be calculated via the slope of the linear dependence as:

where Ecal and EL are the laser energies during the calibration and the performed measurements, respectively. Ical and ILIF are the measured LIF signals by the PMT during calibration and measurements and τ and τcal are the decay times of the LIF signal during measurements and calibration to account for different quenching according to


The decay times can be directly measured from the time resolved LIF signals during calibration and measurements, performing an exponential fit.
With this technique only vibrational ground state densities are measured. J Golda measured the temperature in the effluent of the COST-jet operated in He/0.5% O2 at P = 0.4 W to be around T ≈ 310 K at 3 mm in the effluent [43]. The lifetime of the NO(X2Π) is considered to be long enough for the vibrational population to reach equilibrium. Then the distribution follows a Boltzmann population according to

where Zvib is the partition function, which cancels out for relative expressions and Ev denotes the vibrational energy approximated by the harmonic oscillator as

with the vibrational quantum number v and the vibrational constants ωA = 2374 cm−1 and ωX = 1904 cm−1 taken from [48]. With these values a ratio of the first excited state and the ground state of nexc/ngnd ≈ 1.1 × 10⁻⁵ is calculated for Tvib = 310 K. Therefore, it is justified to neglect any vibrationally excited state.
3. Results
As already described in section 2.1, the power displayed in this section, refers directly to the dissipated power in the plasma and not to the applied RF power provided by the generator.
3.1. Determination of the optimum N2/O2 admixture ratio for NO generation
For many applications of plasma jets the efficiency of NO production is important, since typically the dissipated power is limited to avoid unwanted heating of the treated surfaces. Thus, for a given power dissipated to the plasma, also called plasma power in the following, the NO density in the effluent should be maximized. To identify the ideal admixtures of N2 and O2 to helium gas, these reactive gas admixtures are varied systematically at constant helium flow, pressure and power in the COST jet. The jet is operated in ambient air inside the open chamber and the NO density is measured by LIF as a function of the N2 and O2 admixtures in the effluent close to the nozzle at a distance of 2 mm at the position  . This position is chosen to maximize the LIF signal intensity, since the NO density is high at this position, and to minimize the influence of the surrounding air.
Two sets of data are taken, one to cover the full range of N2/O2 flow combinations with a step width of 2.5 sccm ( , see figure 4(a)). The second set of measurements focuses on reactive gas admixtures within the region of optimum admixtures found in the first dataset. However, now measurements are performed with smaller step width of 1 sccm according to
  and
and  to determine the optimum admixture ratio more precisely (see figure 4(b)). The helium flow is kept constant at 1 slm, while the plasma power is set to 0.5 W. For the admixture combinations used here, the highest NO density is found for a nitrogen flow of 8 sccm and an oxygen flow of 2 sccm, i.e. a flow ratio of 8/2, which corresponds to synthetic air. This means that admixing synthetic air yields the highest NO densities.

Figure 4. Normalized NO density at a distance of 2 mm from the nozzle ( ) in the effluent as a function of the N2 and O2 admixtures. The power is set to P = 0.5 W and the helium flow is kept at ΦHe = 1 slm.
Download figure:
Standard image High-resolution imageThe measurements presented in figure 4 are performed with a constant plasma power of 0.5 W. However, when operating the jet in different gas mixtures, different maximum powers can be applied, before the discharge transits into a constricted arc mode, which can destroy the jet. This is due to different power consumption mechanisms of the discharge and different kinetics when high amounts of molecular components are added. To investigate further operation regimes, the maximum applicable power before a transition into the constricted arc mode occurs, and the corresponding densities are recorded for every admixture. The results are displayed in figures 5(a) and (b), respectively.
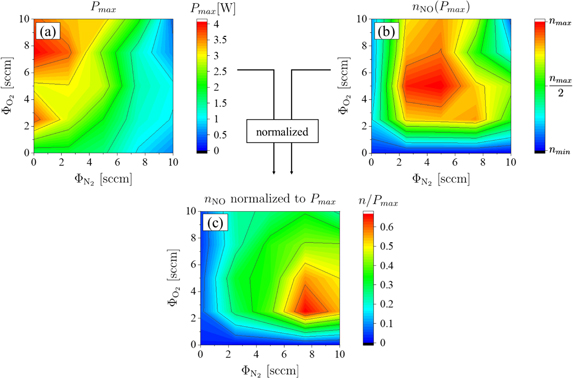
Figure 5. (a) Maximum power dissipated to the plasma before a transition into a constricted arc mode occurs as a function of the N2 and O2 admixture. (b) NO density measured at this maximum power (see (a)) as a function of the N2 and O2 admixture. (c) NO density obtained from (b) normalized by the maximum power obtained from (a). Signals are recorded at a position of  in the effluent.
Download figure:
Standard image High-resolution imageThe maximum dissipated power for synthetic air admixtures (≈1.4 W) is considerably lower than the maximum power for high admixtures of O2 combined with low N2 admixtures (≈4 W). However, in such high power regimes and in the absence of N2, the NO production is low. It is found that the maximum NO density will be formed, if 5 sccm of N2 and O2 are added, respectively, (see figure 5(b)) and the plasma power is about 2.7 W. However, upon normalizing the NO density by the maximum power at which the discharge can be sustained without transitioning into the constricted arc mode, the most efficient NO production is again found at an admixture ratio of N2/O2 = 8/2. This is the same admixture ratio, that was also found to be ideal at a power of 0.5 W (see figures 4(a) and (b)). This confirms the finding that this is the reactive gas admixture ratio at which the NO production is most efficient. Nevertheless, if the thermal sensitivity of the treated surface is no limiting factor for the maximum applicable plasma power and a high amount of NO is desired for a certain application, other operation regimes may be preferable as shown in figure 5(b).
3.2. Variation of the synthetic air admixture
In section 3.1, the optimum admixture ratio of N2 and O2 for the NO production in the COST-jet was found to correspond to synthetic air. Now, the total admixture of synthetic air is varied to identify the optimum synthetic air admixture for NO production. A helium flow of 1 slm is used and the admixture of synthetic air is varied from 0–1.1%. For each synthetic air admixture the NO density is measured at  in the effluent close to the nozzle.
Figure 6 shows the NO density measured by LIF as a function of the synthetic air admixture 2 mm away from the nozzle in the effluent of the COST-jet. Even without any admixture of synthetic air, small densities of NO are detected. These result from impurities in the gas pipes and cylinders that are sufficient to build up some NO. The maximum NO production is found at 0.5–0.6 % of synthetic air admixture, independent of the plasma power. This is in good qualitative agreement with measurements of the atomic oxygen density in older versions of the jet by Willems et al and Knake et al [36, 37]. Pipa et al measured the NO production rates in the kINPen jet as a function of the air admixture to argon gas at gas flow rates of 5–15 slm, which are higher compared to those used in this work. They found the maximum NO production to occur at 0.2% air admixture for a gas flow of 5 slm and at 0.07% air admixture at higher gas flows of 15 slm [25, 26].
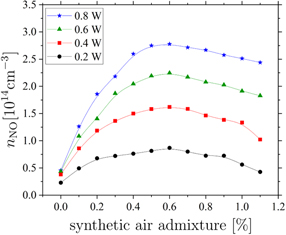
Figure 6. NO density as a function of the synthetic air admixture measured at  . Measurements are performed with ΦHe = 1 slm and the power is varied according to P ∈ {0.2, 0.4, 0.6, 0.8|in W}.
Download figure:
Standard image High-resolution imageThe dependence of the measured NO density on the synthetic air admixture shown in figure 6 can be explained as follows: at small reactive gas admixtures the electron energy distribution function (EEDF) is hardly affected by the admixed molecules. The NO production is low, since the production of N and O atoms, which are required to generate NO, is limited by the lack of N2 and O2 molecules. With increasing synthetic air admixture the dissociation probability increases and the densities of O and N increase. This leads to an enhanced production of NO and, thus, the NO density increases. For higher reactive gas admixtures, the shape of the EEDF is modified by the high densities of N2 and O2. Its high energy tail is depleted due to the high number of inelastic collisions caused by the presence of high amounts of these molecular gases [8, 49]. Consequently the NO production decreases towards higher admixtures of synthetic air. Additionally, due to the electronegativity of oxygen, the electron density will also decrease and electron impact dissociation of e.g. N2 and O2 will be less probable.
3.3. Power variation
The power dissipated to the plasma is varied from the lowest possible power, at which breakdown happens, to the maximum power, at which the plasma transitions into the constricted arc mode, to understand its effect on the NO density at the optimum admixture of 0.5% synthetic air to helium.
Figure 7(a) shows the measured power voltage characteristic of the jet for two different helium flows. A linear correlation between power and voltage is observed for low values of the power, that turns into a non-linear behaviour for higher powers. This is correlated to different electron power absorption modes at different powers, namely the Ω-mode at low powers and the Penning-mode at higher powers, that were investigated experimentally and computationally by Bischoff et al [6]. Due to the non-linear nature of the voltage power correlation in the Penning-mode, small fluctuations of the voltage can lead to large deviations in power. Therefore, it is preferable to measure in the Ω-mode to keep the power stable and measurements comparable. Figure 7(b) shows the NO density as a function of the dissipated plasma power. The first datapoints correspond to the power at which breakdown occurs for the respective helium flows. The datapoints at the highest powers correspond to a mode of operation shortly before the plasma transitions into the constricted mode. A strictly monotonous increase of the NO density from 0.3 × 1014 cm−3 → 2.4 × 1014 cm−3 for 2 slm helium flow and 0.6 × 1014 cm−3 → 3.2 × 1014 cm−3 for 1 slm helium flow with a respective admixture of synthetic air of 0.5% is observed that seems to evolve into an equilibrium like regime, where creation and loss mechanisms compensate each other at high powers. By fitting the data with a function of the form  , we find that limP→∞
nNO(P) = nlim, where ξ ∈ (0, 1) is a dimensionless constant depending on the discharge conditions and on how fast the equilibrium state is reached. For these measurements.
, we find that limP→∞
nNO(P) = nlim, where ξ ∈ (0, 1) is a dimensionless constant depending on the discharge conditions and on how fast the equilibrium state is reached. For these measurements.
and
Higher NO densities are observed at the lower helium flow under otherwise identical discharge conditions. However, the measured NO densities are below the exposure limit for humans within a period of 8 h, which is 25 ppm = 6.21 × 1014 cm−3 in France und USA, making it a safe device for biomedical applications [50].
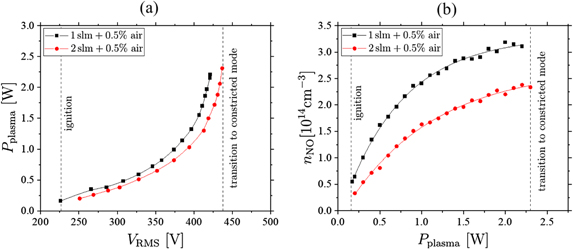
Figure 7. (a) Voltage-power characteristics of the COST-jet for two different helium flows and (b) the power dependency of the NO density with the corresponding fit functions measured at  . The synthetic air admixture is 0.5% in both cases.
Download figure:
Standard image High-resolution image3.4. Quenching of NO(A2Σ+) by air—Stern Volmer plot
One of the central aspects in atmospheric pressure plasmas due to the high collisionality is quenching. This is a radiationless de-excitation process which consequently decreases the fluorescence intensity and hence the lifetime of the respective excited state. From the time resolved LIF signals the lifetime of the NO(A2Σ+) state is determined at different positions in the effluent. It is possible to gain quantitative information about the quenching properties of the surrounding gas by measuring the effective lifetime in the presence of different densities of the quenching molecules. Neglecting photo chemical reactions the change of the population density of the excited state can be described by the following rate equation:
where nu and n0 correspond to the population densities of the excited and the ground state of NO, respectively, A0u is the excitation rate from the ground state of NO into the excited state, Au0 is the Einstein coefficient for spontaneous emission, and kuj as well as nj are the quenching coefficient and the density of a certain quenching species j. In our LIF experiments, the population of the excited NO state is mainly caused by the laser light. The fluorescence is measured after the laser pulse, so that A0u nNO = 0. Based on this, equation (14) can be solved for nu (t) and an exponential time dependence is found with a lifetime τq defined as:


where equation (15) is known as the Stern–Volmer equation, and represents a linear relation between  and the neutral gas density of the air admixture, nair, with the slope of τ0
ku,air, which is also known as the Stern–Volmer constant Kd. Rewriting equation (15) yields equation (16), which allows to determine the quenching constant from the slope of a plot of
and the neutral gas density of the air admixture, nair, with the slope of τ0
ku,air, which is also known as the Stern–Volmer constant Kd. Rewriting equation (15) yields equation (16), which allows to determine the quenching constant from the slope of a plot of  vs nair.
For the determination of the quenching coefficient of NO(A2Σ+) by air, the quenching coefficient of this state with helium must be found first. To do this, the chamber was pumped down and afterwards filled up with a commercially available He/NO mixture to ≈5 mbar. By subsequently filling up the chamber only with helium we found that the lifetime of NO is not changed significantly, which verifies that there is no or only very little quenching of NO(A2Σ+) by helium. In fact, a linear fit yields a quenching rate coefficient of ku,He ⩽ 1 × 10⁻¹⁴ cm3 s−1. This small quenching coefficient justifies neglecting quenching by helium in the procedure to determine the quenching rate coefficient of air. For this reason the lifetime measured in the pure He/NO admixture in the absence of synthetic air of τ0 = 205 ± 10 ns is considered to be close to the natural lifetime without quenching. This agrees well with results of other publications, where the lifetimes vary from τ = 215 ± 20 ns [51] to τ = 209 ± 10 ns [52] and τ = 192.5 ns [53]. Adding synthetic air leads to a decreasing lifetime, which is measured as a function of the quencher density. A linear dependence of the lifetime ratios on the quencher density is observed, until a plateau is reached (see figure 8). This plateau is caused by the laser pulse width (FWHM) of 5 ns and corresponds to the lower detection limit. Hence the grey shaded area is excluded from the linear evaluation of the lifetime decrease. The plotted fit yields a slope of ku,air = 4.2(±0.5) × 10−11 cm3 s−1. This fits well to the findings of Lee et al [54].
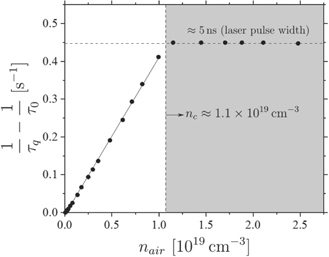
Figure 8. Stern–Volmer plot to deduce the quenching coefficient of NO(A2Σ+) by air. The solid line shows the linear fit from which the quenching rate is determined.
Download figure:
Standard image High-resolution image3.5. Air intrusion into the plasma effluent
From the lifetimes of the time resolved LIF signals, the amount of air diffusing into the plasma effluent can be deduced by assuming a gas composition that only consists of helium and air. The measured fluorescence lifetime τq is
with

where ξHe and ξair ∈ [0, 1] is the fraction of helium and air, respectively. τHe is the lifetime measured during calibration (no quenching) and τair = 0.96 ns is the lifetime in pure air atmosphere that was deduced from the extrapolation of the linear fit shown in figure 8. The fraction of air can then be calculated via

The fraction of air, that intrudes the helium gas stream expanding from the nozzle of the jet, is shown in figure 9. The black dashed line indicates the equidensity line for which nair = nc (see figure 8) at which the error becomes considerably large due to the detection limit of the diagnostic. Once the quencher density exceeds a critical value, nc, a plateau is reached due to the detection limit which is determined by the finite laser pulse length (see figure 8). This critical density is determined as nc ≈ 1.1 × 1019 cm−3 which equals about 45% of air intrusion. The highest NO density is observed at x = z = 0, because the production of NO is maximum inside the plasma jet and the NO gas stream is well shielded by helium from quenching by air. As the NO gas stream expands further away from the nozzle, more and more air intrudes the gas stream and consequently the NO density drops.

Figure 9. Air intrusion into the helium gas stream expanding from the outlet of the plasma jet. The black dashed line indicates the equidensity line for which nair = nc (see figure 8) at which the error becomes considerably large due to the detection limit. The gas flow is ΦHe = 1 slm with 0.5% admixture of synthetic air. The power is P = 0.6 W.
Download figure:
Standard image High-resolution image3.6. Two-dimensional NO density maps in the effluent (xz-plane)
In this section, two-dimensional density maps of NO in the xz-plane inside the effluent are shown for different helium flows in ambient air as well as in a helium with 0.5% admixture of synthetic air atmosphere. According to figure 2(b) the z-direction corresponds to the axial distance from the jet nozzle and the x-direction corresponds to the interelectrode position. Figure 10 shows a comparison between the density distributions of NO in air (top row) and in He/synthetic air (bottom row) atmosphere at different helium flows.

Figure 10. Two-dimensional density maps of NO in the xz-plane in the effluent. Top row: ambient air; bottom row: He + 0.5% synthetic air atmosphere. The associated coordinate system is introduced in figure 2. The columns correspond to different helium flows according to ΦHe ∈ {200, 400, 1000|in sccm}, while the power is kept constant at P = 0.6 W. The colour scale bars are in units of 1014 cm−3. The dashed lines show the trajectory calculated by equation (21). The vector represents the orientation of gravity.
Download figure:
Standard image High-resolution imageFigure 10 shows that NO expands much further into the ambience for higher helium flows in both atmospheres. This happens due to the increased initial velocity of the gas particles leaving the jet, that can be calculated as vgas(ΦHe) = ΦHe/Ad, where Ad = 1 mm2 is the cross section area of the discharge. The gas velocities vary from vgas (200 sccm) = 3.3 m s−1 up to vgas (2000 sccm) = 33 m s−1. Moreover, the region of high NO density is found to expand further into the effluent in helium with 0.5% synthetic air admixture compared to ambient air. This enhanced expansion happens both in axial and transverse direction.
To understand this observation, the axial density profiles and gradients in z-direction are analysed in order to determine density drops and deduce appropriate treatment distances for applications. To account for the buoyancy, that is clearly observed, the profiles should not be extracted simply by taking the on axis values for x = 0. Therefore, the measured images from figure 10 are transformed into bigger matrices via the Renka–Cline interpolation [55].
This transforms the images into 51 × 51 matrices. Subsequently the maximum value of each of the 51 columns is extracted and put into an array. Afterwards an exponential decay of the form

is fitted, where n0 is the maximum density at Figure 11. (a) NO density profiles along the axial z-axis and the corresponding exponential fit in air and He/synthetic air atmosphere and (b) the corresponding absolute values of the gradients ∇z
nNO = |∂nNO/∂z| calculated from the fit. Here ΦHe = 200 sccm and the power is kept constant at P = 0.6 W. Download figure: , L is the decay length and noff is a possible offset. From the derivative of this function the gradient ∇z
nNO = ∂nNO/∂z is calculated. One example is shown in figure 11. Here the 200 sccm case from figure 10 is used to calculate these profiles. This procedure is done for all the investigated flows and the results are presented in table 1.
, L is the decay length and noff is a possible offset. From the derivative of this function the gradient ∇z
nNO = ∂nNO/∂z is calculated. One example is shown in figure 11. Here the 200 sccm case from figure 10 is used to calculate these profiles. This procedure is done for all the investigated flows and the results are presented in table 1.
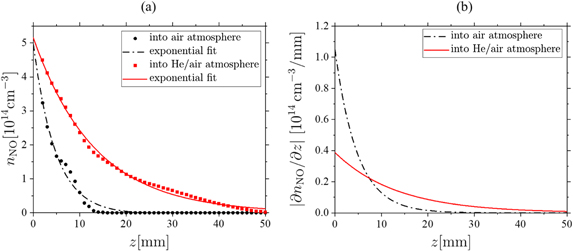
Table 1. Flow dependencies of NO densities in air and He + 0.5% synthetic air atmosphere. Shown are the respective fit parameters extracted from a fit function of the form nNO(z) = n0 exp{−z/L} + noff.
| ΦHe [sccm] | n0 [1014 cm−3] | L [mm] |
 [ [ ] ] | |||
|---|---|---|---|---|---|---|
| Air | He/synthetic air | Air | He/synthetic air | Air | He/synthetic air | |
| 200 | 3.3 | 4.5 | 4.8 | 13.3 | 0.7 | 0.3 |
| 400 | 3.0 | 4.5 | 11.1 | 19.3 | 0.3 | 0.2 |
| 600 | 2.7 | 17.4 | 0.2 | |||
| 800 | 2.2 | 21.9 | 0.01 | |||
| 1000 | 2.0 | 2.8 | 24.5 | 30.3 | 0.08 | 0.06 |
| 1200 | 1.6 | 26.9 | 0.06 | |||
| 1600 | 1.2 | 21.1 | 0.05 | |||
| 2000 | 0.9 | 23.2 | 0.03 | |||
They found a strong exponential decay on a length scale of only 2–10 mm. This predominantly happens due to the reactions O + O2 + M → O3 + M and O + O3 → O2 + O2 [58]. This enhances the destruction of NO even more, since the destruction rate of the reaction NO + O3 → O2 + NO2 is two orders of magnitude larger than the creation rate for the reaction N + O3 → NO + O2 [38]. This leads to a fast destruction of NO in the air atmosphere in contrast to the He/synthetic air atmosphere, where these reactions will not happen to such extent. For the 200 sccm case the density decreases from the maximum of nNO ≈ 3.2 × 1014 cm−3 to about nNO ≈ 1.1 × 1012 cm−3 within 10 mm in ambient air, which yields an estimation of the detection limit. Contrary to that, in the He/synthetic air atmosphere even at z = 30 mm a notable density of NO is present (figure 11(a)). A similar behaviour is observed for 400 sccm, where the density drops from nNO ≈ 3.4 × 1014 cm−3 to zero within approximately 23 mm in ambient air, while in He/synthetic air even at z = 50 mm still nNO ≈ 0.5 × 1014 cm−3 is measured. The results for all investigated flows are presented in table 1.
Figure 10 shows that the NO density distribution in the effluent is affected by buoyancy. Comparing the density of NO with the surrounding atmosphere consisting of air, one finds for standard conditions that ρNO = 1.250 kg m−3 > ρair = 1.204 kg m−3. Hence due to gravity, the NO gas stream might be expected to be directed towards the ground. However, since the jet is operated in helium as feed gas and ρHe = 0.179 kg m−3 ≪ ρair, the NO trajectories must be coupled to the helium. An estimation of the trajectory of pure helium particles is calculated by assuming an initial velocity v0(ΦHe) depending on the helium flow and an interaction between helium and air corresponding to Stokes friction. The equations of motion for both components x and z can then be written as

where m is the mass, g is the gravitational acceleration, β = 6πrη is the Stokes friction coefficient, with the dynamic viscosity η, r the radius of a spherical particle and ρ is the density of the respective species at 293.15 K. These two differential equations are solved with the boundary conditions  ,
,  and x(0) = z(0) = 0. Here, the angle α compensates for a tilt of the jet nozzle itself, due to minor horizontal misalignments that are not preventable and slight natural fluctuations of the gas stream. In this case during the fitting procedure the angles were found to be small in the range of α ∈ [0.5–1]°. Combining the solutions of this equation system yields an expression of the form x(z, ΦHe, α) that reads:
where ψ := g(ρair/ρHe − 1) is the effective acceleration in the x-component due to gravitation and buoyancy without any friction and Ξ := m/β in units of s is used as a fitting parameter that accounts for the friction. The trajectories calculated by equation (23) are shown in figure 10 in the top row as black dashed lines. Indeed we find excellent agreements for all investigated flows, keeping Ξ = 3.5 × 10⁻³ s. Due to this agreement of the NO distribution compared to the trajectories calculated for helium, this is an indication that NO is closely coupled to the helium gas stream. Based on that model another important parameter, Dz , can be derived from the solution for z(t, ΦHe, α) as

where the limit
yields an estimation of the upper limit for the propagation of NO in axial direction in the effluent and, therefore, the upper limit for distances at which any sample can be treated for a given flow. This limit is given by the initial momentum of a particle in z-direction, pz , divided by the Stokes friction coefficient. The maximum distance scales linearly with the flow of the feed gas. Additionally a prediction of the point of intersection with a sample placed in the effluent is possible.
The absolute densities show an inverse proportionality to the helium flow (see figure 12(a)). This agrees with the findings of Douat et al and Iseni et al [27, 50]. For lower flow rates the residence time of particles in the discharge is larger. The residence time of the gas particles inside the discharge channel can be calculated via

where Vd is the discharge volume and ΦHe the feed gas flow. This higher residence time might lead to enhanced dissociation and production of the atomic species, such as N and O, that are important for the production of NO. Furthermore, it should be noted, that we kept the power constant for the measurements. A higher volume flow, therefore, leads to a lower energy density in the plasma, calculated by w = P/ΦHe, that influences the kinetic reactions. In order to correlate these quantities to the NO densities, the maximum NO density for each investigated flow and the gas residence time are plotted as a function of the helium flow. Moreover, the NO density is plotted as a function of the energy density (see figure 12). For high flows the density follows an inverse dependence on the helium flow, that resembles the dependence of the residence time on the gas flow. For smaller gas flows, however, a deviation from this trend is observed (see figure 12(a)). This might be due to turbulence at the jet nozzle for low flows. The plot of the NO density against the energy density shows a similar trend as the power dependency of the NO density (see figure 7(b)) and indeed a similar function can be fitted. This verifies that the NO density saturates for very high powers or small flows i.e. in both cases high energy densities. However, if the density dependence was a pure effect of the energy density, the limiting values of the fit functions should converge to comparable densities. As this is not the case, our findings are a result of the combination of the increased energy density and the longer interaction times in the plasma channel.
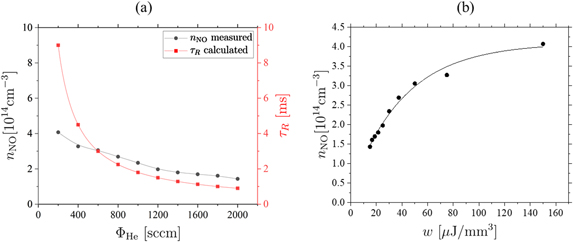
Figure 12. Maximum absolute NO density (a) and the neutral gas residence time, τR, as a function of the helium flow and (b) as a function of the energy density, w, in the plasma. Measurements are taken at  and P = 0.6 W in air atmosphere.
Download figure:
Standard image High-resolution image3.7. Two-dimensional NO density maps in the effluent (yz-plane)
Figure 13 shows yz density maps of NO in the effluent of the COST-jet in the x = 0 plane for ΦHe = 1 slm. This orientation is a top view of the effluent with the gravitational vector pointing into the paper plane. The associated coordinate system can be found in figure 2. The outlet of the plasma channel in transverse direction ranges from −0.5 mm to 0.5 mm. The maximum density is found at the central position of the nozzle where an NO density of nNO = 2.3 × 1014 cm−3 is measured in air atmosphere. This agrees well with the measured densities corresponding to the air, power and flow variations presented in figures 6, 7 and 12, respectively. The density in axial direction drops to about nNO = 1.1 × 1014 cm−3 at z = 20 mm distance from the nozzle. However, it should be noticed that the density profiles in axial direction extracted from these graphs are only measured in the x = 0 plane. Figure 10 shows that NO is coupled to the helium flow and experiences buoyancy in x-direction.

Figure 13. (a) and (b): two-dimensional density maps of the NO density in the yz-plane inside the effluent for air and He + 0.5% synthetic air atmosphere. (c) and (d): y profiles extracted from (a) and (b) for different z distances. x = 0 for all plots here. The associated coordinate system can be found in figure 2. The helium flow is kept constant at ΦHe = 1 slm and the power dissipated in the discharge is P = 0.6 W.
Download figure:
Standard image High-resolution imageThe NO density profiles in y-direction (transverse to the gas flow) are shown in figures 13(c) and (d) for different axial distances from the nozzle. The highest density is found at y = z = 0, which represents the centre of the outlet. The transverse distributions in y-direction show Gaussian profiles for small axial distances z, whose FWHM increases for bigger distances, eventually evolving into non-Gaussian, more turbulent distributions. This can also be seen in figures 13(a) and (c), where the distribution looks fairly laminar until around z ≈ 15 mm, where a turbulent behaviour sets in. Reuter et al [34] and Iseni et al [59] also observed a transition into turbulent flow patterns for the kINPen jet, where it is attributed to an excess of the critical Reynolds number. However, in our experiments the Reynolds number in the discharge tube for the highest investigated flow is about Re(2000 sccm) ≈ 320, well below the critical value of Rec ≈ 2300. The deviation from a Gaussian profile can be explained by two main processes. One of them is quenching that either chemically converts NO to other species or just de-excites the NO(A) state without radiation processes, hence it cannot be detected by the LIF technique. The other process is collisions between the helium, NO and air particles leading to momentum transfer and distraction from its original path. According to the findings in section 3.6, we concluded that the propagation of NO particles is strongly coupled to the helium flow. Therefore, a deflection of helium from its trajectory can also disturb the Gaussian profile of the NO distribution. The collision frequency between a particle A and other collision partners j can be estimated by a hard sphere model of the classical collision theory as [60]
where nA
and nj
are the densities of the respective species,  is the collision cross section with r the radii of the collision partners, kB is the Boltzmann constant and
  the reduced mass of particles A and j. The radii of N2 and O2 were estimated by G. Barrow from their co-volume as rO2 ≈ 1.47 Å and rN2 ≈ 1.57 Å [61] while the van der Waals radius of a helium atom can be estimated to be rHe ≈ 0.3 Å. The collision frequency is, therefore, a function of the density and the equivalent radii of both collision partners. This means that as soon as a significant amount of air diffuses into the helium gas stream and causes collisions, the NO density profile is disturbed from its original pattern. The normalized collision frequency along the
  axis between NO and air as well as between He and air was calculated based on the density profiles extracted from figure 9 and equation (27) and are shown in figures 14(a) and (b), respectively.
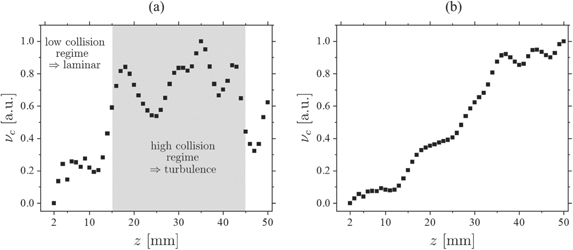
Figure 14. Normalized collision frequency along the axis  between (a) NO and air molecules and (b) helium and air. The flow for this example is ΦHe = 1000 sccm and the power dissipated to the plasma is P = 0.6 W.
Download figure:
Standard image High-resolution imageFigure 9 shows that up to about z = 15 mm the gas stream is shielded well from the surrounding, whereas beyond this point larger quantities of air intrude the gas channel and consequently the density of air increases causing intense quenching and collisions. This is verified by the calculated collision frequency shown in figure 14. The number of collisions between NO and air remains low until approximately z ≈ 15 mm and steeply increase beyond this value causing turbulent behaviour. At the same time the collision frequency between helium and air increases monotonically with increasing distance fostering the turbulence. This fits well with the distances found in figure 13 where also at around z ≈ 15 mm a significant deviation from the Gaussian profiles is observed. Considering a particle of the surrounding atmosphere at rest, the fraction of energy transferred during an elastic collision process of helium with a particle of species i can be calculated via

where mi is the mass of the collision partner of species i and ϕ is its deflection angle after the collision. Therefore, the energy transfer is very ineffective in the air atmosphere, since mHe/mair ≪ mHe/mHe = 1. Additionally the quenching process is also much more pronounced in the air atmosphere, since air is a much stronger quencher than helium (see section 3.4).
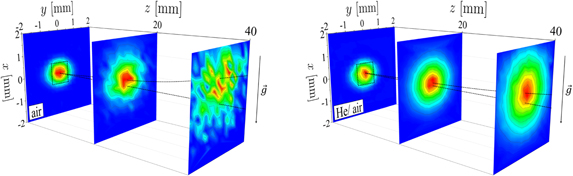
Figure 15 shows yz-slices for different heights x ⩾ 0. The bottom image shows the distribution for x = 0, which represents the inter electrode centre of the discharge gap and corresponds to the images shown in figure 13.
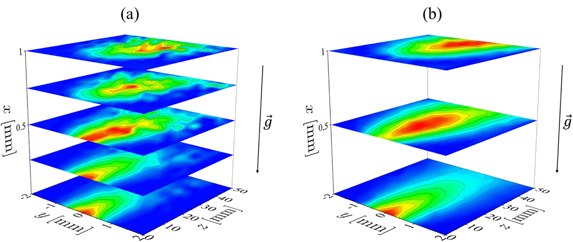
Figure 15. Two-dimensional maps of the NO density in the yz-plane in the effluent (a) for air and (b) He + 0.5% synthetic air environment. Displayed are contour slices at different heights in the effluent (i.e. for different values of x). The associated coordinate system is shown in figure 2. The helium flow is kept constant at 1 slm and the power dissipated in the discharge is 0.6 W.
Download figure:
Standard image High-resolution imageThe maximum of the scale is set with respect to each slice in order to emphasize the distribution patterns itself rather than the absolute density relations that are already shown in the sections before (see figure 12(a)). Five slices are presented for the air atmosphere according to different heights of x ∈ {0, 0.25, 0.5, 0.75, 1|in mm} and three slices for the He/synthetic air atmosphere referring to x ∈ {0, 0.5, 1|in mm}. The gap of the discharge channel extends up to x = 0.5 mm, where reactive species can be effectively created inside the plasma core. For heights greater than this value mainly buoyancy and diffusion are responsible for the distributions. It is clearly observed that the distribution in air atmosphere becomes apparently turbulent while in the He/synthetic air atmosphere the streamlines show a laminar pattern. The height at which the turbulence occurs fits well to the findings of figure 9. Up to about x = 0.5 mm intrusion of air happens only to small extents for z ⩽ 13 mm and beyond this point the fraction of air becomes higher. This fits very well to the turbulence pattern observed in figure 15(a) in the x = 0.5 mm slice that is quite laminar up to z = 13 mm and becomes turbulent at larger distances. For heights beyond x > 0.5 mm the patterns are solely turbulent due to the strong influence of air as described above. None of these turbulences are observed in the helium case.
3.8. Two-dimensional NO density maps in the effluent (xy-plane)
The third orientation that is investigated is the xy plane perpendicular to the gas stream axis. The xz- and yz-maps described before correspond to views from the side and from the top onto the effluent of the jet, whereas now a front view onto the jet is presented. The results shown here are for ΦHe = 1000 sccm. Three slices are measured corresponding to z = {2, 20, 40|in mm}. For the 1000 sccm of helium flow, these are three meaningful distances, since it was observed before that at z ≈ 15 mm the influence of the air becomes noticeable and a transition to the turbulent distribution sets in. Figure 16 shows the results for (a) air and (b) He + 0.5% synthetic air atmosphere, respectively. Again, the scales are set to the maximum of each single slice.
Figure 16. Two-dimensional maps of the NO density in the xy-plane inside the effluent for (a) air and (b) He + 0.5% synthetic air environment. The associated coordinate system is shown in figure 2. The He flow is kept constant at 1 slm and the power dissipated to the plasma is P = 0.6 W. The dashed bottom line represents the line through the origin of the xy components according to  , the upper line visualizes the buoyancy of NO when expanding into the effluent and the dashed square in the z = 0 plane indicates the dimensions of the jet nozzle.
Download figure:
Standard image High-resolution image
The square in the z = 0 plane indicates the dimensions of the jet nozzle. The dashed bottom line represents the line through the origin of the xy components according to  , the upper line visualizes the buoyancy of NO when expanding into the effluent. The NO density distributions in both atmospheres are quite similar at the nozzle, since in both cases the species have just left the jet (first measurement point 2 mm outside the active plasma volume), where the intrusion of air into the helium gas stream is low and no significant interaction with air takes place. It can be stated from these measurements that at this position any obvious traces of the rectangular structure of the discharge volume have disappeared and radial distributions are observed. This can be understood by the fast destruction of higher radial modes that would be required to describe the rectangular structure, so that the assumption made in previous chapters when discussing radial distributions instead of transverse distributions is demonstrated to be valid. The NO density map at z = 20 mm shows that NO has spread radially symmetrically in both cases. Small differences are observed between the ambient air and the He + 0.5% synthetic air atmosphere at this distance from the nozzle. In the air atmosphere, the distribution has not yet become turbulent. However, the contour-lines at the boundaries are not as smooth and well shaped as in the He/synthetic air atmosphere. This is a first indication of turbulence setting in. This was also observed in figure 10(c). The maximum density is still located at the centre of the whole distribution pattern in both atmospheres. At larger distances from the nozzle, e.g. at z = 40 mm, the differences become very obvious. In the air atmosphere, no clear pattern is visible and NO is completely stochastically distributed due to collisions and quenching. In the He/synthetic air atmosphere, even at those large axial distances from the nozzle the distribution is still very similar to the distribution leaving the jet at z = 2 mm except for the radial expansion that is slightly more pronounced in the x direction creating an elliptical distribution.
4. Conclusions
LIF was used to measure absolute values of the NO density in the effluent of a capacitively coupled atmospheric pressure micro plasma jet (COST-jet) with three-dimensional spatial resolution. Measurements were performed in open air and in a controlled He/synthetic air environment. The maximum NO production efficiency (with respect to the dissipated power in the plasma) is found for a 0.5% admixture of a gas mixture with the ratio of N2/O2 ≈ 4 that is commonly considered as synthetic air. The maximum absolute density of NO is found for a different admixture of 5 sccm of N2 and O2, respectively. This is due to the stability of the jet at higher powers for this gas mixture, before the discharge transitions into a constricted arc like mode, which can destroy the jet. Two-dimensional maps of the NO density in the effluent were measured in different planes, that provide an overview of different regimes of NO generation efficiency and sustainable powers. These insights provide the opportunity for knowledge based development and optimization of applications of the COST-jet, that rely on the generation of NO.
From the time resolved LIF signals the lifetimes of NO(A2Σ+) were measured. The quenching rate coefficient of this state by air was determined to be ku,air = 4.2(±0.5) × 10−11 cm3 s−1, while the quenching by helium is negligibly small (ku,He ⩽ 1 × 10⁻¹⁴ cm3 s−1). From those lifetime measurements the intrusion of air into the helium gas stream was estimated. It was found that approximately in the first 15 mm beyond the nozzle NO is well shielded from the ambient atmosphere by helium and beyond this point air intrudes the gas stream and disturbs the NO gas stream.
Two-dimensional density maps of NO corresponding to different planes were measured in the effluent and a strong buoyancy of NO was observed. Due to the fact that NO is affected by buoyancy, despite ρNO > ρair, it was concluded that NO must be coupled to the feed gas, i.e. helium. The trajectories of helium atoms were calculated by a simple model taking into account the buoyancy and Stokes friction. Excellent agreement was found with the measurements verifying this coupling of NO to helium. The differences of quenching in air and helium were found to affect the two-dimensional density maps of NO by leading to longer decay lengths from the nozzle of NO in the He/synthetic air atmosphere (13.3 mm for ΦHe = 200 sccm) as compared to pure ambient air (4.8 mm for ΦHe = 200 sccm). These differences get smaller with increasing helium flow. The NO distribution becomes turbulent in the air atmosphere for greater axial distances (z > 15 mm), while in the He/synthetic air atmosphere the distribution patterns do not change significantly. This is not attributed to the Reynolds number that stays well below the critical value of Rec ≈ 2300 for all investigated flows and is mainly caused by elastic and inelastic collisions i.e. quenching in air, which is stronger in air compared to helium with 0.5% synthetic air admixture.
These differences are an important finding for applications of the jet: during surface treatments it is desirable to have a defined area or spot that is treated by a well known flux of reactive particle species. If, for example, biological tissue is treated, a treatment in a controlled helium atmosphere is usually not possible and, therefore, the operator should be well aware of the fact that he must not exceed a certain distance between the jet nozzle and the treated surface. This is different from the processing of other surfaces, where the surfaces might be treated in a controlled atmosphere and, therefore, this allows to use larger treating distances with well defined density distributions and absolute species densities at the surface. However, it must be taken into account that the presence of a target in the effluent and made of a certain material itself will influence the chemistry and reaction kinetics, potentially affecting the NO distribution. The influence of different targets on the atomic oxygen distribution in the effluent of a μAPPJ was investigated by Schroeder et al [62] and was found to be different for reactive and inert targets. Since atomic oxygen is important for the NO production, this might indicate that the NO distribution is also affected.
Acknowledgments
This work was funded by the German Research Foundation (DFG) in the frame of the Collaborative Research Centre CRC1316 'Transient atmospheric plasmas: from plasmas to liquids to solids' (projects B2 and A4).