

Abstract
Tailored voltage waveform, composed of a fundamental frequency and the second harmonic, is applied to a capacitively coupled chlorine discharge operated in the pressure range 1–50 Pa. The electronegativity is very high and the electron power absorption is mainly due to drift-ambipolar (DA) electron power absorption within the electronegative core. For operating pressures of 1 and 10 Pa the creation of a dc self-bias and asymmetric response is demonstrated and applied to control the ion bombardment energy while the ion flux on the electrodes remains fixed. However, the available range in mean ion energy is rather limited and the range is significantly narrower than typically observed for electropositive discharges. For operating pressure of 50 Pa it is not possible to control the ion bombardment energy by the phase angle between the fundamental frequency and the second harmonic. At the low pressure of 1 Pa the power absorption by  ions dominate, while power absorption by electrons is smaller. At higher operation pressure DA power absorption by electrons dominates. The electric field within the electronegative core is high and not constant within the plasma bulk and exhibits the waveform of the discharge driving voltage for both the single frequency and dual frequency operation.
Export citation and abstract BibTeX RIS

Original content from this work may be used under the terms of the Creative Commons Attribution 4.0 licence. Any further distribution of this work must maintain attribution to the author(s) and the title of the work, journal citation and DOI.
1. Introduction
The capacitively coupled discharge typically consists of two parallel metallic electrodes, separated by a few cm, with one electrode grounded and the other driven by an rf voltage or current source [1, 2]. A neutral process gas is injected between the electrodes, and with the application of suitable voltage and driving frequency, breakdown occurs and a stable discharge forms. The neutral gas pressures are typically in the range 0.1–100 Pa, the driving voltage amplitude is few hundred volts, and the driving frequency between hundreds of kHz and hundreds of MHz. Due to this high driving voltage the plasma potential oscillates to large amplitudes, and a large time-averaged value, which accelerates ions from a few tens to few hundreds of eV before bombarding the electrodes. The discharge properties are described by parameters such as electron energy and density, density distribution of heavy charged and neutral species, and ion bombardment energy and flux which are dictated by the operating conditions of the discharge. Therefore, these discharge properties dictate the outcome of the process, including etch rate, uniformity, etch profile (anisotropy), and selectivity of the material being treated or exposed to the plasma (the substrate) and placed on one of the electrodes.
In a simple single frequency (SF) discharge the driving voltage is increased to achieve increased ion flux. However, this also leads to increased ion bombardment energy. Separate control of the ion flux and ion energy can be obtained over a certain range of the parameter space by making use of dual-frequency (DF) discharges, where a high frequency (HF) (typically 27.12 MHz) is used to control the plasma density and thus ion flux toward the electrodes, while a lower frequency (LF) (often 1–2 MHz), controls the ion bombarding energy [3, 4]. The HF source is expected to determine the plasma density, the ion flux to the substrate and therefore the throughput of the process, while the low frequency (LF) source is supposed to control the ion energy distribution (IED) and the ion angular distribution (IAD). However, such an independent control is only achievable for a narrow parameter range due to coupling between the two driving frequencies [5, 6] and due to the influence of secondary electrons [7, 8] and is therefore rather limited. These discharges are referred to as 'classical' DF discharges. Another approach, that allows separate control of the ion flux and ion energy in a capacitively coupled discharge, has been suggested by forming an electrically asymmetric discharge in otherwise a geometrically symmetric reactor [9]. This is achieved by applying voltage at two or more frequencies, a fundamental frequency and its harmonics. By adjusting the phase angle θ between the fundamental and the second harmonic a dc self-bias voltage can be generated, and hence the ion bombarding energy can be controlled. The ion flux is mainly dependent on the applied voltage amplitude and consequently a separate control of the ion energy and ion flux can be achieved using this method. This approach was later verified both experimentally [10] and by using particle-in-cell (PIC) simulations [11] of a geometrically symmetric capacitively coupled discharge and coined the electrical asymmetry effect (EAE). Any waveform applied to generate an EAE can be said to be a tailored waveform and various theoretical, numerical and experimental work on the topic have been reviewed recently by Lafleur [12]. Applying arbitrary non-sinusoidal waveforms composed of multiple harmonics (multi-harmonic waveforms), can create dc self-bias and asymmetric plasma response, for perfectly geometrically symmetric systems. The electrically asymmetric plasma response that arises from the application of tailored waveforms can be divided into [13, 14]: the amplitude asymmetry effect (AAE) and the slope asymmetry effect (SAE). The AAE appears due to the difference between the maximum and minimum values of the driving voltage waveform, while the SAE (sawtooth-like waveforms) arises from the different positive and negative slopes of the applied voltage waveform. The EAE has been demonstrated to efficiently control the mean ion bombarding energy  while the ion flux Γi remains constant for electropositive capacitively coupled discharges operated in α-mode [11, 15, 16]. When the discharge is operated in α-mode the ionization is dominated through sheath expansion power absorption by the electrons. Almost all these studies have been made on electropositive argon discharges operated at fundamental frequency of f = 13.56 MHz where the mean ion bombarding energy at both electrodes can typically be varied by a factor of roughly 2 by tuning θ in the range 0°–90° while maintaining the ion flux nearly constant [9–11]. The available control factor for the mean ion energy is found to decrease to about 1.2 for fundamental frequency of 1 MHz, but the ion flux to both electrodes remains roughly constant as θ is varied in the frequency range 0.5–60 MHz [17]. Therefore, EAE is not as effective to control the mean ion bombarding energy as the energy range is limited at low driving frequencies. At higher pressures when the ionization is dominated by secondary electrons at times of high sheath voltage, and the discharge is operated in γ-mode, the mean ion energy
  can still be tuned by adjusting the phase angle of the even harmonics but the ion flux is no longer constant [18].
In electronegative discharges, large electron density gradients develop and exhibit local maxima in the electron density at the bulk-sheath interface which leads to generation of ambipolar fields. Drift fields can also arise due to the low bulk plasma conductivity. Therefore, there is a simultaneous presence of both ohmic power absorption (Ω mode) and electron power absorption due to the ambipolar field in electronegative discharges. These fields can accelerate the electrons and are thus referred to as the drift-ambipolar (DA) electron power absorption mode [19, 20]. The DA-mode is characterized by a high ionization rate and high electron energy within the plasma bulk. The ohmic power absorption by the electrons within the plasma bulk is caused by the significant density of negative ions within the electronegative core and, therefore a depleted electron density. The consequence is reduced electrical conductivity within the plasma bulk and the creation of an enhanced bulk electric field that is required to drive the current. The ions are too heavy to respond to the HF field and therefore they do not contribute ponderable to the current flowing through the discharge. This causes the electrons to be accelerated to high energies within the bulk. By decreasing the argon content in a CF4/Ar discharge a transition from the α-mode to the DA electron power absorption mode is observed while a significant change in the plasma symmetry, the dc self-bias, and the mean electron energy occurs [21]. This has also been demonstrated experimentally, in a capacitively coupled SF6/O2 discharge driven by tailored voltage waveforms, that higher electronegativity significantly influences the dc self-bias, as its available range with phase angle θ is decreased [22]. This is suggested to being due to an electron power absorption mode transition and SAE is found to dominate over AAE in the highly electronegative discharge [22]. Also Bruneau et al [13] demonstrate control of the ion energy, while significant changes are observed in the ion flux, as well in a CF4 discharge operated at 80 Pa. However, they report that the variation in the mean ion energy is not linear with the phase angle θ. It is clear that operating in DA mode has a significant influence on the properties of DF discharges including the creation of a dc self-bias via the EAE. Furthermore, it limits the ability to separately control the mean ion energy and the ion flux at the electrodes [19]. Therefore, the electron power absorption mode can strongly affect the control of ion properties via the EAE.
The chlorine discharge is often applied for etching in integrated circuit manufacturing, as has been reviewed recently by Donnelly and Kornblit [23]. In particular chlorine and chlorine-containing plasma discharges are used to etch poly-silicon, aluminum, and compound semiconductors. The chlorine based plasma chemistries are often used when it is desired to achieve highly anisotropic etching for conducting materials [24, 25]. The Cl2 molecule has rather low dissociation energy (2.5 eV), a high electron affinity (2.45 eV), and a very low (near zero) threshold energy for dissociative attachment. Furthermore, atomic chlorine exhibits the highest electron affinity of all the elements or roughly 3.6 eV. The etching of silicon by a chlorine discharge has been extensively studied over the past few decades [24, 26–30]. The chlorine discharge serves as the source of both ions and neutrals for the etching process. It is generally accepted that the Cl atoms are the primary reactant in the etching process and the bombardment of the substrate by positive  and Cl+ ions will significantly enhance the etch process. In ion-enhanced etching, bombardment by ions accelerates the reaction of the etchant radical with the substrate being etched. The positive ions, mainly created in the plasma bulk, gain energy as they are accelerated through the space-charge sheath adjacent to the electrodes. Various combinations of bombarding ions and reactive neutrals and their influence on the etch rate has been investigated throughly and the etch yield is found to scale roughly with the square root of the incident ion energy while it also depends strongly on ion-to-neutral flux ratio [29, 30]. Furthermore, the etch rate will saturate at low ion-to-neutral flux ratio. Also, bombardment by ions with very high bombarding energy tends to cause damage to the material being treated and lead to creation of defects. Thus, the range of the ion energy and ion-to-neutral flux ratio has to be carefully controlled for both high quality and high throughput in industrial processes. The IED and the IAD on the substrate dictate the etch profiles.
Earlier we developed a reaction set for particle-in-cell/Monte Carlo (PIC/MCC) simulation of the chlorine discharge [31]. We have explored the influence of discharge pressure on a voltage driven SF capacitively coupled chlorine discharge [31] and the role of the driving current amplitude, driving frequency and secondary electron emission on a current driven SF capacitively coupled chlorine discharge [32]. Furthermore, we explored a 'classical' DF capacitively coupled chlorine discharge [32, 33] and a current driven DF capacitively coupled chlorine discharge where the parameters of the HF and the LF sources were varied independently [34]. As the driving HF is increased, the average sheath potential and the HF component of the voltage decrease dramatically as the plasma impedance for the HF component decreases. However, as the driving LF is increased, the electron power absorption, the ion flux, and the average sheath potential remain almost invariant.
Here, we use a 1d-3v particle-in-cell/Monte Carlo collision (PIC/MCC) simulation to explore voltage waveform tailoring of a capacitively coupled chlorine discharge. The chlorine discharge is highly electronegative and this has a significant influence on the discharge properties such as the electron power absorption. In the capacitively coupled chlorine discharge the electron power absorption occurs mainly through DA process within the electronegative core and in particular at higher operating pressures the electron power absorption within the electronegative core dominates the ion power absorption in the sheath regions. The variation of the plasma parameters, including the charged particle densities, the electron power absorption, the reaction rates, and the IED of positive ions reaching the electrodes will be explored as the phase angle between the fundamental frequency and the second harmonic, and the discharge pressure, are varied. In section 2 the PIC/MCC code and the assumptions made are discussed, and in section 3 the results are discussed. This includes the electron power absorption mode, the electronegativity and the controllability by the tailored waveform. Furthermore, the findings are discussed with respect to earlier studies of the capacitively coupled chlorine discharge. A summary and conclusions are given in section 4.
2. The simulation
The one-dimensional object-oriented PIC/MCC code oopd1 [35–37] is applied to explore a capacitively coupled chlorine discharge operated with tailored voltage waveform. In 1d-3v PIC codes the model system has one spatial dimension and three velocity components. The approach taken here is hybrid in the sense that a global model [38, 39] is used to determine the dissociation fraction, nCl/ng, where nCl is the density of Cl atoms and ng is the density of the Cl2 feedstock gas molecules.
The species considered in the chlorine PIC/MCC model consists of the ground state molecule Cl2 ( ), the ground state atom Cl(2Pu), the negative ion Cl−(1Sg), the positive ions Cl+(3Pg) and
  (2Πg). The reactions assumed in our PIC/MCC study include the electron impact collisions, ionization, attachment, detachment and dissociation, and heavy particle collisions such as ion-ion neutralization and charge exchange. These reactions and the cross sections assumed have been described in detail in the earlier work [31] which explored a capacitively coupled chlorine discharge driven by a voltage source operated at 13.56 MHz within the pressure range 0.67–13.3 Pa. Energy and scattering angles of the elementary collision processes such as electron–neutral, electron–ion, ion–neutral, and neutral–neutral collisions are implemented in the same way as in the xpdp1 code and discussed by Vahedi and Surendra [40]. However, the oopd1 and xpdp1 use different algorithms for the scattering of the incident and ejected electrons in the sense that in oopd1 a relativistic treatment of the electrons is used and a revised differential cross sections for electron scattering have been implemented [37]. All particle interactions are treated by the Monte Carlo method through a null-collision scheme [41]. In the oopd1 code the dc self-bias is calculated iteratively ensuring that the charged particle fluxes averaged over one period of the fundamental driving frequency are equal on both the electrodes [42, 43].
In oopd1 different particle weights can be implemented for each species. The particle weight is the ratio of the number of real particles to computational particles. The initial density profiles of the charged particles were taken to be parabolic and a sub-cycling factor of 16 was used for the heavy particles [44]. The neutral particles are only tracked kinetically if their energy exceeds a preset threshold value, while the charged particles are tracked for all energies. The thresholds were chosen in order to keep the number of simulated particles within a suitable range, typically 104–105 particles. Particles with energy below this threshold energy are assumed to have a fixed density with a Maxwellian velocity distribution at the neutral gas temperature Tn = 26 mV. The threshold is chosen to be 500 meV for both Cl atoms and Cl2 molecules for all discharge conditions explored in this current study.
The stability and accuracy of the explicit leap-frog method is ensured by fulfilling the conditions ωpeΔt ⩽ 0.2 and Δx ⩽ λDe, where Δt is the time step,  is the electron plasma frequency, Δx is the grid spacing and
  is the Debye length. Therefore, to ensure the accuracy of the null collision method, the time step Δt should be short enough so that the likelihood of more than one collision per particle per time step is kept low. Thus, we choose a time step that fulfills νmaxΔt ≪ 1, where νmax is the maximum collision frequency within the discharge. Here the simulation grid is uniform and consists of 1000 cells. In this pressure range an electron time step of 1.84 × 10⁻¹¹ s is sufficient. The simulation was run for 5.5 × 10⁶ time steps or 2750 rf cycles. Equilibrium for all particles is reached in roughly 1700 rf cycles and the time averaged plasma parameters shown, such as the particle densities, and the electron power absorption rate, are averages over 1000 rf cycles.
The main difficulty when modeling and simulating molecular gases is due to the large timescale difference between the processes of dissociation and the processes involving charged particles. For a pure Cl2 feedstock gas, Cl atoms are formed mainly through electron impact dissociation of Cl2 molecules. Therefore, a global model [38, 39] is used beforehand to determine the partial pressure of Cl atoms under certain control parameters including the discharge pressure, the absorbed power and the gap separation between two electrodes, etc. The absorbed power determined by the PIC/MCC simulation is used as an input parameter in the global model calculations, iteratively. The fraction of Cl2 molecules and Cl atoms obtained from the global model calculation is then used as the fraction of Cl2 molecules and Cl atoms in the neutral background gas in the simulation. However, a global model is mainly developed to model a high density low pressure discharges such as inductively coupled plasma (ICP) discharges, rather than capacitively coupled plasma (CCP) discharges. The sheath is mostly neglected, power absorption is assumed to be uniform and a given electron energy distribution function (EEDF) is assumed in the model and all the densities are assumed to be volume averaged. The proportion of the power absorbed by the electrons in ICP is much larger than in CCP. Consequently, the application of a global model will lead to overestimation of the Cl atom density within the discharge, especially when operating at low pressure. The partial pressure of Cl and Cl2 calculated by the global model and used to determine the background partial pressures of the thermal neutrals are listed in table 1. The values agree with the experimentally determined values where it has been observed that the fraction of Cl atoms is roughly a few percent at 1.33 Pa when the absorbed power is lower than 10 W [45–47].
Table 1. The partial pressures of the thermal neutrals at 1, 10, 25, 35 and 50 Pa found by global model calculations and used for the fixed neutral background partial pressures in the PIC/MCC simulations.
| p (Pa) | Cl | Cl2 |
|---|---|---|
| 1 | 0.0422 | 0.9578 |
| 10 | 0.0638 | 0.9362 |
| 25 | 0.0246 | 0.9754 |
| 35 | 0.0218 | 0.9782 |
| 50 | 0.1790 | 0.8210 |
The surface recombination coefficient for Cl atoms dictates the fraction of Cl atoms that are incident on the surface and recombine to form Cl2 molecules. This is an important parameter that dictates the dissociation fraction of the Cl2 molecules, as well as the negative ion density in a chlorine discharge [48]. The Cl recombination coefficient measured by Kota et al [49] for anodized Al is about 0.2 and for stainless steel it is about 0.85 at room temperature but drops to 0.3 at 350 K which are much larger values than those measured by Stafford et al [50–52], who found values in the range 0.01–0.1 for anodized Al and stainless steel. The difference between the measured values is explained by the passivation of the plasma chamber toward Cl-atom recombination [50]. In this current study, we assume that as a Cl atom hits the electrode, it is quenched and returns as a thermal Cl atom with 50% probability or it recombines to form a thermal Cl2 molecule with 50% probability, which is consistent with our previous studies [31–33]. For this current study both the electron reflection coefficient and the secondary electron emission yield at the electrodes are set to zero.
We assume a geometrically symmetric capacitively coupled discharge where one of the electrodes is driven by an rf voltage

for SF operation and

for dual frequency operation, while the other electrode is grounded. Here V0 is the voltage amplitude, f the fundamental frequency, and t is time. For this current study we assume the discharge to be driven with voltage amplitude of V0 = 222 V at fundamental frequency f = 13.56 MHz with electrode separation of 25.4 mm and a capacitor of 1 μF connected in series with the voltage source, while the discharge operating pressure is varied in the range 1–50 Pa.
3. Simulation results
In the limit of low power and high pressure (>10 Pa) the electronegative discharge tends to almost fill the entire gap between the electrodes, and in a first approximation the positive and negative ion densities can be assumed to exhibit parabolic profiles, with a much smaller uniform density of the electrons, except at the plasma sheath interface [53, 54]. Thus the electronegative discharge consist of an electronegative core and an electropositive edge region, and the electropositive regions may be small. For high electronegativity, the positive and negative ions have approximately the same parabolic density profile, while the electron density is uniform and relatively small. Figure 1 shows the charged particle density profiles for a discharge driven with a SF 222 V voltage source at 13.56 MHz (upper row) and a discharge driven with dual frequency 111 V voltage source at 13.56 MHz and 111 V voltage source at 27.12 MHz and phase angle θ = 0° (lower row). Figure 1 shows how the  and Cl− ions dominate the charged particle density within the electronegative core for all cases. For SF operation at 1 and 10 Pa the
  and Cl− ion profiles are parabolic as seen in figures 1(a) and (b), respectively. For a DF discharge with phase angle θ = 0° the
  and Cl− ion profiles at 1 and 10 Pa exhibit slightly distorted parabolic profiles as shown in figures 1(d) and (e), respectively. At 50 Pa the
  and Cl− ion profiles are more flat and exhibit some structure, mainly close the sheath edge, in the case of SF operation (figure 1(c)) while in the case of DF operation the ion density profiles are highly asymmetric and apparent structure is observed in the density profile, in particular close to the driven electrode (figure 1(f)). These fluctuations in the density profile are indication of striation structures that have been observed in highly electronegative discharges in CF4 [55] and oxygen [56] when operated at this high pressure. The density of all the charged particles increases, and the sheath width is small and decreases, with increased pressure as shown in figures 1(a)–(c), for 1, 10 and 50 Pa, respectively, for the SF operation and figures 1(d)–(f), for 1, 10 and 50 Pa, respectively, for the DF operation with θ = 0. Figure 1 shows that the electron density within the electronegative core is low and uniform, 3.8 × 10¹⁴ m−3 at 1 Pa, 6.8 × 10¹⁴ m−3 at 10 Pa, and 2 × 10¹⁵ m−3 at 50 Pa for the DF case. A drift electric field develops within the plasma bulk as a consequence of the low conductivity due to the low electron density and the fact that the plasma bulk is resistive. In all cases the electron density profile exhibits a peak at the bulk-sheath interface. The DA electron power absorption mode generally exhibits a strong electric field within the plasma bulk (the electronegative core) [19, 57, 58]. This electric field is a combination of the drift field and an ambipolar field. The ambipolar field is caused by this local maxima in the electron density close to the sheath edge and therefore a steep electron density gradient. Consequently, there is a local maxima in the electric field at the sheath edges. The Cl+ ion density is smaller than the electron density for all cases explored.

Figure 1. The time-averaged density of charged particles in a parallel plate dual frequency capacitively coupled chlorine discharge with electrode separation of 25.4 mm driven with a 222 V SF voltage source at 13.56 MHz at pressure of (a) 1 Pa, (b) 10 Pa, and (c) 50 Pa, and driven with a dual frequency 111 V voltage source at 13.56 MHz and 111 V at 27.12 MHz and phase angle θ = 0° at pressure of (d) 1 Pa, (e) 10 Pa, and (f) 50 Pa. Note that the powered electrode is on the left-hand side and the grounded electrode is on the right-hand side.
Download figure:
Standard image High-resolution imageFigure 2 shows the spatio-temporal behavior of the effective electron temperature for a parallel plate capacitively coupled chlorine discharge with electrode separation of 25.4 mm, for discharges driven with a SF 222 V voltage source at 13.56 MHz (upper row) and DF discharges driven by a 111 V voltage source at 13.56 MHz and 111 V voltage source at 27.12 MHz and phase angle θ = 0° (lower row). The effective electron temperature is given by  where
where  is the average electron energy. Figure 2 shows the effective electron temperature as a function of position between the electrodes within one rf period for 1, 10 and 50 Pa. At 1 Pa (figures 2(a) and (d)) and 10 Pa (figures 2(b) and (e)) we see that the effective electron temperature peaks at the sheath collapse and remains high within the plasma bulk (the electronegative core) throughout the rf period. Furthermore, we see that the effective electron temperature peaks within the plasma bulk during the sheath collapse phase. This indicates a strong ionization in front of the rapidly collapsing sheath, due to contributions of a drift electric field within the electronegative core and ambipolar electric field at the sheath edge, which accelerate electrons toward the electrode. At 50 Pa (figures 2(c) and (f)) the effective electron temperature is somewhat lower within the plasma bulk throughout the rf period but exhibits more structure. However, a peak in the effective electron temperature on the bulk side during sheath collapse is observed. The effective electron temperature depends on the operating pressure and the time-averaged center effective electron temperature increases with decreasing pressure from 4.3 eV at 1 Pa, 3.2 eV at 10 Pa to 2.9 eV at 50 Pa.

Figure 2. The spatio-temporal behavior of the effective electron temperature in a parallel plate capacitively coupled chlorine discharge with electrode separation of 25.4 mm driven with a 222 V voltage source at driving frequency of 13.56 MHz at (a) 1 Pa, (b) 10 Pa, and (c) 50 Pa and with a 111 V voltage source at 13.56 MHz and 111 V at 27.12 MHz and phase angle θ = 0° at (d) 1 Pa, (e) 10 Pa, and (f) 50 Pa. Note that the powered electrode is on the left-hand side and the grounded electrode is on the right-hand side.
Download figure:
Standard image High-resolution image
Figure 3. The spatio-temporal behavior of the electron power absorption for a parallel plate capacitively coupled chlorine discharge with electrode separation of 25.4 mm driven with a 222 V voltage source at driving frequency of 13.56 MHz at (a) 1 Pa, (b) 10 Pa, and (c) 50 Pa and with a 111 V voltage source at 13.56 MHz and 111 V at 27.12 MHz and phase angle θ = 0° at (d) 1 Pa, (e) 10 Pa, and (f) 50 Pa. Note that the powered electrode is on the left-hand side and the grounded electrode is on the right-hand side.
Download figure:
Standard image High-resolution image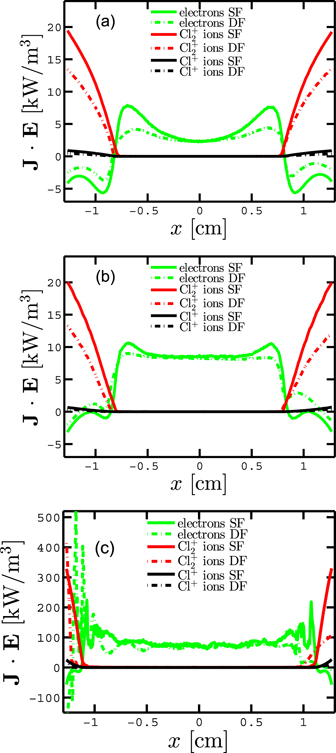
Figure 4. The time averaged electron and positive ion ( and Cl+ ions) power absorption across the discharge gap for varying pressures in both the SF discharge and the DF discharge with phase angle θ = 0° at (a) 1 Pa, (b) 10 Pa, and (c) 50 Pa. Note that the powered electrode is on the left-hand side and the grounded electrode is on the right-hand side.
Download figure:
Standard image High-resolution imageFigure 3 shows the spatio-temporal behavior of the electron power absorption for a parallel plate capacitively coupled chlorine discharge with electrode separation of 25.4 mm, the upper row shows discharges driven with a SF 222 V voltage source at 13.56 MHz and the lower row dual frequency discharges driven by a 111 V voltage source at 13.56 MHz and 111 V voltage source at 27.12 MHz and phase angle θ = 0°. For each of the figures the abscissa covers the whole gap length between the electrodes, from the powered electrode on the left-hand side to the grounded electrode on the right-hand side, while the ordinate covers a complete rf cycle. We note that in all cases there is a significant electron power absorption (red and yellow areas) and smaller power loss (dark blue areas) evident within the plasma bulk region as seen in figures 3(a)–(f). Electron power absorption is observed during the sheath contraction on the plasma bulk side of the sheath edge, while cooling (electrons lose energy) is observed on the electrode side (the lower left hand corner and upper center on the right-hand side). This indicates that the electron power absorption occurs predominantly through DA electron power absorption. A significant electron power absorption is also seen in the sheath region during sheath expansion while a significant power loss is seen during sheath contraction. These are the characteristics of the DA power absorption mode. Note that there are differences not only qualitative but also quantitative as pressure is varied. The electron power absorption within the electronegative core is much higher at 50 Pa than at the lower pressures as seen in figures 3(c) and (f) for SF and DF (phase angle θ = 0°) operation, respectively. Again there appears to be evidence of striation structures in the electron power absorption at 50 Pa shown in figures 3(c) and (f), for SF and DF operation, respectively, similar to those observed by Liu et al [55, 59] in a capacitively coupled CF4 discharge. The striations are related to spatial variations in the charged particle densities within the electronegative core and therefore periodic acceleration of ions by the rf electric field that develops. The consequent ion motion leads to local space charges that again cause a spatial modulation of the electric field. Note that in this highly electronegative discharge electrons are a minority species and the dominant mechanism of electron energy gain is due to ambipolar and drift electric fields within the electronegative core. We also note that the electron power absorption structure at operating pressure of 50 Pa is rather complex. This is in particular noticable for the DF case (figure 3(f)) where the electron power absorption appears to be highly asymmetric and highly complex next to the driven electrode. The electron power absorption within the plasma bulk is believed to be primarily due to ohmic or DA power absorption by the electrons within the electronegative core [19]. As the pressure is increased the contribution of DA electron power absorption within the plasma bulk increases and electron power absorption in the sheath region decreases. DA electron power absorption is known to appear in CF4 discharges at high operating pressure (∼80 Pa) [19–21] and at low operating pressure (∼2 Pa) in oxygen discharges [58, 60] as it coincides with high electronegativity and creation of electric field within the electronegative core. The time averaged electron power absorption across the discharge gap for varying pressures in both the SF discharge and the DF discharge is shown in figure 4. We see that at all pressures the time-averaged electron power absorption is almost entirely within the electronegative plasma bulk. This is due to the high electrical resistivity within the plasma bulk in electronegative discharges. This agrees with what we have reported earlier for a SF voltage driven capacitively coupled chlorine discharge [31] and agrees with the experimental findings of Franz and Klick [61] for operating pressures above 5 Pa. We also note that as the pressure is increased, electron power absorption, both within the electronegative core, and within the sheath regions,increase, which indicates that ohmic heating can be concentrated in both of these regions. However, the power dissipated in the sheath regions is small, as seen in figure 4. The electron power absorption within the plasma bulk increases with increasing discharge pressure and an increase of roughly one order of magnitude is observed as the operating pressure is increased from 1 to 50 Pa as seen by comparing figures 4(a) and (c) showing the time-averaged electron power absorption. Figures 4(a) and (b) show that the electron power absorption is more uniform in the case of a DF discharge, while for the SF discharge peaks appear near the sheath edge. Figure 4 also shows the power absorption by the positive ions  and Cl+. For the
  ions the power absorption is significantly higher than for the Cl+ ions. The power absorption by the positive ions
  decreases slightly when the pressure is increased from 1 to 10 Pa and then it increases again with increased pressure and is a factor 5.3 higher for SF operation and a factor 4 higher for DF operation at 50 Pa than at 1 Pa. The power absorption by the positive ions
  is higher for SF operation than for DF operation at 1 Pa but the opposite is true at 50 Pa. The electron power absorption increases with increased pressure and is a factor 51 higher for SF operation and a factor 54 higher for DF operation at 50 Pa than at 1 Pa. This is explored further in figure 5 which shows the fractional power absorption by electrons, and
  and Cl+ ions versus operating pressure. At 1 Pa the power absorption by
  ions is the largest, has roughly 69% contribution, and power absorption by electrons has roughly 29% contribution. When the pressure is increased to 10 Pa most of the power is absorbed by the electrons which has about 69% contribution, while power absorption by
  ions has about 31% contribution. The role of electron power absorption increases significantly with further increase in pressure and has reached 85% of the total power absorption at 50 Pa. Power absorption by the Cl+ ions is always very small, in fact negligible. Also note that the total power absorption is significantly higher at 50 Pa. In SF operation the contribution of power absorption by
  ions is slightly higher and the contribution of power absorption by the electrons is slightly smaller than for the dual frequency case (not shown). The phase angle between the fundamental and the second harmonic has negligible effect on the relative contribution of the different species to the power absorption (not shown) as would be expected.
Figures 6(a), (c) and (e) show the temporal variation of the electric field within the discharge center for both SF and DF discharge, while figures 6(b), (d) and (f) show the temporal variation of the discharge center electron power absorption for both dual- and single frequency discharge. There is a significant electric field strength within the electronegative core and the electric field strength increases with increased operating pressure. This high electric field accelerates the electrons to high average energies and thus causes ionization within the plasma bulk. We see that the electric field is high and not constant within the plasma bulk. Rather the electric field exhibits particular waveform that depends on if the discharge is driven by SF or DF waveform. For comparison figures 6(g) and (h) show the waveforms of the SF and DF driving voltages over one rf period and those same waveforms squared, respectively. In steady state, the electric field varies periodically with a frequency equal to the applied driving frequency, while the electron power absorption varies periodically with twice the applied frequency. For higher operating pressures a clear similarity can be seen between the driving voltage waveforms and the electric field observed within the discharge, as well as between the driving voltage waveforms squared and the temporal variation of the electron power absorption. At lower operating pressure there is more distortion in the waveform, probably due to larger phase difference between the electric field and the discharge current due to the higher contribution of the sheath regions to the overall discharge impedance. The discharge becomes more resistive as the operating pressure is increased and the contribution of the sheaths diminishes and the phase difference between the electric field and discharge current is smaller. This has been seen experimentally and in simulations as discussed below. Figures 6(a)–(f) show, especially for higher values of pressure, that the maxima of both the electric field and electron power absorption are significantly higher for the DF discharge than for the SF discharge. Although the same voltage amplitude, 222 V, is applied to both discharges the amplitude of both the electric field and the electron power absorption increase with increased operating pressure.

Figure 5. The fraction of power absorbed by electrons,  and Cl+ ions versus pressure for a dual frequency discharge with phase angle θ = 0°.
Download figure:
Standard image High-resolution image
Figure 6. The temporal variation of the electric field in the center of the discharge for SF chlorine discharge and a dual frequency discharge with phase angle θ = 0° for pressure of (a) 1 Pa, (c) 10 Pa, and (e) 50 Pa. The temporal variation of the electron power absorption in the center of the discharge for SF chlorine discharge and a dual frequency discharge with phase angle θ = 0° for pressure of (b) 1 Pa, (d) 10 Pa, and (f) 50 Pa. The electrode separation is 25.4 mm and the SF discharge is driven with a 222 V voltage source at driving frequency of 13.56 MHz and the dual frequency discharge with a 111 V voltage source at 13.56 MHz and 111 V at 27.12 MHz and phase angle θ = 0°. The (g) waveform of the driving voltage for SF and DF with phase angle θ = 0° and (h) the waveform of the driving voltage for SF and DF with phase angle θ = 0° squared.
Download figure:
Standard image High-resolution imageFigures 6(a), (c) and (e) show the presence of oscillation drift electric field within the electronegative core which implies a non-zero, time-dependent bulk voltage and indicates that there is a voltage drop across the plasma bulk. This has also been reported by Brandt et al [21] which find that the drift electric field within the plasma bulk increases substantially as the discharge electronegativity is increased by decreasing the argon fraction in CF4/Ar mixture and/or as pressure is increased, and a transition from α-mode to DA electron power absorption occurs.
Aydil and Economou [62] find the discharge current and the electric field to be nearly in phase at 66 Pa, while the electric field leads the discharge current (inductive load) by ∼42° at 200 Pa in a capacitively coupled chlorine discharge. Bose [63] measured the phase angle between rf voltage and current as a function of pressure for a 100 W capacitively coupled chlorine discharge with electrode spacing of 20 mm. The impedance and power meters were placed directly on the powered electrode. In the pressure regime 13–213 Pa the phase angle increased from −73° to 10° as the discharge changes from being capacitive when operating at low pressures to become resistive at high pressures. Furthermore, the sheath capacitance collapses almost entirely at the higher pressures. In the high pressure range, the resistive bulk plasma dominates the current–voltage relationship. Similar findings were reported by Franz [64]. This was also confirmed by our earlier PIC/MCC simulation of a voltage driven SF chlorine discharge [31]. Therefore, at high pressures the applied rf voltage is mainly dropped resistively across the bulk plasma. When the discharge current and electric field are in phase, the instantaneous power is always greater than zero and the plasma bulk behaves as an electrical resistor. This simplified circuit model has been applied in several studies on chlorine based discharges [65–67]. Based on this assumption Aydil and Economou [68] applied impedance analysis to determine some important plasma parameters, such as electron density, time-average sheath capacitance, sheath thickness, and sheath voltage as well as the bulk plasma resistance. Also, as the power absorbed in the sheaths is observed to be small the sheaths may be represented by ideal capacitors. Using this approach Lee et al [67] developed a global model for high pressure electronegative rf discharge where they assumed the rf power to be deposited in the electrons via ohmic power absorption and neglected sheath electron heating and ion power absorption due to acceleration across the sheath. They assumed that the power absorbed by the electrons balances the energy losses due to electron–neutral collisions such as elastic scattering, electronic excitation, ionization, dissociation, dissociative attachment, and electron detachment. Furthermore, they suggested ohmic power absorption to become more important as the operating pressure is increased, while for low pressure the rf power is mainly deposited into the ions accelerated across the sheath potential. This is indeed what we have confirmed in this current study.
The DA electron power absorption mode appears in electronegative discharges [19]. The electronegativity in the discharge center as a function of pressure for a parallel plate capacitively coupled chlorine discharge is shown in figure 7. We see that the electronegativity in the discharge center α0 = n−0/ne0, where n−0 is the center negative ion density and ne0 is the center electron density, is very high and increases with increased operating pressure from 87 at 10 Pa to 170 at 50 Pa for dual frequency operation. For SF operation the center electronegativity increases from 122 at 1 Pa to 144 at 35 Pa and then falls to 104 at 50 Pa. The average (or global) electronegativity

where n−(x) is the Cl− ion density profile, ne(x) is the electron density profile and d is the electrode separation, is also shown in figure 7. The electronegativity averaged between the electrodes is always somewhat lower than the center electronegativity. This is to be expected as there are less negative ions than electrons in the sheath regions, as seen from the charged particle density profiles, in figure 1, which brings down the average value between the electrodes. We also note that the electronegativity is somewhat higher for a SF driven discharge compared to a DF discharge, except at 50 Pa. Negative ion creation proceeds via electron impact attachment processes, whose cross-sections are high. Electron impact dissociative attachment is an important reaction for the creation of negative ions and for the DF case the center reaction rate increases from 2.6 × 10¹⁹ m−3 s−1 at 1 Pa, to 5.1 × 10²⁰ m−3 s−1 at 10 Pa, and to 7.3 × 10²¹ m−3 s−1 at 50 Pa, and dominate over polar dissociation, that has reaction rate in the range 1.3 × 10¹⁷ m−3 s−1 to 2.1 × 10¹⁸ m−3 s−1, and increases with increasing operating pressure. The charged species consist mostly of  and Cl− ions and the negative ions are mainly lost in the discharge through negative–positive ion recombination, within the electronegative core, rather than diffusion loss to the electrodes. Negative ion loss to the wall can be neglected as these ions are strongly confined by an ambipolar potential. The reaction
  + Cl− → 3Cl dominates the loss of negative ions and the center reaction rate increases from 5.3 × 10¹⁹ m−3 s−1 at 1 Pa to 1.4 × 10²⁰ m−3 s−1 at 10 Pa and to 5.5 × 10²¹ m−3 s−1 at 50 Pa and occurs only within the electronegative core while detachment by Cl2 has more than an order of magnitude lower reaction rate ∼1018 m−3 s−1 and detachment by Cl is in the range ∼1018–3 × 10¹⁹ m−3 s−1, and increases with increasing operating pressure. The reaction rates for electron impact dissociative attachment and negative–positive ion recombination determine the negative ion density and therefore the electronegativity. Electron impact dissociation and electron impact dissociative attachment, are the two possible channels for production of atomic Cl. Production of Cl atoms via the latter channel is roughly an order of magnitude smaller than the former.

Figure 7. The electronegativity in the discharge center α0 and averaged between the electrodes αave, as a function of pressure for a parallel plate capacitively coupled chlorine discharge for 25.4 mm gap distance operated as a SF discharge (red) and dual frequency discharge with phase angle θ = 0° (blue).
Download figure:
Standard image High-resolution imageIn an earlier work we explored the evolution of the electron energy probability function (EEPF) with pressure in voltage driven SF discharge [31] and with current density in DF discharges [34]. The EEPF and the EEDF are related through  where
where  is the EEPF,
  is the EEDF and
  is the electron energy. We demonstrated that in all cases the population of low energy electrons is relatively low and the EEPF curves outward. The DA power absorption is an ohmic process and therefore the EEPF is expected to be Druyvesteyn like. This is also observed for all the cases explored in this current study (not shown). With decreasing operating pressure the EEPF becomes more Maxwellian-like. The shape of the EEPF in the discharge center is roughly independent of the phase angle θ in the DF case.
Figure 8 shows the center electron power absorption amplitude and the dc self-bias as a function of operating pressure for the DF discharge with phase angle θ = 0°. Both the center electron power absorption amplitude and the dc self-bias increase roughly linearly with increased operating pressure. Linear increase in dc self-bias with increased discharge pressure was also reported by Bruneau et al [13] for a CF4 discharge driven by tailored waveform with one harmonic. It is known that the discharge pressure can have a strong impact on the discharge asymmetry obtained with tailored waveforms. Bruneau et al [69] demonstrated for an argon discharge that increasing the discharge pressure decreases the mean free path for energetic electrons, which leads to changes to the spatial profiles of excitation and ionization. Therefore, at the lowest pressures ionization occurs within the plasma bulk, and is symmetric. With increased operating pressure, the ionization becomes more and more localized at both sheath edges. The two ionization peaks become more asymmetric with increased pressure, the one closer to the powered electrode becomes larger than the one closer to the grounded electrode. This appears as increased asymmetry in the time-averaged ion flux profile with increased operating pressure which appears as dc self-bias. In addition, Schulze et al [19] demonstrated that increased role of DA power absorption can influence the discharge asymmetry.

Figure 8. The dc self-bias and the average center electron power absorption within the discharge bulk versus discharge pressure in a dual frequency discharge with phase angle θ = 0°.
Download figure:
Standard image High-resolution imageThe idea of the EAE is that the average ion energy can be controlled as it depends almost linearly on the phase angle, while the mean ion flux remains essentially constant. Due to the increase in the dc self-bias the time-averaged voltage drop across the sheath at the grounded electrode increases which leads to increased mean ion energy with increased phase angle. The IED for  ions bombarding the electrodes in a parallel plate capacitively coupled chlorine discharge is shown while varying the phase angle, between the fundamental and the second harmonic, in figure 9 for both the grounded (upper row) and the driven (lower row) electrode. The IED is determined largely by the collisionality of the sheaths. Ions are accelerated as they travel through the sheath. However, they suffer collisions, mainly with neutrals, on their path. Increasing the operating pressure leads to a decreased mean ion bombardment energy due to increasing number of collisions within the sheath. These collisions reduce the ion bombardment energy to values below the sheath voltage. At the highest operating pressures the mean ion bombardment energy is therefore expected to be only a fraction of the sheath voltage which implies that ions lose some of their energy to collisions with neutrals. The highest energy observed in the IED is roughly equal to the sheath voltage as the ions which possess the highest energy are those which passed the sheath without undergoing any collisions. At the lowest operating pressure considered here, 1 Pa (figures 9(a) and (d) for the grounded and driven electrodes, respectively), the sheaths are almost collisionless and the IEDs are characterized by a distinct peak at the highest ion energy as many of the ions that bombard the electrodes have high energy, which corresponds to the time averaged sheath potential. Therefore, a distinct peak is observed at high energies at 1 Pa. As the operating pressure is increased the sheath becomes increasingly more collisional, the high energy peak decreases and the fraction of low energy ions increases, and multiple smaller peaks, due to charge exchange collisions between ions and neutrals, within the sheath are observed at 10 Pa (figures 9(b) and (e) for the grounded and driven electrodes, respectively). At 50 Pa the IED on the grounded electrode (figure 9(c)) decays gradually from 0 eV to 150 eV and remains the same when the phase angle is varied. On the driven electrode (figure 9(f)) the IED exhibits a sharp peak at around 20 eV independent of the phase angle. Therefore, the mean ion energy can be controlled with the phase angle at low pressure (1 and 10 Pa) while at higher pressure (50 Pa) the ion energy cannot be controlled by the phase angle. The mean ion energy bombarding both the electrodes is shown versus the phase angle θ in figure 10(a). The mean ion bombarding energy on the grounded electrode increases while the ion bombardment energy on the driven electrode decreases with increased phase angle between the fundamental and the second harmonic. At 1 and 10 Pa the mean ion energy on the grounded electrode increases by a factor of roughly 1.2 as the phase angle is increased from 0° to 90°. This is significantly narrower control range than typically observed in electropositive discharges operated in the α-mode [9–11]. At 50 Pa the mean ion energy does not depend on the phase angle and the mean ion energy is roughly 20 eV on the driven electrode and roughly 60 eV on the grounded electrode as shown in figure 10(a). At 1 and 10 Pa the
  ion flux remains constant as the phase angle between the fundamental and the second harmonic is varied as shown in figure 10(b). At 50 Pa the flux on the driven electrode is higher than the flux on the grounded electrode, but decreases slightly, and the flux on the grounded electrode increases slightly, as the phase angle is increased.

Figure 9. The IED for  ions bombarding the grounded electrode at (a) 1 Pa, (b) 10 Pa, and (c) 50 Pa and bombarding the driven electrode for pressure of (d) 1 Pa, (e) 10 Pa, and (f) 50 Pa, of a parallel plate capacitively coupled chlorine discharge with electrode separation of 25.4 mm driven with a 111 V voltage source at 13.56 MHz and 111 V at 27.12 MHz for varying values of the phase angle θ.
Download figure:
Standard image High-resolution image
Figure 10. (a) The mean  ion energy and (b) the average
  ion flux on the grounded (left) and the driven (right) electrode of a parallel plate capacitively coupled chlorine discharge with electrode separation of 25.4 mm driven with a 111 V voltage source at 13.56 MHz and 111 V at 27.12 MHz as a function of the phase angle θ for pressure of 1 Pa, 10 Pa, and 50 Pa.
Download figure:
Standard image High-resolution image
4. Conclusion
PIC/MCC simulations were applied to explore a capacitively coupled chlorine discharge driven by a tailored voltage waveform, composed of a fundamental frequency of 13.56 MHz and second harmonic of 27.12 MHz, operated in the pressure range 1–50 Pa. The creation of a dc self-bias and asymmetric response was observed and applied to control the ion flux and ion energy. The electron power absorption occurs mainly through DA electron power absorption within the electronegative core. At higher pressures the electron power absorption dominates the ion power absorption. The chlorine discharge exhibits high electronegativity and high electric field exists within the electronegative core. This electric field exhibits the waveform of the discharge driving voltage for both SF and DF operation. We have demonstrated that the mean ion bombarding energy can be tuned nearly independently of the ion flux at 1 and 10 Pa through the EAE. However, the available control range for the mean ion bombarding energy on the grounded electrode is rather limited and the range is significantly smaller than typically observed for electropositive discharge operated in the α-electron power absorption mode. At the highest pressure explored 50 Pa the EAE is not suitable to control the ion energy.
Acknowledgments
Discussions with Prof. M A Lieberman are gratefully acknowledged. This work was partially supported by the Icelandic Research Fund Grant No 163086 and the University of Iceland Research Fund.