
Abstract
Sustainable and low-emission combustion is in need of novel schemes to enhance combustion efficiency and control to meet up with new emission standards and comply with varying quality of renewable fuels. Plasma actuation is a promising candidate to achieve this goal but few detailed experiments have been carried out that target how specific combustion and plasma related species are affected by the coupling of plasma and combustion chemistry. Atomic hydrogen is such a species that here is imaged by using the two-photon absorption laser induced fluorescence (TALIF) technique as an atmospheric pressure methane–air flame is actuated by nanosecond repetitively pulsed (NRP) discharges. Atomic hydrogen is observed both in the flame and in the discharge channel and plasma actuation results in a wide modification of the flame shape. A local 50% increase of fluorescence occurs at the flame front where it is crossed by the discharge. Atomic hydrogen in the discharge channel in the fresh-gases is found to decay with a time constant of about 2.4 μs. These results provide new insights on the plasma flame interaction at atmospheric pressure that can be further used for cross-validation of numerical calculations.
Export citation and abstract BibTeX RIS

Original content from this work may be used under the terms of the Creative Commons Attribution 4.0 licence. Any further distribution of this work must maintain attribution to the author(s) and the title of the work, journal citation and DOI.
1. Introduction
In the last decades, non-equilibrium plasma produced by nanosecond repetitively pulsed (NRP) discharges has shown promising ability for combustion enhancement [1, 2]. For example, significant reduction of the ignition delay time [3–5] and the lean-flammability limit [6, 7], as well as the control of flame dynamics [8], can be achieved with the aid of NRP discharges. Their efficiency is attributed to a coupled thermal and chemical activation of the reacting flows [2].
For combustion applications, atomic hydrogen (H) and oxygen (O) are two of the main active species produced in NRP discharges [2, 9]. They can be produced by direct electron impact reactions (CH4 + e → CH3 + H + e and O2 + e → O + O + e), or by quenching of excited nitrogen [10–12]. The presence of significant amounts of atomic O and H accelerates the chain branching reactions and leads to ignition, or to an increase of the flame speed, facilitating and enhancing combustion. This mainly applies to discharges developing in the fresh gases, but discharges can also be applied through the flame front [13]. In a developed flame, atomic H is then involved in two of the most important high-temperature reactions in combustion (H + O2 → OH + O and CO + OH → CO2 + H) [14]. Therefore, measurements of spatial distribution and temporal evolution of key intermediate species such as atomic H and O are vital to the understanding of the physicochemical mechanisms of the NRP discharge action on the flame, and provide data for validating numerical models.
The two-photon absorption laser induced fluorescence (TALIF) technique for atomic species concentration measurements was developed in the '80s [15] and over time several multiphoton excitation schemes have been explored for atomic H [16, 17]. The most commonly used is from the ground state, i.e. n = 1, to the n = 3 state via two-photon excitation, and subsequent deexcitation to n = 2 state, resulting in a photon emitted at 656.3 nm, i.e. the Balmer-α line. This detection scheme is also employed in the current work. Compared to using nanosecond laser, pico- and femtosecond lasers have shown apparent superiority for TALIF due to their high peak power and modest pulse energy, which allow efficient multi-photon excitation with minimal photolytic interference [18, 19]. In addition, for atmospheric-pressure quantitative measurements, ps or fs pulse duration is needed to measure the fast atomic H fluorescence decay that, in a flame environment, can be as short as 60 ps [20], and therefore have access to the quenching rate. One may think that the large bandwidth of fs pulses would be detrimental for the excitation efficiency, which is the case for single-photon excitation, but for two-photon excitation, efficient excitation is still obtained since a large number of photon-pairs match the two-photon resonance. [21]. Most flame investigations with TALIF have been carried out at low pressures, which is favorable when applying this technique because of thicker reactions zones and lower quenching effect [22]. However, experiments in the current study are conducted at atmospheric pressure.
This technique has been applied to fields where atomic hydrogen is relevant, such as combustion and plasma diagnostics. It has been proved to perform well for measurements and imaging of atomic hydrogen in thermal [23] and non-thermal plasmas, such as in RF discharges [24, 25] and low pressure nanosecond discharges for different gas mixtures [26, 27]. Atomic hydrogen has been studied in several subatmospheric [22] and atmospheric flames, mostly involving H2 and CH4. Significant effort was spent on evaluating photolytic interference effects [18, 28] and quantitative measurements [20, 29, 30], which in most cases were limited to point measurements. A recent work [21] studied the H production in a nanosecond discharge occurring in the burnt post flame gases of a Hencken flame. However, the authors have not found any experimental investigations of H atoms in a flame assisted by NRP discharges.
The objective of this paper is to demonstrate fs-TALIF imaging of hydrogen in a laminar methane–air plasma-assisted flame. The results we present consist of time-resolved 2D images of atomic H fluorescence, used to assess the plasma effect on the atomic H local densities. Here, a comprehensive strategy to achieve a reliable fluorescence imaging, from the measurement procedures to the data post-processing, will be demonstrated in detail. We observed that the occurrence of the discharge-induced plasma will significantly modify the spatial distribution of H-atom fluorescence in the flame and enhance its yield as well. Also, we investigated its temporal dynamics during a discharge cycle, which suggests that the steady-state plasma-assisted-flame system does not sensitively respond to single discharge pulse forcing at these experimental conditions.
This paper is organized as follows: in section 2, we describe our experimental apparatuses, including the burner designed for plasma-assisted experiments, the femtosecond laser system, and the TALIF detection setup. Since TALIF raw images need to be corrected, we dedicate section 3 to the experimental procedure and the processing methodology of the raw image. In section 4, we present and discuss the results. Finally, we conclude in section 6 with a brief summary.
2. Experimental setup
The experimental setup is shown in figure 1. It comprises a plasma-assisted combustion (PAC) burner, a fs laser system and a detection system, which are described in detail in the following subsections.

Figure 1. Schematic illustration of the experimental setup (top view).
Download figure:
Standard image High-resolution image2.1. Plasma assisted combustion burner
The PAC burner consists of a laminar stagnation plate burner fed with a lean methane–air pre-mixture and a nitrogen co-flow, shown schematically in figure 2. The average bulk velocity of the flammable mixture is 1.2 m s−1 and the equivalence ratio is set to 0.76. For these conditions, the thermal power of the flame is about 220 W. The flame stabilizes roughly in the middle of a 10 mm gap between the nozzle and a quartz stagnation plate. Operating conditions are carefully chosen in order to have a stable flame, which is required for phase-locked imaging of the discharges.
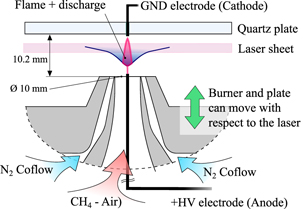
Figure 2. Schematic illustration of the plasma-assisted combustion (PAC) burner used in this study.
Download figure:
Standard image High-resolution imageThe burner is made out of non-conductive material (polyether ether ketone), allowing an easier integration with high voltage components. Additional details of the burner can be found in [31]. Two pin electrodes are used: one placed in the quartz plate and the other located inside the nozzle along the symmetry axis of the flame. The cathode is made out of a 1 mm diameter pure tungsten welding electrode and features a conical tip. The anode instead consists of a thin electrochemically etched tungsten wire. Even though this wire is only 0.1 mm in diameter, it still affects the velocity profile of the flow at the outlet, preventing the flame surface from being flat (see figure 3(a)). This electrode arrangement allows the discharge to cross the flame perpendicularly and to develop in both cold and hot gases. A high voltage nanosecond discharge generator (FPG Series, FID GmbH) is connected to the electrodes for the creation of the discharge. A BNC 575 delay generator (not shown in figure 1) is employed to generate the desired pulse repetition frequency and to synchronize the discharges with the laser system and camera. Tuning the delay between the discharge pulse and the camera acquisition allows to perform TALIF imaging at an arbitrary time after the discharge event. We observed an overall jitter of about ±13 ns that limited our ability to investigate the hydrogen fluorescence very close to the onset of the discharge.
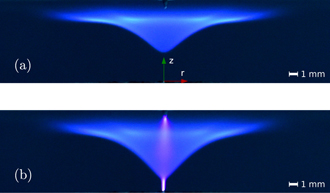
Figure 3. Photos of the experimental volume captured with a DSLR camera with exposure time of 1/80 s. (a) Shows the base flame without discharge and (b) the flame under plasma actuation (8 kV, 10 kHz).
Download figure:
Standard image High-resolution imageNRP discharges can appear and behave quite differently in different experimental condition where parameters such as voltage, pulse repetition frequency, voltage rise-time, electrodes geometry, gap spacing, gas composition in the gap, pressure, etc are known to affect the discharge [32]. Discharges in the glow regime [33, 34] are considered in the experiments discussed in this paper. This particular non-thermal discharge regime allows low power deposition, high chemical reactivity, and low gas temperature, making it interesting for applications [33].
A high voltage probe (Tektronix P6015A) is used to measure the voltage applied to the electrodes and a Pearson current monitor 6585 for measuring the current. Typical results are shown in figure 4. The purpose of these electrical measurements is to provide estimations of the plasma power. The instantaneous discharge power can be computed by multiplying voltage and current traces, and the energy is obtained by integrating the power over the duration of a discharge event. In the voltage trace shown in figure 4, one can recognize the 10 ns long high voltage pulse, and observe some ringing and a significant overshoot. Interestingly, the energy transfer seems to occur during the first 140 ns after the high voltage pulse before settling to its final value.
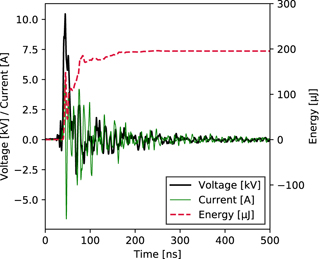
Figure 4. Typical voltage and current traces during a discharge event. Estimated deposited energy is also shown.
Download figure:
Standard image High-resolution imageIn this study, the chosen applied voltage is 8.4 kV and the pulse repetition frequency is set to 10 kHz. Under these conditions, typical values of plasma power are 1–2 W, corresponding to less than 1% of the thermal power of the flame.
The PAC burner is mounted on top of a translation stage, which moves vertically (perpendicularly to the page plane in figure 1) and it is synchronized with the camera, allowing fast multi-frame acquisitions of the same object at different heights for an automatic flame scanning. Alternatively, the PAC burner can be replaced by a McKenna burner with a central nozzle capable of generating a narrow cone flame, suitable for calibration measurements.
2.2. Femtosecond laser system
A Ti:sapphire chirped pulse amplification (CPA) femtosecond laser system (coherent, Hidra-50) delivers 800 nm laser pulses with a duration of 125 fs, at 10 Hz repetition rate. The laser beam then pumps a travelling wave optical parametric amplifier (Light Conversion, HE-TOPAS-PRIME) followed by a frequency mixing apparatus (NirUVis unit), which is finally capable of providing the required 205 nm laser pulses with pulse energy ∼35 μJ/pulse for exciting atomic hydrogen, from n = 1 to n = 3, while detection occurs at 656 nm [15]. The 205 nm laser beam, roughly 5 mm in diameter, is then focused with a cylindrical lens to form a vertical laser sheet, with the same height of 5 mm and an estimated thickness of about 200 μm, right across the flame in the PAC burner.
2.3. Detection system
An intensified charge-coupled device (ICCD) camera (Princeton instruments, PI-MAX4 1024f), fitted with a Nikon Nikkor 135 mm f/2.8 lens is used to capture the 656 nm H-atom fluorescence. The camera is synchronized with the laser and is setup in a 90°-side configuration perpendicular to the laser beam propagation direction. Typical camera acquisition settings are 3 ns gate width and 150 on-chip accumulations. Suppression of the background radiation is achieved with a narrowband band-pass interference filter with a center wavelength at 655 nm (Semrock, FF01-655/15-25).
Simultaneously with fluorescence measurements, an energy meter (Gentec, SOLO 2) placed right after the burner, is used to continuously log the laser pulse energy. A spectrometer (Princeton instruments, Acton SP2500, spectral resolution ∼0.018 nm) is used to facilitate spectral analysis of the emission signals.
Figure 5(a) shows the measured fluorescence spectrum. The spectral peak is centered at 656 nm and the peak intensity is sensitive to the detuning of the excitation wavelength, confirming that the fluorescence signal comes from H atoms. Figure 5(b) shows the excitation spectrum, from which we can see that the optimal excitation wavelength for detecting H atoms is about 204.67 nm. The rather broad excitation peak is a result of the large linewidth, about 0.5 nm, of the fs excitation laser.

Figure 5. (a) fs-TALIF spectrum obtained with a fully open slit (3 mm) of the spectrometer, and (b) average fluorescence signal from the central flame region as a function of the excitation wavelength, obtained with the ICCD camera. These measurements were performed on the flame with no discharge.
Download figure:
Standard image High-resolution image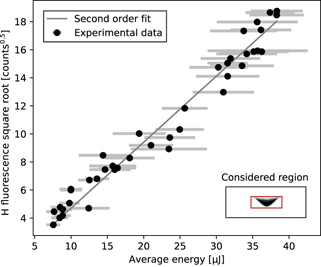
Figure 6. Pump pulse energy dependence of H fluorescence. The grey line represents a curve with power index of 2. The inset shows the region of the flame considered in the analysis.
Download figure:
Standard image High-resolution image2.4. Considerations of possible interferences
In ideal conditions the TALIF process would result in a squared dependence of the fluorescence yield on the pump laser energy. However, the laser pulse could photolytically generate additional H [35] that is then detected, leading to a higher than quadratic energy dependence. Two main precursors, H2O [28] and CH3 [36, 37], are both abundant in the flame. At the same time, stimulated emission could lead to a dependence index lower than quadratic [38, 39]. This latter possibility can be ruled out since we did not observe any signature of stimulated emission of H atoms in the forward or backward direction. Additionally, interference from O2 photolysis, leading to O-atom production, that can deplete the H-atom population is also ruled out, given that the laser fluence used in this experiment (6 mJ cm−2) is more than 60 times lower than reported fluence thresholds for similar conditions [35].
In order to estimate the possible impact of photolytic interference, we measured the laser pulse energy dependence of the H fluorescence signal, as shown in figure 6. For this characterization, the PAC burner is operated without applying any discharge. Each experimental data point accumulates the fluorescence signal over 100 laser shots, while the error bar shows the laser pulse energy standard deviation over the same laser shots. A second order power function is also shown together with experimental data in figure 6, showing a good agreement. It suggests that in the range of the pump pulse energies we employed in the experiments, photolytic interference is not a significant issue.
A more robust way to evaluate effect of photolytic interference would be to analyze the spatial shape of the fluorescence signal for different laser pulse energies [35, 40], since even in case of severe photolytic interference sometimes the power-law may still not significantly differ from 2 [35]. This more advanced validation procedure will be performed in further investigations dedicated to quantitative measurements of atomic species densities.
3. Methodology
In this section, we describe the procedure of 2D H-TALIF image acquisition and post-processing in detail. A flow chart of the procedure is shown in figure 7. The main steps can be summarized as follows:
- Laser beam profile characterization by moving a Bunsen flame along the beam direction in order to scan the full area of interest;
- Collection of several images by moving the PAC flame vertically in order to scan the full area of interest;
- Image processing: corrections accounting for beam profile, energy fluctuations and occlusion and finally image stacking.
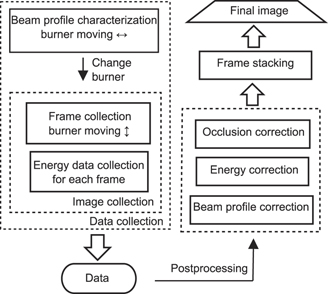
Figure 7. Procedures used for data collection and post-processing.
Download figure:
Standard image High-resolution imageDetails of each step are described in the following subsections.
3.1. Laser beam profile characterization
In a real laser sheet, the laser intensity is not uniform. It has a 2D distribution, depending on the actual beam profile and how the beam is focused into a sheet. Since the fluorescence response depends on the laser intensity squared, spatial non-uniformity of laser intensity has a direct and significant influence on the fluorescence distribution, and must be accounted for.
The laser intensity profile can be characterized by measuring the TALIF signal from a known spatial distribution of atomic H. Unfortunately, it is not possible to fill a volume with a uniform concentration of atomic H, and other techniques must be used. For example, in [41] a homogeneous concentration of krypton was employed, since krypton features similar excitation and detection scheme. The resulting TALIF map was used to normalize the measurements, correcting for the non-uniform laser intensity distribution.
In the present study, a different approach is used to obtain the correcting map. The atomic H naturally present in a ∼25 mm tall CH4–air conical flame is used to probe the laser sheet at different locations. This flame has been chosen because the H radial profiles at slightly different heights are very similar (this assumption is acceptable if the height of the laser sheet is small compared to the height of the cone flame [18]). The laser beam crosses the flame around its middle part, generating a TALIF signal as shown in figure 8(a). Around 130 TALIF images are collected while moving the flame along the laser beam. By properly averaging all those images, an intensity map can be obtained, as in figure 8(b), that approximates the TALIF response to an uniform atomic H field. Figure 8(b) confirms that the laser intensity in the sheet is far from uniform.
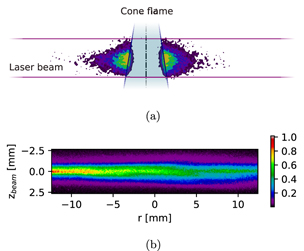
Figure 8. Details on the procedure for characterizing the laser sheet. (a) Example of the H fluorescence signal form the conicalpremixed ame used to characterize the laser beam prole. (b) Result of the laser beam prole characterization. Inthis specic case the focusing region was slightly on the leftof the region of interest.
Download figure:
Standard image High-resolution imageIn the following, this correction map will be referred as laser beam profile. The characterization just described is conducted twice, before and after any set of measurements, and the average map is used for correction. It is worth noting that the laser beam profile obtained with this method is also affected by the non-uniform pixel responsivity and intensifier gain. These effects are corrected as well when a TALIF raw image is divided by the correction map.
3.2. H-TALIF image acquisition and collection
Several measurements are performed at different heights (z) by moving the burner vertically in order to cover the full region of interest. In these measurements, 7 different positions are considered with a ∼0.9 mm displacement between two adjacent positions. Recall that typical camera acquisition settings for each frame at a certain position are 3 ns gate width and 150 on-chip accumulations. Given that the laser repetition frequency is 10 Hz, the time required for a complete measurement is roughly 2 min. Examples of these frames at different z can be seen in figure 9(a).
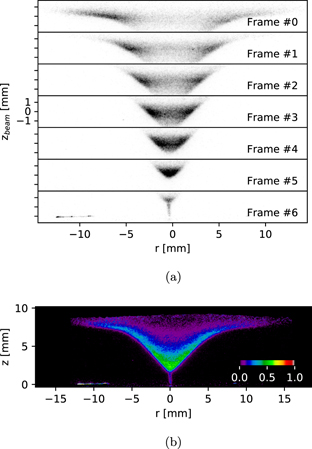
Figure 9. Illustration of post-processing. (a) Raw individual frames to be stacked. (b) Composed image, after all corrections and framestacking.
Download figure:
Standard image High-resolution imageIn this paper we present TALIF images that are collected at different times after the discharge event. We define t = 0 as the time when we observe the maximum emission from the discharge. At around 656 nm there is a broadband plasma emission [3] whose intensity, integrated over a 3 ns gate width, appears to be a couple of order of magnitude larger than the H fluorescence signal. This fact, together with the ∼±13 ns jitter discussed in section 2.1, prevents acquisition of meaningful data close to t = 0. The strong plasma emission quickly decays via fast collisional quenching, which takes ∼30 ns [42]. After about 50 ns the background plasma emission becomes negligible and reliable data of the H fluorescence can be acquired. Measurements are repeated twice to evaluate repeatability.
3.3. H-TALIF image corrections
Several corrections are applied to the raw TALIF images (see figure 9(a)), as discussed in the following:
- Background correction: the background images are captured with the laser excitation wavelength tuned 3 nm off-resonance, and subtracted from the TALIF images.
- Beam non-uniformity and camera correction: each raw image is corrected by using the laser beam profile obtained as described in section 3.1. Thanks to that, corrections for non-uniformity in the laser intensity distribution, in pixel responsivity and intensifier gain can be accomplished.
- Collection efficiency correction: the flame stabilizes few mm away from a large quartz plate. For this reason, part of the fluorescence emitted close to the plate will not be able to reach the camera, and because of the occlusion by the plate a lower signal intensity will be recorded. The collection efficiency is calculated on geometrical grounds. The occlusion scheme will be different for each burner position, so each raw image frame in figure 9(a) has to be multiplied by its own corresponding collection efficiency.
- Energy correction: each image is re-scaled using the average squared pulse energy during the collection of each image itself, to correct for any laser energy fluctuation. We noticed that this procedure generally leads to a slight over-correction, however it still helps reducing data spread between repeated measurements.
3.4. Frame stacking and final H-TALIF image
After corrections, individual frames are merged by means of a weighted average, using the laser intensity profile described in section 3.1 as weight. A similar approach for images stacking can be found in [21] (page 72). Finally, the processed TALIF image, after all corrections and stacking of all frames (figure 9(a)), is achieved as shown in figure 9(b).
4. Results
Figure 10(a) shows an H-TALIF image of the flame when no discharge is applied (base flame). Fluorescence signal can be seen in the flame front and in the post-flame region. The flame tip is slightly brighter than any other region in the flame. Figures 10(b)–(d) show H-TALIF images of the plasma-assisted flame for 3 different time delays in the discharge cycle, respectively: 150 ns, 4 μs and 40 μs. Compared to the case of base flame, it is obvious that glow discharges impact the spatial distribution of atomic hydrogen and the following features can be noticed: (1) the distribution of H is stretched in the vertical direction as a result of change in flame shape, corresponding to figure 3(b). (2) The H fluorescence intensity increases, particularly in the tip region of the flame. (3) H fluorescence can be detected in the discharge channel between the flame tip and the bottom electrode, as can be seen in figure 10(b). It decays within few μs, and it can barely be seen after 4 μs in figure 10(c). (4) Flame shape and tip position barely change during the forcing cycle. (5) Limited fluorescence response to plasma actuation is observed on the post-flame side of the discharge channel.
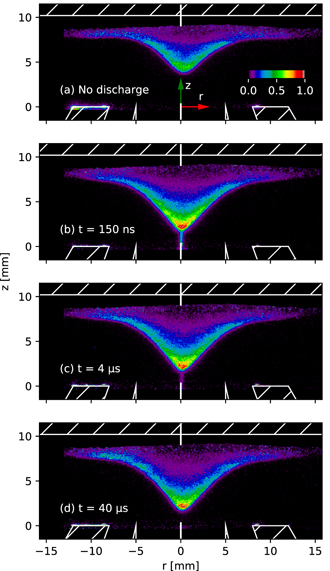
Figure 10. TALIF imaging of atomic hydrogen at different time delays after a discharge event. Each image is obtained by stacking 7 frames, 150 accumulations each. Discharge parameters are: 8.4 kV, 10 kHz.
Download figure:
Standard image High-resolution imageTo compare TALIF images taken at different delays after the discharge, figure 11 shows the profile of H fluorescence distribution along the flame center-line (∼0.2 mm thickness). The black trace corresponds to the case without discharge while the colored traces show the fluorescence distribution profiles at different time delays after the discharge. Previous observations from figure 10 are valid for figure 11 as well.
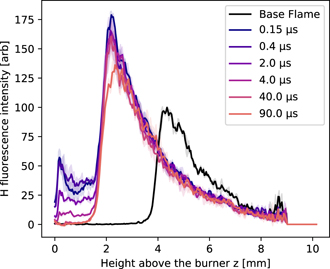
Figure 11. Fluorescence along the flame center-line for selected delays after discharge. Solid lines represent the average value of two repeated measurements, while lightly colored areas represent the spread between them.
Download figure:
Standard image High-resolution imageOn the fresh-gases side of the discharge channel (0 ⩽ z ⩽ 1.8 mm in figure 11) the H fluorescence gradually decreases with increasing time delay after the discharge. Figure 12 shows the averaged H fluorescence signal in the mentioned area as a function of time. Data points can be fitted by an exponential decay function, suggesting a time constant of about 2.5 μs.
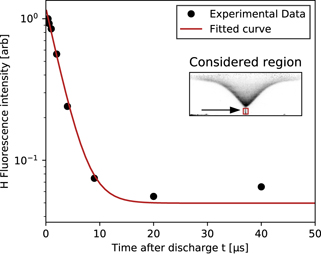
Figure 12. Atomic H fluorescence in the fresh-gases side of the discharge channel for different delays. The fitted exponential decay has a characteristic time of 2.5 μs.
Download figure:
Standard image High-resolution imageFigure 13 shows the averaged fluorescence over the regions depicted in the inset picture (flame tip), as a function of the time delay in a discharge cycle. Results obtained in the base flame (no discharge) are also shown for comparison. A 40% increase of average fluorescence signal can be obtained with discharge compared to base flame. A similar observation could be done by analyzing figure 11 and checking the values at the flame tip location. Actual numbers in figures 11 and 13 may be slightly different due to different locations/sizes of the boxes within which averages are computed. The intensity plot in figure 13 suggest a slightly declining trend during the 100 μs inter-discharge period.

Figure 13. H fluorescence in the flame tip versus time after discharge. Error-bars represent the spread between two repeated measurements while round markers represent their average value. Values are normalized with respect to the case without discharge, that is shown on the right side of the plot (time axis has no meaning for the base flame).
Download figure:
Standard image High-resolution image
The flame appears not to respond to occurrence of individual discharge channels, not in terms of the flame front location-corresponding to the steepest gradient region in figure 11 and also not in terms of H fluorescence during the 100 μs forcing period (figure 13).
5. Discussion
5.1. From TALIF to concentration
Once non-uniformity effects in the laser beam are taken into account and provided that photolytic effects are negligible, collisional quenching of excited atoms is the main source for the difference between the fluorescence map and the H concentration map. The quenching rate affects the fluorescence yield [22], and it depends on the nature and the number density of the collisional partners. According to [19] the quenching rate can be up to 7 times larger in the cold gases compared to the hot flame front region, therefore different locations having the same TALIF signal level might have quite different H number density. Following [43], the H-TALIF signal can be roughly expressed as STALIF ∝ N0/(Q2 + A2) where N0 is the concentration of H atoms in the ground state, Q2 the quenching rate and A2 the Einstein coefficient for spontaneous emission. The quenching rate, in principle, could be calculated from the position-dependent temperature and flame composition and the species and temperature dependent quenching cross sections [18]. Besides the difficulties of mapping the 2D temperature and composition, a comprehensive set of the quenching cross sections of atomic hydrogen is also not available for the current experimental conditions. Most of the available quenching rate constants [29] are provided at room temperature and it is not clear how to extrapolate them to high temperature [18, 21]. Therefore, quantitative analysis of H-TALIF signal is challenging and direct point measurements of quenching rates are preferred for quantitative TALIF [21]. Two-dimensional quantitative measurements is in principle also possible for TALIF of H by using fluorescence lifetime imaging [44].
Nevertheless, if local conditions (such as composition and temperature) are not very different, then the fluorescence intensity can be used to infer trends of actual atomic H concentration. This allows us to estimate the relative change in H concentration in specific points. As an example, at the flame tip, we can assume that collisional quenching does not vary dramatically when we apply discharges. This is supported by the fact that NRP glow discharges do not change the flame temperature much (see for example [45]), neither the concentration of major species (see for example [42]). Then the relative change in the TALIF signal can be assumed to represent the change in H number density.
For a methane–air flame of 0.76-equivalence ratio at ambient conditions, 1D simulations of a wall stabilized flame (using Cantera and GRI-Mech 3.0) predict a peak H number density at the flame front, close to 8 × 1015 cm−3, in the case without plasma. Based on the results presented in figure 11, a rough estimation of the H density in the discharge channel can be carried out. Using the same procedure as described in [19], taking the quenching constants and H natural fluorescence lifetime from [21, 29] and the estimated species concentrations form the 1D simulation, we found the fluorescence yield A2/(A2 + Q2) to be about 5.6 times lower in the cold gases than in the flame front. At about 150 ns after the discharge, the average fluorescence signal in the part of the discharge occurring in the fresh gases (dark blue curve, z = 1 mm) is about 40% of the peak intensity in the flame front (black curve, z = 4 mm). From those numbers, we obtain that the NRP discharges produce about 1.8 × 1016 cm−3 of atomic H, upstream of the flame front. This local production of atomic H, comparable with the atomic H density naturally present in the flame, could explain the strong effect of the NRP discharges on the stabilization height of the flame. Assuming that the electron impact reaction (CH4 + e → CH3 + H + e) is the main source of atomic H production, this atomic H density would correspond to about 1% of dissociation of CH4. Quantitative measurements are necessary to validate this simplified analysis.
5.2. Discussion of the results
A recent study on a CH4–air Bunsen flame [18] showed that the peak of fluorescence emission was located at the flame tip. That fluorescence peak was attributed to the diffusional focusing of H radicals. In our case, even without plasma actuation, we observe a significant fluorescence response in the flame tip region (figure 10(a)). Flame curvature and fast H diffusion in the hot gases could play a role there. A local increase of atomic H fluorescence at the flame tip could also be induced by a higher local flame temperature, increasing the local fluorescence signal. Higher temperatures can lead to (i) a higher atomic H production, (ii) a decrease in the overall gas density and (iii) a change in the quenching rates. By changing the unburned temperature in the 1D simulation described in the previous section, and estimating the fluorescence response as ![$\propto \left[\mathrm{H}\right] {A}_{2}{\left({A}_{2}+{Q}_{2}\right)}^{-1}$](https://content.cld.iop.org/journals/0963-0252/29/6/065011/revision2/psstab9234ieqn1.gif) , we verified that the overall effect of a temperature increase would be an increase in both the atomic H fluorescence and number density.
, we verified that the overall effect of a temperature increase would be an increase in both the atomic H fluorescence and number density.
Plasma forcing causes an increase in the atomic H fluorescence and thus an increase of concentration as well, if assuming similar quenching environment. This can be observed in the 2D fluorescence images in figure 10 as well as in figures 11 and 13. In the flame tip region, crossed by the discharge, a local increase of the H concentration up to 50% is observed. This production of atomic H is usually referred to during analysis of the chemical impact of nonequilibrium discharges on combustion [2, 9]. However, only a few studies presented some observations of atomic H production by nanosecond discharges in combustion environment (see for example [21]), and only for point measurements. In the present study, the 2D imaging of atomic H fluorescence allows a discussion on the local effect of NRP glow discharges in the fresh gases, in the flame front and in the burnt gases.
Atomic H fluorescence can be detected in the discharge channel developing in the fresh gases between the flame tip and the bottom electrode, but not on the burnt-gases side of the discharge. There might be several reasons for this. The first fact to consider is that the discharge channel in the burnt gases appears wider (see figure 3(b)) compared to the one developing in the fresh gases, because of the lower density in the hot gases and possibly because of the fact that the discharge does not occur always exactly in same location. In this situation any production of atomic H as the result of the electron impact reaction would be spread in a wider volume, making the detection of any extra H more difficult. Another factor may be the difference in the H precursors on the two sides of the discharges. On the fresh-gases side H stems from CH4, while in the burnt gases its originates from H2O. In [21], H concentration is reported to increase by about one order of magnitude after ns-discharges applied in the burnt gases. In that case, the discharge was probably in the spark regime, causing a significant increase in temperature and about 90% of the increase in H was attributed to thermochemistry, while the reminder 10% to plasma-enhanced kinetics.
The lifetime of H in the fresh-gases discharge region appears to be around 2.5 μs. This was estimated directly by the decline of the fluorescence signal in the discharge channel in figure 12. We estimate that in 100 μs H molecular diffusion could account for the displacement of a mere 40% of the H atoms from the laser sheet. Since the observed decay time is on the order of few μs the molecular diffusion process can be regarded as not dominant and therefore neglected in this analysis. Effects related to thermal expansions have been neglected as well.
Most of the H generated in the fresh gases is not reaching the flame because it is consumed earlier, within few μs. Atomic hydrogen in post-discharge chemistry, besides recombining, may as well be consumed in the production of radicals such as HO2 and OH [46, 47]. This will need to be further studied.
6. Conclusions
In this work 2D fs-TALIF imaging of atomic hydrogen in a lean methane–air flame crossed by NRP glow discharges has been demonstrated. A local increase of the H fluorescence up to about 50% has been observed due to the plasma forcing, which is particularly pronounced at the flame tip. Variation of H concentration in the flame during a discharge forcing cycle of 100 μs has shown to be minimal, which suggests that the flame does not respond to individual discharge events. Also, H atoms produced in the discharge channel could be detected in the unburned region, and their decay time has been estimated to be in the order of 2.5 μs. Estimated peak H number densities in the flame front without plasma are about 8 × 1015 cm−3 while on the fresh gas side of the discharge channel, about 1.8 × 1016 cm−3. However, further investigation will be necessary to obtain a quantitative measurement of the atomic hydrogen density and its evolution in the plasma-assisted flame.
Acknowledgments
This research work was sponsored by the King Abdullah University of Science and Technology (KAUST), the Knut and Alice Wallenberg Foundation, the European Research Council (ERC), the Swedish Research Council (VR) and the Swedish Energy Agency through the Centre for Combustion Science and Technology (CECOST).