

Abstract
This is the second of two papers presenting the study of vibrational energy exchanges in non-equilibrium CO2 plasmas in low-excitation conditions. The companion paper addresses a theoretical and experimental investigation of the time relaxation of ∼70 individual vibrational levels of ground-state CO molecules during the afterglow of a pulsed DC glow discharge, operating at pressures of a few Torr and discharge currents around 50 mA, where the rate coefficients for vibration–translation (V–T) and vibration–vibration (V–V) energy transfers among these levels are validated (Silva et al 2018 Plasma Sources Sci. Technol. 27 015019). Herein, the investigation is focused on the active discharge, by extending the model with the inclusion of electron impact processes for vibrational excitation and de-excitation (e-V). The time-dependent calculated densities of the different vibrational levels are compared with experimental data obtained from time-resolved in situ Fourier transform infrared spectroscopy. It is shown that the vibrational temperature of the asymmetric stretching mode is always larger than the vibrational temperatures of the bending and symmetric stretching modes along the discharge pulse—the latter two remaining very nearly the same and close to the gas temperature. The general good agreement between the model predictions and the experimental results validates the e-V rate coefficients used and provides assurance that the proposed kinetic scheme provides a solid basis to understand the vibrational energy exchanges occurring in CO2 plasmas.
Export citation and abstract BibTeX RIS
1. Introduction and motivation
The modelling of CO2 plasmas under non-equilibrium conditions has been the subject of considerable interest over the past few decades, drawing significant attention over more recent years. The first studies were associated with the discovery of the CO2 laser [1, 2], while more recent works are mainly motivated by environmental issues [3, 4], aerospace applications [5–8] and focus on CO2 dissociation. Progress in any plasma technology that uses molecular gases is indissolubly linked with the understanding of the various kinetics involved (i.e. electron, vibrational, chemical and surface kinetics) and their coupling. For plasma-based CO2 conversion, a central piece of the puzzle to be solved resides in a deep understanding of the detailed mechanisms of the up-pumping of vibrational quanta along the vibrational ladder [9]. Indeed, the main idea behind the process of plasma CO2 decomposition is that the non-equilibrium nature of the plasma provides promising conditions for the energetically efficient CO2 dissociation. The typical energy of the electrons in the plasma strongly favours vibrational excitation, promoting the input of vibrational quanta in low levels and subsequent up-pumping during relaxation [9], while keeping the gas temperature relatively low and thus limiting the losses into gas heating. The vibrationally excited molecules can then become more reactive and lead to dissociation at a low energy cost.
State-to-state kinetic models, where the different vibrational levels are treated as independent species, constitute a powerful tool to investigate the vibrational energy transfer and relaxation in molecular plasmas. However, although the ladder climbing mechanism is relatively well understood for diatomic gases [10], an accurate description and study of vibrational energy exchanges in polyatomic gases such as CO2 remains very challenging. The underlying reason is the complex geometry of the CO2 molecule, which has four vibrational modes (one symmetric stretching mode, two degenerate bending modes, and one asymmetric stretching mode) resulting in a multitude of vibrational levels and a large number of reactions. Another difficulty is the lack of knowledge related to CO2 rate coefficients for energy exchanges between the translational and vibrational degrees of freedom (vibration–translation (V–T) transitions) and among the vibrational levels (vibration–vibration (V–V) transitions). Additionally, there are no cross sections available for the manifold of electron-impact direct and stepwise excitation of vibrationally excited states (e-V processes). Therefore, the state-to-state modelling of CO2 discharges is currently impossible without involving approximate theories for scaling over scarce data to obtain the inaccessible rates.
Several strategies to tackle the problem have been proposed over the last few years. Kozák and Bogaerts [4] have modelled microwave and dielectric barrier discharges, taking into account only a few low-lying symmetric stretching and bending mode levels, whilst the asymmetric mode levels  are included up to a dissociation energy of 5.5 eV assuming the energy levels of a Morse oscillator (corresponding to n = 21 bound vibrational levels). Despite the considerable success of this model and the breakthrough it represents, some of the rate coefficients it considers are disputable [11] and the formulation neglects, to a large extent, inter-mode coupling and the increased density of levels near the continuum—an idealisation of the system that may prove appropriate but requires further investigation. A similar approach was adopted by the Bari group, which addresses in detail the dependence of the electron energy distribution function on the concentration of electronically and vibrationally excited states [3]. The study of vibrational kinetics in the hypersonic boundary layer of reentering bodies in the Mars atmosphere in a dissociation–recombination regime by Armenise and Kustova [6] contains several thousand levels and disregards free electrons. In a more recent work by Armenise [12], electrons are included in the kinetic scheme, which nevertheless accounts for only a very limited number of electron impact processes. This very impressive and detailed model is difficult to apply at present to the description of gas discharges due to the too extensive vibrational kinetics and the very simplified electron kinetic scheme. Another possibility, suggested by Gordiets et al [13, 14], is to divide vibrational levels into multiplets with an equilibrium distribution of the levels within each multiplet.
Herein, we present the second of two papers where we follow a different approach, aimed at understanding vibrational energy transfers in CO2 plasmas. Specifically, we develop a detailed model accounting for the vibrational kinetics of the lower levels of each vibration mode and of the lower mixed levels, with the relevant rate coefficients being validated in sequential steps. In a companion paper [11], we have analysed the vibrational relaxation in the afterglow of a DC pulsed discharge at pressures p = 3−5 Torr and discharge current I = 50 mA and validated the rate coefficients used to describe the V−T and V−V energy exchanges. The simple geometry and homogeneity of pulsed DC discharges make them accessible to a series of diagnostics and suitable to the development of 0D self-consistent kinetic models accounting for very complex vibrational and chemical kinetics. For this reason, they are ideal for fundamental studies, both experimental [15, 16] and theoretical [10, 17]. We now extend the model from [11] to the active discharge, with the inclusion of electron impact processes of vibrational excitation and de-excitation (e-V) and ionization, in order to gain insight into the input of vibrational energy in the plasma by electron impact and to validate the electron impact cross sections and rate coefficients for the individual e-V processes taken into account.
The definition of the relevant e-V transitions to consider and the choice of the respective cross sections is far from straightforward. On the one hand, the cross sections available from swarm-derived sets include only a very limited number of individual collisional processes. Moreover, most of these cross sections refer to 'energy losses' corresponding to the excitation of lumped levels [18]. It is therefore necessary to establish procedures to deconvolute the original cross sections and to calculate the missing ones, such as Fridman's approximation [4, 9]. On the other hand, a set of cross sections for the resonant excitation of up to ten vibrational levels in each mode was recently calculated by Laporta and co-workers using R-matrix codes [19]. These new data are very exciting and open new possibilities for research, but are still difficult to use in state-to-state models. In fact, although the calculations seem to provide results for the symmetric stretching mode in good agreement with data from the literature, non-resonant contributions may be of importance for the bending and asymmetric modes.
The current model couples the electron Boltzmann equation, using the usual two-term expansion approximation, and a system of rate balance equations describing the creation and loss of both the low vibrational levels of CO2 and of CO2+ ions. The cross sections of the e-V processes are obtained from a direct deconvolution of the available lumped cross sections according to the statistical weights of the various levels and the missing cross sections are generated using Fridman's approximation. The model is validated through the comparison of the calculated time-dependent concentrations of several individual vibrational levels of CO2 with the experimental results obtained in a millisecond pulsed glow discharge. A detailed analysis of Fridman's approximation [9], Laporta's cross sections [19] and alternative deconvolution procedures will be made in a future publication.
The organization of the paper is as follows. Section 2 details the kinetic model developed to describe CO2 plasma in the low-excitation regime and the selection of the collisional data. A brief description of the experimental investigation that has provided the data suitable for validation of the model is made in section 3. Section 4 presents a comparison between the measured and calculated time-dependent densities of various vibrationally excited CO2 levels and a discussion of the results. Finally, the conclusions are given in section 5.
2. Description of the model
The kinetic model developed in this work to study low-pressure pulsed DC discharges and their afterglows is used in two coupled modules, one describing the discharge and the other the post-discharge. In this paper, we discuss in detail the discharge module, while the post-discharge module was carefully presented in [11]. The input parameters to the simulations are the discharge pressure, current, pulse length and the tube radius, while the gas temperature profile in the pulse is taken from experiments (see section 3). The time-dependent electron density profile is estimated from the measured temporal variations of the discharge current and electric field, while assuming an exponential growth estimated from the CO2 ionization coefficient and ensuring that the self-consistent value obtained for the steady-state current at the end of the pulse matches the input parameter to the model (see section 4).
The discharge module couples the solutions to the homogeneous electron Boltzmann equation and a system of rate balance equations for various individual vibrational levels of CO and for CO2+ ions. This system takes into account the processes of excitation and de-excitation of the vibrational levels by electron impact (e-V processes), V–V and V–T energy exchanges, electron impact ionization and ambipolar diffusion to the wall. Using the rate coefficient 6.6 × 10⁻⁸ cm3 s−1 reported in [3], we estimate that the loss rate of charged particles by electron–ion recombination is about 25–50 times smaller than by ambipolar diffusion. At present, a low excitation regime is assumed, in which only a few vibrational levels are excited, namely the levels corresponding to quantum numbers up to
  and
and  , where ν1, ν2 and ν3 denote, respectively, the vibrational quantum numbers associated with the symmetric stretching, bending and asymmetric stretching modes, resulting in a total of 72 vibrational levels. These low excitation conditions can be obtained under the experimental conditions considered in the present work, with millisecond pulse durations and a discharge current of 50 mA. Some of the levels included in the model are effective levels corresponding to groups of vibrationally excited states in Fermi resonance that are difficult to resolve and, therefore, are observed lumped together. All the information regarding the vibrational levels actually used, the grouping into effective levels, notation used and calculation of V–V and V–T rate coefficients is thoroughly presented in [11] and is briefly reviewed in section 2.1.
The self-consistent reduced electric field is determined from the electron and ion rate balance equations using the requirement that, under steady-state conditions, the total rate of ionization must compensate the rate of electron loss by ambipolar diffusion to the wall under the assumption of a quasi-neutral discharge. Once the self-consistent sustaining field and electron density are obtained for a steady-state situation, the system of rate balance equations for the heavy particles is solved in time for the length of the pulse, using the electron excitation rates derived for the steady-state case. This is obviously an approximation, but it has proved very satisfactory in the study of O2, N2–O2 and N2–CH4 pulsed discharges in previous works [17, 20–22]. As initial conditions for the system of rate balance equations, the populations of various vibrational levels are assumed to follow a Boltzmann distribution corresponding to the experimental initial vibrational temperatures. The solutions obtained in the end of the discharge pulse are then used as initial conditions for the post-discharge module, where the system of rate balance equations is solved including the same V–T and V–V exchanges, while neglecting all the electron impact processes. This approximation is justified since, besides the decay of the electron density, the timescale for electron energy relaxation is much shorter than the relaxation time of the vibrational energy [3, 23, 24]. Accordingly, electron impact processes are not expected to play any significant role in the vibrational kinetics of the post-discharge in the ms timescale under study.
2.1. Vibrational kinetics
The CO2 molecule in its ground electronic state is linear and possesses three normal vibrational modes: symmetric stretching, the double degenerate bending vibration and asymmetric stretching. These modes are characterized by quantum numbers ν1, ν2 and ν3 respectively. The degeneracy of the bending vibration mode requires one more quantum number to fully describe the CO2 vibrational state, l2, associated with an angular momentum, which can take the values l2 = ν2, ν2 − 2, ν2 − 4, ...1 or 0. The vibrational state of the molecule can then be identified in principle as  . However, polyatomic molecules, due to their multidimensional nature, commonly exhibit so-called 'Fermi resonance,' which refers to an accidental energy degeneracy between certain vibrational modes. In the case of CO2, the modes ν1 and 2ν2 have very close vibrational energies and the same type of symmetry, resulting in a coupling between the CO
 and CO
 levels to form new states that are assumed to be in local equilibrium. Note that all the vibrational levels coupled together have the same orbital quantum number l2, since those with different l2 cannot perturb each other [25].
Following [11], in the present model the CO2 vibrational levels under Fermi resonance are considered as one single effective level. The vibrational energy of this effective level is determined through the average of the vibrational energies of all the individual levels in the effective level, calculated using the anharmonic oscillator approximation [26], while its statistical weight is determined through the sum of the statistical weights of the individual states. These effective levels are denoted in this work by CO , where the ν1, ν2 and ν3 quantum numbers correspond to the level with the highest ν1; the ranking number f is always equal to ν1+1 and indicates how many individual levels are accounted for in the effective level. For instance, the level CO
 stands for the coupling of the three levels CO
 , CO
, CO and CO
 .
.
A detailed description of the vibrational energy exchanges in molecular collisions requires the knowledge of the corresponding state-specific V–T and V–V rate constants, which are available for several vibrational transitions between the lowest states. This is, however, not sufficient for a full characterization of the vibrational kinetics, since the rate coefficients of many other transitions are still missing. For this reason, much effort has made over the years to develop theories to calculate unavailable rate coefficients for vibrational energy transfers [27–31]. In this work, we use the rate constants for the low-lying levels given in the survey of Blauer and Nickerson [32], while for the higher levels and missing transitions we have used the scaling laws based on the Schwartz–Slawsky–Herzfeld (SSH) [27] and Sharma–Brau (SB) [29] theories.
Despite its limitations, the SSH theory provides a fairly simple expression for the rate constants and it is commonly used in many kinetic models with evident success [3, 4, 6, 7]. The current low-excitation conditions do not involve transitions with too high probabilities and the first order perturbation approaches of the SSH and SB theories were shown to be valid [11]. The situation is different regarding collisions of highly vibrationally excited molecules and/or high gas temperatures (Tg > 1500 K), as pointed out in [11]. A thorough analysis of the vibrational energy relaxation in the CO2 post-discharge is presented in the companion paper [11], where the rate constants for the V–T and V–V energy exchanges used here have been validated.
2.2. Electron kinetics
The electron energy distribution function (EEDF) is self-consistently calculated by solving the steady-state, homogeneous electron Boltzmann equation in the two-term expansion approximation. The electron Boltzmann equation is solved taking into account elastic and inelastic collisions between electrons and CO molecules, including vibrational excitation energy losses (corresponding either to the excitation of individual levels or of groups of vibrational levels), superelastic collisions with CO2 vibrational excited states, the excitation of two groups of electronic states and ionization. The complete and consistent cross sections set used for the calculation of EEDF is available at the IST-Lisbon database published at LXCat and is described in detail in [18].
Superelastic collisions with vibrationally excited molecules in the discharge do not noticeably affect the current results due to the low degree of vibrational excitation in the conditions under investigation. The same conclusion has been drawn recently by Pietanza et al [23]. Moreover, it has been shown that superelastic collisions with electronically excited states of CO2 can have a strong influence in shaping the EEDF in the early instants of the post-discharge [3, 23]. However, electron impact processes in the afterglow are not expected to give any significant contribution to the results in the present conditions, as discussed in section 2, and are neglected in our simulations.
Once a validated electron impact cross section set is available, an important step in the study of electron kinetics is to understand, in depth, how the energy gained by the electrons from the electric field is transferred through collisions into the different channels. Regarding CO2 conversion, the most relevant pathways for electron energy transfer are CO2 vibrational excitation and dissociation [9]. In low-pressure discharges, the initial energy input necessary for the vibrational excitation of stable CO2 molecules is provided by electrons of energies ∼1 eV. Figure 1 illustrates the fraction of energy transferred from the electrons into the different channels of CO2 excitation and ionization as a function of the reduced electric field, E/N , in a pure CO2 discharge. The fractional power losses to the different CO2 excitation channels are calculated as the ratio between the electron energy transferred per unit time and volume, using the cross sections for the corresponding electron-impact reactions [18], and the total power per unit volume gained from the field. The results are in agreement with the literature [9, 23, 33], showing that the major portion of the discharge power is transferred from the plasma electrons to the vibrational excitation of CO2 molecules when the electron temperature is around 1–2 eV, or, equivalently, for reduced electric fields of about 40–80 Td. At higher reduced electric fields, the electronic excitation, dissociation and ionization channels are activated.
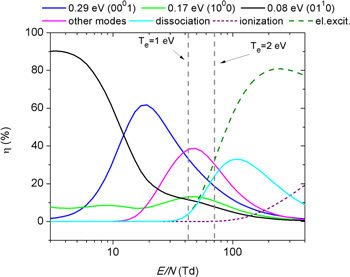
Figure 1. Fraction of electron energy transferred to different channels of vibrational excitation, electronic excitation, dissociation and ionization of CO2 as a function of the reduced electric field (E/N ), calculated from the corresponding cross sections of the electron impact reactions.
Download figure:
Standard image High-resolution imageAnother crucial piece of information provided after the calculation of the EEDF is the value of the various electron-impact rate coefficients. Regarding the e-V excitation from state i to state j, the corresponding coefficient is given by

where σij is the corresponding cross section, m is the electron mass, u the electron energy, and f(u) the EEDF, normalized according to the condition  . As the cross section set used in this work to calculate the EEDF includes only a limited number of cross sections corresponding either to the excitation of individual levels or groups of vibrational levels from the ground level [18], two very challenging steps are the choice of cross sections for: (i) the excitation of each individual level that is included in the model from the ground state, and (ii) the transitions between vibrationally excited levels, while maintaining compatibility with [18].
In order to deconvolute the cross sections from [18] (used to obtain the EEDF) into the individual cross sections for the levels included in the heavy-particle rate balance equations [11], it is assumed that the electron energy is equally distributed amongst the levels lumped inside each of the cross sections considered in [18], weighted by the statistical weight of the excited states. The statistical weight of a CO level depends only on the l2 quantum number, being 1 for l2 = 0 and 2 (corresponding to two possible directions of rotation) otherwise. The statistical weight of a CO
 level (i.e. including all possible values of l2 compatible with ν2) depends only on the bending mode,
  . In practice, if C0j is the rate coefficient for the excitation of the individual level j from the ground-state and Co is the rate coefficient calculated from the original cross section of the IST-Lisbon data set containing the required process, the individual electron impact rate coefficient is obtained from

where gj and go are the corresponding statistical weights, go corresponding to the sum of the statistical weights of all the individual levels contained in the original cross section. As an example, the rate coefficient for the excitation of the CO level, containing the two degenerate levels CO2(1110) and CO2(0310), with statistical weight
  , is calculated as
  , where the rate coefficient
  is calculated using the original cross section denoted as CO2(υ3) in [18], corresponding to the energy loss at 0.252 eV and accounting for the total excitation of the levels (030) and (110) (regardless of the quantum number l2), with statistical weight
  (or, equivalently,
  ). The full list of vibrational excitation processes by electron impact considered in this work is given in table 1, accounting for 32 excitations of the ground-state CO
 molecules and 115 stepwise excitations, as well as the corresponding original cross sections and the fractions gj/go.
Table 1. Electron impact reactions included in the model. The rate coefficients are calculated using the cross sections (and notation) presented in [18].
| No | Reaction | Cross section | Notes |
|---|---|---|---|
| 1a | e + CO e + CO e + CO
|
υ1 | i = 0, 1, 2, 3, 4, 5 |
| 1b | e + CO e + CO e + CO
|
υ1 | 1 ≤ j < 5 |
| 2a | e + CO e + CO e + CO
|
2/3 
|
|
| 2b | e + CO e + CO e + CO
|
2/3 
|
|
| 3a | e + CO e + CO e + CO
|
1/3 υ3 | |
| 3b | e + CO e + CO e + CO
|
1/3 υ3 | |
| 4a | e + CO e + CO e + CO
|
1/5 
|
|
| 4b | e + CO e + CO e + CO
|
1/5 
|
|
| 5 | e + CO e + CO e + CO
|
1/8 υ6 | |
| 6a | e + CO e + CO e + CO
|
υ4 | |
| 6b | e + CO e + CO e + CO
|
υ4 | k = 0, 1, 2, 3 |
| 6c | e + CO e + CO e + CO
|
υ4 | m = 0, 1 |
| 6d | e + CO e + CO e + CO
|
υ4 | |
| 7a | e + CO e + CO e + CO
|
equation (3) | |
| 7b | e + CO e + CO e + CO
|
equation (3) | |
| 7c | e + CO e + CO e + CO
|
equation (3) | |
| 7d | e + CO e + CO e + CO
|
equation (3) | |
| 8a | e + CO e + CO e + CO
|
equation (3) | |
| 8b | e + CO e + CO e + CO
|
equation (3) | |
| 8c | e + CO e + CO e + CO
|
equation (3) | |
| 8d | e + CO e + CO e + CO
|
equation (3) | |
| 9a | e + CO e + CO e + CO
|
equation (3) | |
| 9b | e + CO e + CO e + CO
|
equation (3) | |
| 9c | e + CO e + CO e + CO
|
equation (3) | |
| 9d | e + CO e + CO e + CO
|
equation (3) | |
| 10a | e + CO e + CO e + CO
|
equation (3) | |
| 10b | e + CO e + CO e + CO
|
equation (3) | |
| 10c | e + CO e + CO e + CO
|
equation (3) | |
| 11a | e + CO e + CO e + CO
|

|
|
| 11b | e + CO e + CO e + CO
|

|
|
| 12 | e + CO e + CO e + CO
|
 2/10 2/10 
|
|
| 13 | e + CO e + CO e + CO
|
2/3 
|
|
| 14 | e + CO e + CO e + CO
|
2/5 
|
|
| 15 | e + CO e + CO e + CO
|
1/4 
|
|
| 16 | e + CO e + CO e + CO
|
3/8 υ6 |
For the transitions from the ground state to the higher vibrationally excited levels that are not included in any of the cross sections from the data set [18], i.e. j = 2, 3, 4, 5 and i = 0 in the asymmetric mode, we have used the Fridman approximation [9], based on the semiempirical formula

This expression allows us to scale the excitation rate coefficients Cij for any transition between vibrational levels i and j, provided that the rate coefficients C01 is known. The magnitude of the rate coefficient is altered depending on the parameters α and β, specific of each plasma species. In the case of CO2, α = 0.5 for the asymmetric mode and the value of β is unknown [9], which in our case is irrelevant, since Fridman's approximation is used only when i = 0.
For the cross sections for the stepwise excitation of levels j from  , we have chosen a different strategy, due to the unknown β parameter, which would be necessary for the Fridman approximation. Alternatively, we have used a simple threshold reduction by keeping the magnitude and shape of the
  cross section, but with a shift in the threshold to account for the anharmonicity of the oscillator. This approach has been used for nitrogen in [10] and compared with other hypotheses and more accurate cross section calculations in [34]. Despite the differences between the different approaches, the results and discussion by Colonna et al [34] strongly suggest that this simple approximation is appropriate in the present context.
Different scaling laws can be used to obtain the unknown cross sections, and the determination of the best choice of cross sections for electron collisions involving transitions between vibrational levels of CO2 is still subject to large uncertainties. This subject will be further investigated in the future.
The rate constants for superelastic collisions are obtained from the Klein–Rosseland relation

which represents the microscopic reversibility of the collision processes.
2.3. Spontaneous emission
Loss or gain of vibrational quanta may also occur through radiative processes, contributing to the infrared spectra of CO2. The model presented here follows [11] and includes the vibrational transitions  within each mode of the CO2 molecule by emission of a single photon (5):
The Einstein coefficients for the spontaneous emission are taken from Blauer et al [32] and Rothman et al [35]. The absorption of radiation is not taken into account. Note that these mechanisms were found to be negligible for the discharge pulse under the current conditions and in practice can be disregarded from the present analysis.
2.4. Maintenance electric field
The value of a maintenance reduced electric field during the pulse is obtained by solving the continuity equations for the positive ions CO2+, coupled to the system of equations for vibrational levels and adopting the quasineutrality of the discharge. The crucial requirement is that, under steady-state conditions, the total rate of ionization must compensate exactly for the rate of electron loss by ambipolar diffusion to the wall. In the presence of n species of positive ions, the ambipolar diffusion coefficient for a certain species i, Da,i, reads
where Di and  are the free diffusion coefficient and the mobility for species i, and the species with index n + 1 corresponds to electrons [10]. Accordingly, the values of Dn+1 and μn+1 are negative, as well as the value of the electron density nn+1 = −ne. In the present case, the only positively charged particles included in the model are CO2+ ions and the expression above simplifies to the usual expression [9]. In the calculation of the ambipolar diffusion coefficient, we use the mobility of CO2+ in CO2 given in [36], whilst the corresponding free diffusion coefficients are calculated using the Einstein relation, as suggested in [37].
3. Experiment
The experimental results were obtained by time-resolved in situ Fourier transform infrared spectroscopy (FTIR) in a pulsed DC glow discharge, allowing the determination of the population of the same vibrational levels of CO2 described in the model [11, 15]. The measurements were performed in flowing conditions, at pressures between 1 and 5 Torr and pulsed plasma current in the range 10–50 mA. The inner tube diameter of the reactor is 2 cm. The measured infrared transmittance spectra is then analysed using the algorithm developed by Klarenaar et al described in detail in [15]. Additionally, the electric field was measured with two tungsten probes that are inserted in the discharge tube 8.5 cm apart and the steady-state value was then compared to the self-consistent reduced electric field calculated in the model.
Infrared absorption is a line of sight integrated technique which can pose some difficulties when drawing a comparison with the modeling results. First, part of the gas along the optical path is not excited by the plasma. This dead volume is assumed to be at thermal equilibrium in the fitting algorithm and accounts for about 26% of the total volume of the reactor. The second issue is that slow processes such as the cumulative dissociation of CO2 over repetitive plasma pulses can lead to an axial profile along the tube length which relates to an average molecular density in the absorption measurement results. However, since in this work we are focusing on the 'single pulse' measurement, this last question does not come into play.
The 'single pulse' measurement was made with a gas flow rate of 166 sccm of CO2, 5 ms plasma-on time and 150 ms off time, at p = 5 Torr and I = 50 mA [11, 15]. At these conditions, there is no significant dissociation during a single pulse and the residence time (∼100 ms) is shorter than the off time, allowing the gas to fully renew, leaving the reactor with most of the CO and O2 removed. Accordingly, collisions of CO2 with CO, O and O2 are expected to play a negligible role in the CO2 vibrational kinetics. The results of this measurement are, therefore, suitable for the comparison with the model predictions and confirmation of the e-V rate coefficients, since only e-V processes need to be added to the model where the CO2–CO2, V–T and V–V rate coefficients have been validated [11].
4. Results and discussion
This section presents and discusses the results of the model, together with a comparison with the pertinent experimental data reported in [15]. All the results shown in this paper correspond to the active part of the 'single pulse' measurement, i.e. p = 5 Torr, I = 50 mA for a pulse of 5 ms and 150 ms off time (see section 3), during the active part of the discharge. The calculated value of the reduced electric field in these conditions is E/N = 55 Td, in excellent agreement with the measured value at the end of the pulse, which is around 54 Td. Except where otherwise noted, the measured time-resolved gas temperature profile from [15] (reproduced in figure 9) is used as an input to the model, while the electron density profile is estimated from the temporal evolution of the discharge current and electric field, as discussed in section 2. To facilitate the discussion, this set of conditions is hereafter referred to as the 'reference model.' The time-dependent electron density profile is shown in figure 2. The steady-state value ensures the self-consistent calculation of the discharge current to match the experimental value I = 50 mA.
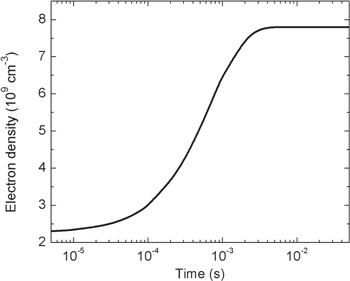
Figure 2. The electron density profile estimated from the temporal evolution of the discharge current and electric field.
Download figure:
Standard image High-resolution imageThe temporal evolution of the calculated and measured normalized populations of the first two vibrationally excited levels of the asymmetric stretching mode are presented in figure 3. Both the calculations and the experimental data show a fast growth of the CO populations in the first millisecond of the pulse. Subsequently, the gas heating enhances the energy exchanges to the translational degrees of freedom, leading to a population drop at about 1 ms. This can be confirmed by an inspection of figures 4 and 5.

Figure 3. Normalized density of the CO2(00011) and CO2(00021) states during the active part of a pulsed DC discharge at p = 5 Torr, I = 50 mA, Δ tpulse = 5 ms, as a function of the discharge on-time. The symbols correspond to the experimental values and the black solid lines correspond to the simulation results.
Download figure:
Standard image High-resolution image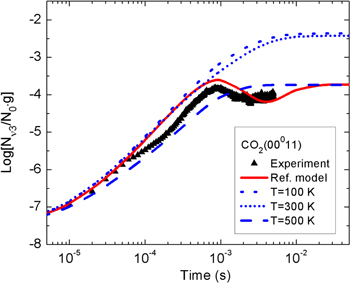
Figure 4. Normalized density of the CO2(00011) states under the same conditions as in figure 3. The closed black symbols correspond to the experimental values, while the lines present the simulation results calculated with different values of the gas temperature.
Download figure:
Standard image High-resolution imageFigure 4 shows the time-evolution of the population of the CO2(00011) level calculated from our reference model and when constant values of gas temperature along the discharge pulse are considered. The results reveal a higher population for this level at lower gas temperatures, in accordance with the results from [8], demonstrating the importance of cooling down the gas for an effective excitation of the asymmetric mode. Furthermore, the calculations made at constant Tg do not exhibit a local maximum of the population at 1 ms on-time, indicating that this effect is dominated by the modification of the V–V and V–T rate coefficients with the gas temperature.
Figure 5 shows the net contribution of the dominant populating and depopulating mechanisms of the first level of the asymmetric mode, where the full and dashed lines correspond, respectively, to net creation and net loss mechanisms (i.e. the dashed lines are multiplied by −1). In the early instants of the discharge, this level is mainly created by electron impact from the ground-state,

Once the population of the second asymmetric level becomes large enough, V–V reactions within the asymmetric mode depopulating ν3 = 2 become the dominant creation mechanism,

Finally, as the gas temperature increases, V–T deactivation to the bending and symmetric modes starts to play an important role,

justifying the decrease in the population for on-times around 1 ms.
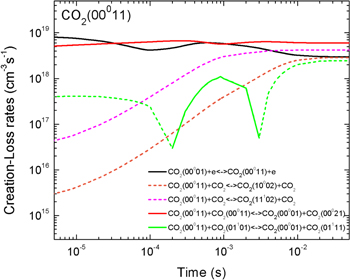
Figure 5. Net contribution of several mechanisms in the creation and loss of CO . The dashed lines represent loss mechanisms, i.e. they are multiplied by −1 in the plot.
Download figure:
Standard image High-resolution imagePanels (a) and (b) of figure 6 show the time-dependent populations of the first two levels of the symmetric mode and the first three levels of the bending mode, respectively. The simulation results are in generally good agreement with the experimental data, albeit predicting a slightly slower growth of the populations as compared with the experiment. It can be observed from the figures that the discrepancy is more prominent with an increase in the quantum number. The reasons for this difference are not yet clear. Possible explanations may involve more complex deconvolution procedures of the lumped cross sections and/or an influence of vibrational transfers from the asymmetric mode in collisions involving oxygen molecules or excited atoms. Ongoing investigation should cast light on this question. Preliminary results point towards a higher likelihood of the latter mechanisms, but at this stage it is premature to draw definitive conclusions.
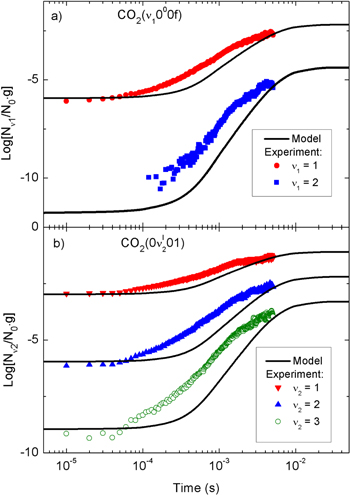
Figure 6. Normalized density of several states (a) in the symmetric mode and (b) in the bending mode of vibration during active discharge under the same conditions as figure 3. The symbols correspond to the experimental values, while the solid lines correspond to the model predictions.
Download figure:
Standard image High-resolution imageFigure 7 shows the calculated vibrational distribution function (VDF) of the levels in the asymmetric mode during the discharge (a) and afterglow (b). Clearly, the VDF deviates from a Boltzmann distribution during the discharge, in contrast with the afterglow regime, where a Boltzmann distribution is quickly established, although a complete thermalisation only takes place at times ∼10−3−10−2 s. On the other hand, the VDF of the bending mode exhibits a Boltzmann distribution both during the active discharge and the afterglow regime, as shown in figures 8(a) and (b), respectively. The excitation of the bending mode during the pulse is slower than that which is observed in the asymmetric mode, whilst the behavior in the post-discharge is similar for both modes with comparable thermalization times.

Figure 7. Time-resolved vibrational distribution function of the lower vibrational levels of the asymmetric mode, normalized to the ground-state density (a) in the active CO2 discharge; (b) during the post-discharge, under the same conditions as figure 3. Red dashed lines indicate the energies of the first five levels of the asymmetric mode.
Download figure:
Standard image High-resolution image
Figure 8. Time-resolved vibrational distribution function of the lower vibrational levels of the bending mode, normalized to the ground-state density (a) in the active CO2 discharge; (b) during the post-discharge, under the same conditions as figure 3. Red dashed lines indicate the energies of the first five levels of the bending mode.
Download figure:
Standard image High-resolution imageThe degree of vibrational excitation and non-equilibrium of CO2 can be characterised by the 'temperatures' of each normal mode, calculated from the populations of the corresponding excited levels. In particular, the characteristic temperature of the asymmetric mode, T3, is obtained by fitting the calculated densities of the CO2(00 ) levels to a Treanor distribution, while the characteristic temperature of the effective symmetric (which includes the Fermi resonant states) and bending modes, T1 and T2, respectively, are obtained from simple Boltzmann plots. Figure 9 shows the time evolution of the calculated three temperatures along the discharge pulse, together with the values for T3 and T1,2, obtained experimentally, where T1,2 is a common temperature assumed for the symmetric and bending modes [15]. The simulation results confirm the validity of the assumption that the temperatures T1 and T2 are nearly the same, associated with the Fermi resonance between the symmetric and bending modes of vibration and with the similarity of the energies and rate coefficients involving Fermi and non-Fermi bending levels. Therefore, the two characteristic temperatures T1,2 and T3 suffice for a simple description of the extent of vibrational excitation. For the conditions under analysis, T3 exhibits a fast elevation of 500 K above Tg and T1,2 in good agreement with the measurements, confirming the preferential excitation of the asymmetric mode and the strong non-equilibrium nature of the discharge.

Figure 9. Comparison between calculated and measured vibrational temperatures: T1, T2 and T3 correspond to the symmetric stretching, bending and asymmetric stretching modes of vibration, respectively. The insert shows that the calculated T1 and T2 are nearly equal. The measurements assume a common temperature T1 = T2. The experimental gas temperature profile is represented by the black solid line.
Download figure:
Standard image High-resolution imageThe influence of the electron density temporal profile (ne) used as the input to our simulations can be asserted by an inspection of figure 10, showing the measured and calculated effective temperatures of the asymmetric mode, T3, using the reference model and three different values of ne kept constant along the full duration of the pulse. Inspection of the figure confirms that considering the constant steady-state value of the electron density along the pulse yields the correct final result for T3, as it should, but leads to an overestimation of the temperature up to times of the order of 10 ms. On the other hand, the simulation performed with an electron density of 2.5 × 109 cm−3 leads to the same predictions as the reference model for times up to ∼5 × 10⁻⁴ s, but produces underestimated values of T3 at the end of the discharge pulse. Naturally, taking a constant value ne = 5 × 109 cm−3 results in an intermediate situation as compared to the two extreme cases. Figure 10 shows that a good qualitative description can be made assuming a constant electron density along the discharge pulse, but that quantitative analysis must take into account more realistic temporal profiles for ne.

Figure 10. Measured (◦) and calculated vibrational temperature T3 using the electron density profile from figure 2 (—) and using constant electron densities of  cm−3 (
 ), 5 × 109 cm−3 (
 ), and 7.5 × 109 cm−3 (
 ).
).
Download figure:
Standard image High-resolution image
5. Conclusions
The present work studies the state-to-state kinetics of the first 72 low-lying levels of CO2 plasma during active discharge, corresponding to  and
and  with energies up to about 2 eV. The model was validated by comparing the calculated populations with the time-resolved in situ FTIR measurement realized in a pulsed DC glow discharge [15]. Mechanisms related to the V–V and V–T energy exchanges were previously examined in the study of the CO2 afterglow published in a companion paper [11]. To describe the active discharge, a detailed set of electron-impact excitation and de-excitation processes is added to the list of reactions taken into account previously in the post-discharge.
The very good agreement between the model predictions and the experimental results validates the correctness of our description, despite some differences persisting in the time-evolution of the populations of the symmetric and bending excited states. The present results confirm the non-equilibrium nature of low-pressure CO2 plasmas, with a characteristic temperature of the asymmetric vibration mode, T3, well above the vibrational temperatures of the other two modes and of the gas temperature, Tg. T3 exhibits a maximum during the discharge pulse, which for the conditions under study (pressure p = 5 Torr and discharge current I = 50 mA) occurs at about 1 ms on-time, strongly connected with the gas heating along the pulse and the increased contribution of V–T deactivation with Tg.
The investigation further corroborates the validity of the often-made assumption of equality of the vibrational temperatures of the symmetric and bending modes, T1,2. This opens the possibility of using a state-to-state approach to benchmark and establish domains of validity of three-temperature (Tg, T12 and T3) macroscopic descriptions of CO2 plasmas trying to capture some essential features of non-equilibrium phenomena, as has been done for the case of nitrogen [38]. If the appropriate conditions are met, such semi-empirical approaches can be useful for reducing the computational cost of handling a large number of elementary processes.
Future work will analyse, in detail, some of the assumptions made here, such as the procedure for the deconvolution of lumped cross sections, Fridman's approximation and the scaling laws for missing electron-impact processes, the assumptions regarding the electron density profile, or the utilisation of the vibrational resonant excitation cross section from [19]. Work is in progress to extend our investigation to higher excitation regimes in order to study both the electron impact and vibrational dissociation of CO2, which do not play relevant roles in the conditions studied in this paper. This task involves many challenges. For instance, electron impact collisions with all dissociation by-products must be included, as well as vibrational energy exchanges between different partners (CO2–CO, CO2–O, CO–CO, etc). The effect that the extended vibrational ladder will have on the EEDF should also be taken into account, following, for example, the procedure described in [39]. Another complex endeavour is to validate the scaling methods for the calculation of V–V and V–T rate coefficients appropriate for the higher excitation, since the first-order perturbation theories used in this work, namely SSH and SB, do not provide a valid description of these exchanges at high temperatures and high vibrational numbers. Such a comprehensive model will offer valuable insight into the fundamental reaction mechanisms in CO2 plasmas.
Acknowledgments
This work was partially supported by the Portuguese FCT under Projects UID/FIS/ 50010/2013 and PTDC/FIS-PLA/ 1420/ 2014 (PREMiERE), and grant PD/BD/ 105884/ 2014 (PD-F APPLAuSE). VG and RE have been supported by LABEX Plas@par receiving financial aid managed by the Agence Nationale de la Recherche under the reference ANR-11-IDEX-0004-02.