

Abstract
High power impulse magnetron sputtering (HiPIMS) plasmas exhibit a high ionization fraction of the sputtered material and ions with high kinetic energies, which produce thin films with superior quality. These ion energy distribution functions (IEDF) contain energetic peaks, which are believed to be linked to a distinct electrical potential hump  inside rotating localized ionization zones, so called spokes, at target power densities above 1 kW cm−2. Any direct measurement of this electrical potential structure is, however, very difficult due to the dynamic nature of the spokes and the very high local power density, which hampers the use of conventional emissive probes. Instead, we use a careful analysis of the IEDFs for singly and doubly charged titanium ions from a HiPIMS plasma at varying target power density. The energy peaks in the IEDFs measured at the substrate depend on the point of ionization and any charge exchange collisions on the path between ionization and impact at the substrate. Thereby, the IEDFs contain a convoluted information about the electrical potential structure inside the plasma. The analysis of these IEDFs reveal that higher ionization states originate at high target power densities from the central part of the plasma spoke, whereas singly charged ions originate from the perimeter of the plasma spoke. Consequently, we observe different absolute ion energies with the energy of Ti2+ being slightly higher than two times the energy of Ti+. Additional peaks are observed in the IEDFs of Ti+ originating from charge exchange reactions from Ti2+ and Ti3+ with titanium neutrals. Based on this analysis of the IEDFs, the structure of the electrical potential inside a spoke is inferred yielding
  = 25 V above the plasma potential, irrespective of target power density.
Export citation and abstract BibTeX RIS
1. Introduction
High power impulse magnetron plasmas (HiPIMS) are characterized by a high degree of ionization and a very energetic growth flux. The peak power is delivered in short pules of 10–200 μs, duty cycles of a percent only or less, and power densities at the target of up to several kW cm–2 [1–3]. The main drawback of HiPIMS is its lower deposition rate for the invested power compared to dc magnetron systems.
Ion energy distribution functions (IEDFs) have been measured for HiPIMS by several groups. Bohlmark et al measured IEDF for HiPIMS discharges with a titanium target [4]. The results showed that Ti ions in HiPIMS discharges reach energies up to 100 eV while the energies for dcMS were significantly lower and only up to 40 eV. Two peaks were found in the IEDF: a narrow one at low energies around 1 eV and a broad peak at 30 eV. Time resolved measurements showed, that during the pulse the ions with high energies were detected, while the ions with low energies mainly originated from the afterglow of the pulse. Hecimovic and Ehiasarian measured IEDF of Cr and Ti ions [5, 6]. They observed the same peaks, with the high energetic peak in chromium being less pronounced. The low energetic peak was associated with thermalised ions mostly in the afterglow, while the high energetic peak was assumed to result from sputtered neutrals being iodized. Sputtered neutrals show a Sigmund–Thompson distribution with higher energies compared to thermalised ions showing a Maxwell–Boltzmann distribution. Various explanations are proposed to explain the occurence of high energetic ions or multiple peaks in the IEDFs of HiPIMS plasmas. These range from reflected ions at the target [7], the high-energy (HE) tail of the Thompson distribution [5], negative ions that are generated in front of the target surface that are accelerated towards the substrate by the full target potential [8–10], a modified two-stream instability [6] or the existence of internal double layers [7]. A more detailed discussion of the proposed phenomena is given elsewhere [8].
The most striking feature of a HiPIMS plasma is the formation of rotating localized ionization zones (IZs) along the racetrack of the magnetron, so called spokes, at power densities above 1 kW cm−2 [11–16]. The number of spokes decreases with increasing current. They rotate with a velocity of typically 10 km s−1. The appearance of spokes coincides with the presence of a group of ions with increased kinetic energy [13, 17]. It is speculated that the energetic ions are created inside the spokes which are believed to be regions of higher electrical potential [11, 13, 18]. It is difficult to test the hypothesis of a potential hump inside the spoke experimentally, because invasive methods such as probe diagnostics might disturb the spoke phenomenon itself. Up to now, only a decrease in plasma potential in the vicinity of the magnetron outside of the plasma torus, as being expected for a magnetic pre-sheath, is being measured by emissive probes [19, 20]. Non-invasive diagnostics such as passive emission spectroscopy or active laser spectroscopy is difficult as well, since all data have to be synchronized to the spoke rotation or only line-integrated quantities can be measured. Therefore, any conclusion regarding the electrical potential structure in a HiPIMS plasma remains ambiguous. The electron temperature inside a spoke is speculated to be higher, than outside of a spoke due to electrones being accelerated into the spoke [12]. Up to now, no simulations are available which give information about the plasma properties inside the spokes or which are able to model their origin self-consistently. Ion energy mass spectrometry is a powerful tool to evaluate the energy of the species incident on the substrate, but the connection of this energy to the potential structure inside the plasma is an ill-posed problem: a low ion energy, measured at the substrate position, might originate either from the ionization in front of the substrate followed by acceleration in the substrate sheath or from the ionization inside the high potential region of a spoke, but a subsequent deceleration by collisions with neutrals before reaching the substrate. This ill-posed problem cannot easily be resolved. Nevertheless, ion energy mass spectrometry may provide evidence of the potential structure by regarding charge exchange processes: let us assume a doubly charged metal ion  being generated inside a region of higher electrical potential Φ. This ion is accelerated in this electrical potential towards the substrate to an energy of
  (with the elementary charge e). A charge exchange reaction in front of the substrate with a resting metal atom M, would lead to a fast M+ ion with the very same energy
  and a slow M+ ion

A similar reaction would be:

Any elastic collisions between target and substrate broadens the energy distribution functions. However, a finite contribution of ions, which undergo no collisions (or only one charge exchange collision) carry the information about the spatial distribution of the electrical potential. The location of ionization or of charge exchange collision determines the final energy measured at the substrate. If these distinct energies  or
or  become visible in the measured energy distribution function the spatial structure of Φ can be inferred.
In this paper, we address this backwards analysis of the measured IEDFs including charge exchange collisions to corroborate the hypothesis of an electrical potential structure inside the spokes. It is expected that the IZ of a spoke is not homogeneous. Due to an increased electron temperature the ionization state in the most inner part of the spoke is also assumed to be higher than at the perimeter. Therefore, any charge exchange ions originating from  contain information about the most inner part of the spoke, whereas ions originating from M+ contain information only from the perimeter of the spoke.
2. Experiment
A 2 inch magnetron with a titanium target is used as sputter source. The magnetron is powered by a Melec power supply in average-power limited mode to allow stable operation in the runaway regime. The base pressure is  Pa. Argon 5.0 is used as plasma forming gas at a flow rate of 15 sccm and constant pumping speed. The resulting pressure in the chamber is 0.5 Pa. The pulse length is 50 μs at a repetition frequency of 300 Hz. The duty cycle is
  which allows a safe operation of the water-cooled magnetron. The investigated peak power density range was from 1100 to 3200 W cm–2. Prior the each measurement, the magnetron was operated with the discharge parameters for thirty minutes to ensure a thermalization of the experiment as well as a stable chemical composition of the target surface. The voltage current probe was directly attached to the target.
Time- and energy-resolved mass spectra of positive ions are measured using a HIDEN EQP 300 HE instrument, which is mounted 8 cm away from the magnetron target in line-of-sight to the racetrack. The signals are proportional to mass/charge ratio and energy/charge ratio, respectively. Therefore, doubly charged ions appear as peaks at half of the mass of the parent ion. The mass spectrometer is mounted in a differential pumping stage with a base pressure of 10−8 mbar and a sampling orifice of 50 μm. A multi channel scaler (MCS) is used to store the signal from the secondary electron multiplier of the EQP in sync with the HiPIMS pulsing limited by the sampling rate of the MCS, which is of the order of 100 ns. To acquire sufficient signal intensity, we used a bin width in the MCS of 2 μs, and integrated the temporal evolution of the signal for 9 s at a given mass and energy. A time span of 3 ms was recorded for every single pulse. The energy is scanned in steps of 0.2 eV. These data correspond to a map of signal intensity versus time and energy. By integrating over time, a time averaged IEDF is obtained.
After acquisition of the time- and energy-resolved ion currents, the data have to be corrected in principle for the mass and energy transmission function of the EQP. However, this was omitted, because we regard ions of very comparable mass and energy and analyze the temporal development of the ion fluxes only in a qualitative manner. The synchronization of the IEDF recording with the HiPIMS pulsing, including the time-of-flight in the mass spectrometer, is described in detail elsewhere [13, 17].
3. Results
Figure 1 shows the discharge currents of the measurements. The signals are averaged over 128 pulses. Peak currents ranged from 37 to 100 A with a voltage range from 527 to 574 V. All currents show a small peak in the beginning, at around 7 μs which is caused by an ion acoustic wave traveling from target to mass spectrometer as reported elsewhere [21]. Up to 20 μs the current shows a steep rise, followed by a slower increase for measurements below 3200 W cm–2. The shape of the 3200 W cm–2 current after 35 μs can be explained by averaging of the current changing from pulse to pulse between the runaway regime and the plateau regime.
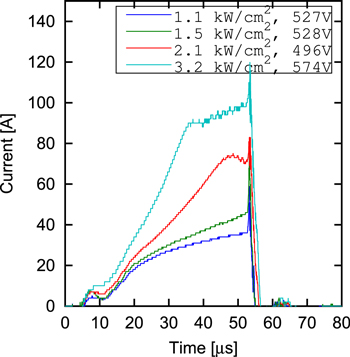
Figure 1. Discharge currents with their according voltages.
Download figure:
Standard image High-resolution imageThe time-resolved energy distributions have been measured for a target peak power density range between 1100 and 3200 W cm–2. The time-resolved data are shown in the
The time-integrated IEDF for Ti+ and Ti2+ at a target power density of 1100 W cm–2 are shown in figure 2. The IEDF consists of two parts, a dominant peak at very low energies of a few eV and a high energy tail following the Thompson distribution, as being typical for a sputtering plasma. In addition, a pronounced peak at around 25 eV is visible for Ti+ and around 56 eV for Ti2+. The energy of the Ti2+ ions is slightly more than twice that of the Ti+ ion indicating, that both species are generated almost at the same electrical potential and are accelerated by the very same electric field. The source of this electrical field is assumed to be the spokes mechanism.

Figure 2. Time-integrated IEDF of Ti+ (upper panel) and of Ti2+ (lower panel) at a target power density of 1100 W cm−2 for a HiPIMS plasma at 0.5 Pa argon gas and titanium target. The energies of the additional peaks in the IEDFs are indicated.
Download figure:
Standard image High-resolution imageThe time-integrated IEDF for Ti+ and Ti2+ at a target power density of 1540 W cm−2 are shown in figure 3. The data are similar to those shown in figure 2. As the peak power density is increased, the intensity of the IEDF also increases. The IEDF of Ti2+ shows a broad peak at around 40–70 eV. A small peak at the very same energy might also be seen in the data for Ti+ indicating a charge exchange collision between an accelerated Ti2+ with a Ti neutral according to equation (1). In comparison to the data for a target power of 1100 W cm−2, the peak energy of the low energy peak for Ti+ is slightly lower and the energy for the Ti2+ peak is slightly higher.
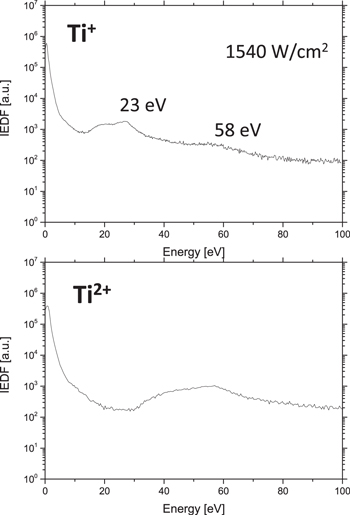
Figure 3. Time-integrated IEDF of Ti+ (upper panel) and of Ti2+ (lower panel) at a target power density of 1540 W cm−2 for a HiPIMS plasma at 0.5 Pa argon gas and titanium target. The energies of the additional peaks in the IEDFs are indicated.
Download figure:
Standard image High-resolution imageFigure 4 shows the time-integrated IEDF for Ti+ and Ti2+ at a target power density of 2050 W cm–2. The IEDFs are similar to the IEDFs taken at lower peak power densities with some deviation. Apart from an increased intensity an additional peak at 90 eV can be seen in the IEDF of Ti+. The peaks in the Ti+ spectra appear very regular with a difference of typically 20–30 eV. One may interpret these peaks as charge exchange collisions of Ti3+ and of Ti2+ with Ti neutrals following equations (1) and (2), as discussed below.
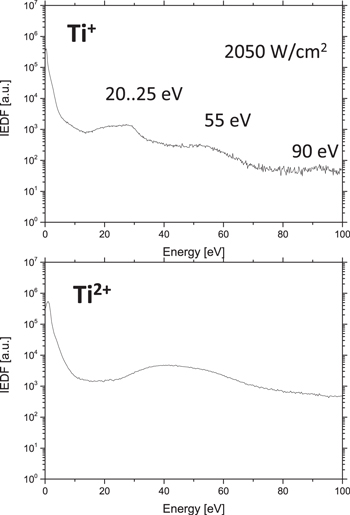
Figure 4. Time-integrated IEDF of Ti+ (upper panel) and of Ti2+ (lower panel) at a target power density of 2050 W cm−2 for a HiPIMS plasma at 0.5 Pa argon gas and titanium target. The energies of the additional peaks in the IEDFs are indicated.
Download figure:
Standard image High-resolution imageThe time-integrated IEDF for Ti+ and Ti2+ at a target power density of 3200 W cm–2 are shown in figure 5. Again the data are similar to the data in figure 2, with the main deviations being an increased intensity and the shape of the Ti2+ IEDF, which does not show a clear peak anymore.
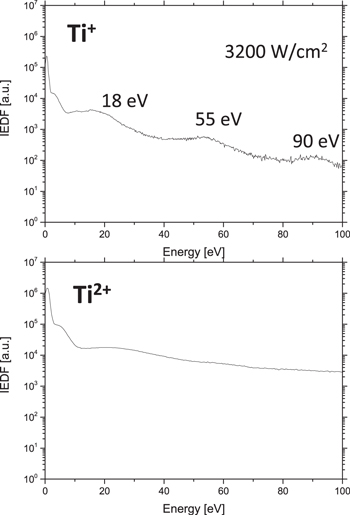
Figure 5. Time-integrated IEDF of Ti+ (upper panel) and of Ti2+ (lower panel) at a target power density of 3200 W cm−2 for a HiPIMS plasma at 0.5 Pa argon gas and titanium target. The energies of the additional peaks in the IEDFs are indicated.
Download figure:
Standard image High-resolution image4. Discussion
The variation of the regular peak positions of Ti+ are summarized in figure 6. The energy of the Ti+ peak with the lowest energy, denoted as solid squares in figure 6, decreases with increasing power density from 25 eV down to 18 eV. The energy of the other high energy Ti+ peaks, denoted as solid circles and open triangles in figure 6, remain almost constant at 55 eV and 90 eV, respectively, with increasing target power density. With increasing power density an increase in the potential hump could be expected due to electron density rising. However, measurements showed that an increase in power density results in an increase in spoke size [22]. We postulate that the high energy peaks originate from the charge exchange reactions according to equations (1) and (2). The origin of the high energy peak itself is the electrical potential structure inside the spoke. If all ions Ti+, Ti2+ and Ti3+ would be generated at the very same electrical potential and if no collisions occur, their energies should scale with the charge state plus the acceleration in the substrate sheath as:

with a typical energy gained in the substrate sheath of  eV, the charge state of the ions Z, the elementary charge e and the height of the potential hump
  of the localized IZ above the plasma potential in front of the substrate. If we assume
  = 25 V, we obtain the dashed lines in figure 6 for the different energy peaks of Ti+ generated by reactions (1) and (2). We can identify a remarkable agreement between data and this very simple model. Nevertheless, there are still small differences, because the energy of Ti+ originating from Ti3+ is slightly higher than predicted, whereas the energy of Ti+ itself is slightly lower than expected.

Figure 6. Estimated energy of the peaks in the IEDFs of Ti+ at varying power target density for Ti+ ions ionized inside the high electrical potential of a spoke (solid squares), for Ti+ ions after charge exchange reactions of Ti2+ with Ti neutrals (solid circles), and for Ti+ ions after charge exchange reactions of Ti3+ with Ti neutrals (open circles). The dashed lines correspond to a simple prediction based on equation (3) for the ion energies according to the charge state of the ions and their acceleration in the potential hump of the ionization zone and the substrate sheath.
Download figure:
Standard image High-resolution imageThe energy of Ti+ originating from charge exchange reactions of higher charged states are not exactly twice or three times the energy of the directly ionized Ti+.
The small differences can be explained by regarding the spatial distribution of the estimated electrical plasma potential of a spoke (inside and surrounding a localized IZ). Figure 7 shows a schematic variation of the electrical potential and electron temperature between target and substrate for different target power densities between low power density in figure 7(a) to a high power density in figure 7(c). The region of the IZ expands towards the substrate with increasing target power density. The expected regions for the formation of predominantly Ti+ (dotted line box), Ti2+ formation (solid line box) and of Ti3+ formation (dotted line box) are also indicated in figure 7. It is straightforward to assume that the electron density is at a maximum inside the central part of the IZ. If we use the normal Boltzmann relation to connect the spatial variation in electron density to the variation of the electrical potential, a corresponding variation of Φ shown in figure 7 results. The use of the Boltzmann relation is only possible for an electron density distribution along the magnetic field lines outside of the magnetic trap. Therefore, this estimated potential and the electron temperature are only plotted from the substrate to the central part of the IZ. It is also expected that the electron temperature shows a spatial variation due to the magnetic confinement of the electrons in the magnetic trap. This is different to conventional non-magnetized plasmas, which show usually a flat electron temperature profile due to the large energy relaxation length in all directions.
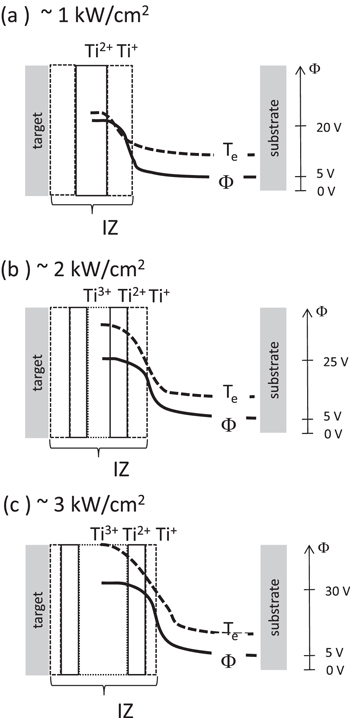
Figure 7. Schematic for the spatial distribution of the electrical potential Φ (solid line) and electron temperature (dashed line) in between substrate and the maximum of the electrical potential in the ionization zone IZ (spoke). The region for predominantly Ti+ formation (solid line box), for Ti2+ formation (dashed line box), and for Ti3+ formation (dotted line box) are indicated. The schematic is shown for increasing target power density from (a) to (c).
Download figure:
Standard image High-resolution imageThe electron temperature determines the equilibrium ratio among the ionization states of titanium, with an increase in electron temperature [6] shifting the equilibrium to higher states such as Ti2+, Ti3+ etc. The electron temperature inside the IZ and especially in the regions of the spokes is expected to be high [12], because the electrons trapped in the magnetic confinement region are heated by the dissipation of the energy of secondary electrons injected into the plasma by the cathode sheath. If we connect the electron density to an electrical plasma potential, as it is postulated for the localized IZs, it is conceivable that the higher ionization states also originate from locations of higher electrical potential. Based on this reasoning, the sequence of the energy peaks of Ti+ with increasing target power density can be explained, as illustrated in figure 7: (a) at low target power density of 1100 W cm–2, Ti2+ is created only in the very central part at almost the same electrical potential as Ti+. Consequently, Ti2+ exhibits twice the energy of Ti+, because both species are accelerated in almost the same electrical field. Charge exchange collisions of these Ti2+ with the neutrals result in the additional peak of Ti+ at higher energies; (b) when the target power density is increased, the central electron temperature and electron density in the IZ increases and Ti3+ starts to be formed in the most central part. The region, where Ti+ is being predominantly formed, however, becomes smaller and is shifted more towards the substrate side. This leads to a smaller contribution of Ti+ ions to the ion flux compared to case (a) and to slightly different energies of Ti3+, Ti2+, and Ti+ according to equation (3), because they are formed at locations of different electrical potential. It should be noted that the Ti2+ ions do not show a decrease in intensity with increasing power density (figures 2–5) but an increase. This is consistent with postulated increase in Te with higher power density. A higher Te shifts the ionization states of Ti to higher values; (c) at very high plasma power densities, the central part of the ionization is dominated by high ionization states and the regions where Ti2+ and Ti+ are formed are shifted even further towards the perimeter of the IZ and also to the substrate side. Correspondingly, the simple scaling of the ion energies with the ionization state needs to be modified depending on the location of ionization. However, the simple scaling as expressed in equation (3) described the different peaks already very well indicating that the electrical potential inside the IZ does not vary too much with increasing target power density. The influence of the electron temperature leading to higher ionization states with increasing target power density seems to dominate the IEDFs. Attempts were performed to model these IEDFs for a given electron density distribution and a local ionization rate by a simple forward calculation including charge exchange collisions [23]. The general nature of the IEDFs can be reproduced, but this models still lacks to fulfill the requirement of quasi neutrality.
It should be mentioned that no charge exchange reactions between Ti and Ar were observed. This may have two reasons, one being that resonant charge exchange between Ti+ and Ar is less probable than the charge exchange between Ti+ and Ti. The other reason can be that it was not possible to see the influences of charge transfer reactions in the Ar+ IEDFs as the high energy part of Ar+ is below the detection limit of the mass spectrometer.
5. Conclusion
IEDFs of Ti+ and Ti2+ have been measured for varying target power densities in a HiPIMS plasma. The observed distinct energy peaks are compared to a simple charge exchange model. Thereby, the height and location of the energy peak can be connected to the spatial distribution of the electrical potential inside an IZ. The height of the potential hump is typically  = 25 V above the plasma potential, irrespective of target power density. This reveals that the electron densities do not vary too much with target power density, whereas the electron temperature increases leading to higher ionization states at higher target power densities. This leads to a layered structure of ionization states around the IZ with the highest ionization states at the most inner part. In the future it will be important to generate more direct data on the electrical potential structure in HiPIMS plasmas.
Acknowledgments
This project is supported by the DFG (German Science Foundation) within the framework of the Coordinated Research Center SFB-TR 87 and the Research Department 'Plasmas with Complex Interactions' at Ruhr-University Bochum.
Appendix
The contour plots of the time-resolved IEDFs for Ti+ and Ti2+ for a HiPIMS plasma with a target power density of 1100 W cm–2 and a pulse length of 50 μs are shown in figure A1. The IEDFs are shifted in time due to the flight time of ions from the target to the mass spectrometer. To determine the time of flight the distance from mass spectrometer to the point of origin of an ion has to be known. As neutrals can be ionized in the magnetic trap region close to the target as well as in the plasma bulk region close to the mass spectrometer, it is hard to determine this distance. Thus the time scale is not corrected for the time of flight. The vertical dashed line indicates the end of the HiPIMS pulse. Low energetic ions are most dominant throughout the pulse as well as in the afterglow. Ions measured in the afterglow result from the detrapping from the magnetic field configuration after the voltage at the target is switched off. During the pulse, the energy of the low energetic ions increases due to an increase in electron temperature with increasing discharge current. An increase in electron temperature during a HiPIMS pulse was shown by Hecimovic et al [6]. The peaks discussed in the results section are marked in the time resolved IEDFs with a horizantal dashed line. At around 25 eV a peak of high energetic ions can be seen for Ti+, which is caused by ions being accelerated in the electrical field of a spoke. This peak appears separated from the low energetic peak at around 5 eV. The peak of Ti2+ at around 56 eV can not be seen in this graph, as the intensity of it is very low compared to the peak at low energies.
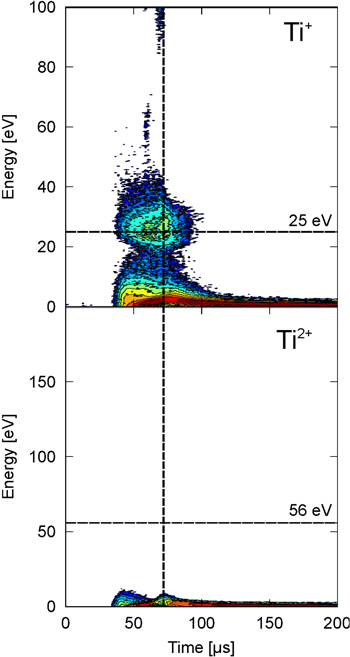
Figure A1. Contour plot for the time-resolved IEDF of Ti+ (top) and Ti2+ (bottom) for a HiPIMS plasma at 0.5 Pa and a target power density of 1100 W cm–2 and a pulse length of 50 μs. The vertical dashed line indicates the end of the HiPIMS pulse.
Download figure:
Standard image High-resolution imageThe contour plots of the time-resolved IEDFs for Ti+ and Ti2+ for a HiPIMS plasma with a target power density of 1500 W cm–2 are shown in figure A2. The 23 eV peak in Ti+ is much more intense than in the previous measurement. An additional peak at around 58 eV can be seen. This peak was correlated to the charge exchange collisions of Ti and Ti2+, which generates Ti+ ions with the energy of the Ti2+ ions. According to the increase in power, the low energetic peak of the IEDF and the peak at 23 eV grew in intensity and thus appear to be connected in the IEDF. The peak at around 40–70 eV in Ti2+ can also be seen in this measurement.
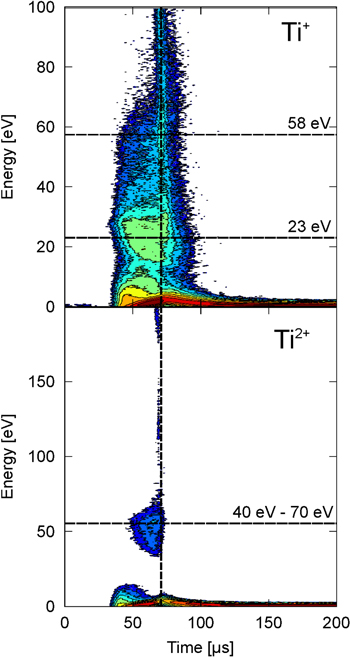
Figure A2. Contour plot for the time-resolved IEDF of Ti+ (top) and Ti2+ (bottom) for a HiPIMS plasma at 0.5 Pa and a target power density of 1500 W cm–2 and a pulse length of 50 μs. The vertical dashed line indicates the end of the HiPIMS pulse.
Download figure:
Standard image High-resolution imageFigure A3 shows the IEDF of Ti+ and Ti2+ for a peak current density of 2100 W cm–2. The energies of the first two peaks of Ti+ decreased to around 20–25 eV for the first peak and to 55 eV for the second one. Additionally to that a third peak is marked at 90 eV. This peak could be seen very weakly in the time averaged IEDF in figure 4. In the time resolved IEDF of figure A3 it is marked but cannot be identified as a peak. The peak of the Ti2+ ions grew in intensity and decreased in energy.

Figure A3. Contour plot for the time-resolved IEDF of Ti+ (top) and Ti2+ (bottom) for a HiPIMS plasma at 0.5 Pa and a target power density of 2100 W cm–2 and a pulse length of 50 μs. The vertical dashed line indicates the end of the HiPIMS pulse.
Download figure:
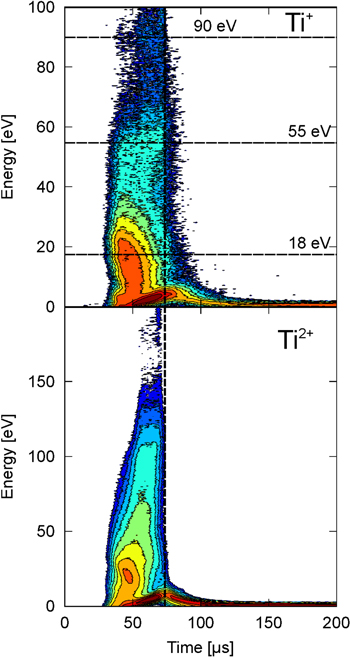
Standard image High-resolution imageThe contour plots of the time-resolved IEDFs for Ti+ and Ti2+ for a HiPIMS plasma with a target power density of 3200 W cm–2 are shown in figure A4. All peaks are more pronounced. The Ti+ peak at 18 eV is at a lower energy than in the measurements with lower peak power density. It appears strongly connected to the low energetic peak of the IEDF. The Ti2+ peak at around 20 eV is also at a lower energy and stronger connected to the low energy part of the IEDF.
Figure A4. Contour plot for the time-resolved IEDF of Ti+ (top) and Ti2+ (bottom) for a HiPIMS plasma at 0.5 Pa and a target power density of 3200 W cm–2 and a pulse length of 50 μs. The vertical dashed line indicates the end of the HiPIMS pulse.
Download figure:
Standard image High-resolution image