

Abstract
Hot vertical displacement events (VDEs) are one of the worst case scenarios for high-current tokamaks as they are associated with large heat loads and electro-magnetic forces. Non-linear magneto-hydrodynamic (MHD) simulations of the thermal and current quench can help to understand their dynamics and consequences. In order to make predictions for future devices, the validation of codes against present machines is crucial. Dedicated experiments were performed in ASDEX Upgrade to provide a basis for simulations with the non-linear extended MHD code JOREK. 2D as well as non-axisymmetric simulations at realistic parameters can reproduce quantities like the edge safety factor q95 at the thermal quench onset, the halo current magnitude and the level of vertical forces, while the exact width of the halo current area requires more sophisticated boundary conditions and is left for future work. Small horizontal forces are observed during the hot VDEs in the experiment as well as in the simulations.
Export citation and abstract BibTeX RIS

Original content from this work may be used under the terms of the Creative Commons Attribution 4.0 license. Any further distribution of this work must maintain attribution to the author(s) and the title of the work, journal citation and DOI.
1. Introduction
Disruptions [1, 2] pose a major challenge for future tokamak power plant operation and need to be either avoided or mitigated, as otherwise the fast loss of thermal energy and the following current quench (CQ) can lead to damage by heat loads and electro-magnetic (EM) forces [2]. Typically, disruptions are accompanied by a loss of vertical stability, called vertical displacement event (VDE), as well as by halo currents that flow through the scrape-off layer (SOL) and the surrounding conducting structures [3]. If the time scale of the motion is faster than the current decay rate and the thermal quench (TQ) is a consequence of the wall contact, the event is defined here as a 'hot VDE'. In this case, large heat loads occur as the plasma core is still at a high temperature and has most of its initial current at the time of the wall contact [3]. Due to the movement and the conservation of toroidal as well as poloidal flux during the CQ, halo currents are induced in the SOL, which close mainly poloidally through the vessel [3, 4]. They can add to the heat loads on the plasma-facing components (PFCs) by Ohmic heating [5, 6] and, together with the eddy currents induced in the vessel, contribute to global and local forces acting on the structures.
Due to kink modes, non-axisymmetric halo currents have been observed, which can lead to horizontal forces. In JET, in particular, a large, long-lasting sideways force has been observed in correlation with a toroidal variation of the total plasma current Ip that is associated with a 1/1 kink mode [7], whereas there is no sign of a large force or toroidal variation of Ip in ASDEX Upgrade (AUG) [8]. The cause of the variation of the plasma current is not fully understood to this moment. One possible mechanism is the sharing of the plasma current with the structures by toroidal halo currents, thus reducing the measured Ip [7]. In an alternative explanation, induced toroidal eddy currents flow through the gaps of the dump plates that are wetted by the displaced plasma and thus made conducting [9]. For ITER, predictions of the magnitude of the horizontal force are still uncertain and vary from a few MN [10] to several tens of MN [11, 12], where also a dependence on the ratio between CQ time and wall time [12] is found. If the rotation of these asymmetries is in the range of the resonance frequency of the structures, it could have severe consequences for the machine safety [13].
Symmetric as well as asymmetric VDEs have been observed in various tokamaks [8, 14, 15] and described in models [4, 16]. In particular, some recent experiments have been focused on the characterization of heat loads and halo currents during hot VDEs [17–20]. There are various axisymmetric codes which have been used to model hot VDEs in order to estimate the EM loads and understand the physics of halo currents like CarMa0NL [21], DINA [22, 23] and TSC [24]. The influence of boundary conditions on the halo width and magnitude has been studied [25], also including the ion saturation current limit [26]. Hot VDE simulations with the non-linear magneto-hydrodynamic (MHD) codes JOREK, NIMROD and M3D-C1 have previously been benchmarked against each other in both 2D and 3D with convincing results [27, 28]. The modeling of hot VDEs is challenging due to the disparate time scales involved from the resistive wall time scale from tens or hundreds of milliseconds to Alfvénic time scales in the order of 10−7 s and the large ratio of parallel to perpendicular transport coefficients. A number of simulations and comparisons to the experiment have been performed [29–32]. However, these simulations are carried out at reduced Lundquist number for numerical reasons and are not always continued through the full CQ phase. In this paper, complete non-axisymmetric simulations of hot VDEs in AUG are performed with the non-linear, extended MHD code JOREK [33] coupled to the EM code STARWALL [34, 35] at fully realistic plasma parameters and including the diamagnetic drift. The results of the axisymmetric and 3D simulations are compared to dedicated experiments in AUG. The paper is organized as follows. First, the experimental setup and the relevant diagnostic systems for halo currents, forces, etc, as well as the experimental observations are described in section 2. The second part begins with a description of the computational model and the parameters in section 3. Then, various scans of 2D simulations are compared to the experimental results in section 4, and finally, 3D simulation results are shown in section 5. This is followed by a discussion in section 6.
2. Experimental setup and diagnostics
Four hot VDE discharges were carried out for this study in ASDEX Upgrade with the goal of obtaining clearly defined and reproducible conditions. The current in the poloidal field coils is frozen at 2.97 s and the magnetic axis is moved downward by 2 cm over a time of 20 ms by the control coils, which are also frozen afterward. Only the central solenoid (OH coil) is still active due to its long reaction time. In previous hot VDE discharges, the PF coil currents still varied during the displacement phase, and thus influenced the axis movement, complicating the study of naturally occurring VDEs.
Another goal is to study the variation of asymmetries, halo current magnitudes and horizontal as well as vertical forces with the plasma current Ip and q95. Therefore, three different values for Ip (800 kA, 600 kA and 400 kA) were chosen at a toroidal field Bt of −2 T. The 600 kA discharge was repeated with a Bt of −1.5 T to obtain the same safety factor as for the 800 kA case. A summary of the parameters can be found in table 1.
Table 1. Main parameters of the hot VDE discharges in ASDEX Upgrade that were performed for this study.
| Shot number | Ip | Bt | q95 |
|---|---|---|---|
| # 39655 | 0.8 MA | −2.0 T | 4 |
| # 39718 | 0.6 MA | −2.0 T | 5.4 |
| # 39720 | 0.6 MA | −1.5 T | 4 |
| # 39722 | 0.4 MA | −2.0 T | 8 |
2.1. Overview of the hot VDE shots
An overview of the evolution of the thermal energy, the plasma current, the vertical position, the edge safety factor q95 and the halo current magnitude Ih is given in figure 1. The initial displacement is triggered by the control coils as described above, but the rate of the displacement differs slightly between the cases. However, the initial growth rate is the same and determined by the resistive decay time of the currents in the structures. Later repetitions of shot # 39655 showed that the time evolution of the axis position can be reproduced with a high accuracy for this setup.
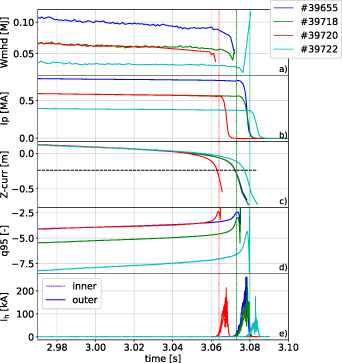
Figure 1. Overview of the hot VDE discharges performed in AUG. The (a) thermal energy, (b) plasma current, (c) vertical current centroid position, (d)  and (e) poloidal halo current evolution is shown. The time of the TQ is indicated by the vertical lines. The horizontal line in figure (c) shows the displacement at which the wall contact occurs approximately.
Download figure:
Standard image High-resolution imageThe safety factor at the edge (q95) decreases with the displacement as the edge plasma is scraped off at constant current [36]. When q95 reaches a value of around −2.5, −3, −2.5 and −4, respectively (the order in the following is according to table 1), fast MHD instabilities trigger the TQ that leads to a small spike in Ip
due to the current flattening. The thermal energy cannot be reconstructed with certainty because it relies on equilibrium reconstruction and is not reliable during disruptions [37]. Instead, the start of the TQ is determined by magnetic signals. The values for the axis position, q95 and thermal energy are obtained from function parametrization [38] based on pre-calculated equilibria, and thus are not fully reliable during disruptions when the plasma is significantly displaced and halo currents are present. The CQ sets in after the TQ with a linear decay time ( ) of 2.83, 4.17, 3.17 and 4.0 ms, respectively. An overview of the main characteristics is given in table 2.
Table 2. The current quench time is shorter for the 0.8 MA discharge due to the larger radiation fraction. The halo current fractions (HF) are comparable, while the halo current asymmetries vary more strongly.
| Case |
 (ms) (ms) | HF (%) | TPF |

|
|---|---|---|---|---|
| # 39655 | 2.82 | 27.6 | 1.50 | 28% |
| # 39718 | 4.17 | 29.4 | 1.62 | 18% |
| # 39720 | 3.17 | 34.0 | 1.68 | 21% |
| # 39722 | 4.00 | 31.4 | 1.98 | 23% |
In order to prevent arcing events during disruptions, resistors are installed in the passive stabilizing loop (PSL) [39], which allow for a net current to form in the upper and lower loops at large toroidal electric fields as they occur during the CQ. The halo current reaches values of up to 250 kA and will be characterized more in detail in the following.
2.2. Halo currents
The diagnostics for halo currents have already been described in [8] and all derived quantities like the halo fraction (HF) and toroidal peaking factor (TPF) are calculated as defined there. The former quantity is the ratio between the maximum poloidal halo current and the initial plasma current, while the latter is the ratio of the largest halo current in one sector to the average halo current. The lower divertor geometry has changed since the paper was published and the updated geometry is shown in figure 2. Shunt measurements are installed in the upper and lower divertors, the heat shield and in the tiles in front of the PSL. As the plasma is forced to move downward, only the lower divertor measurements are relevant. There are four sectors (4, 10, 12 and 14) with complete poloidal coverage with shunts that were used to calculate all figures of merit unless stated otherwise. In sector 4, the measurement is possible at two tiles to assess toroidal variations over a short distance. Seven of the 64 tiles in the lower divertor have been excluded from the analysis due to malfunctioning. Instead, their values are replaced by the data from the closest tile in toroidal direction. At two poloidal positions in the outer (DUAm) and inner divertor (DUIm), toroidal coverage is good with measurements in 10 out of 16 sectors.

Figure 2. As the plasma is forced to move downward, only the lower divertor is considered. A number of divertor tiles in several sectors are equipped with shunt measurements for the halo currents. The names of the divertor parts are given here.
Download figure:
Standard image High-resolution image2.2.1. Magnitude and toroidal distribution.
In the hot VDE discharges considered here, halo fractions of 28%–34% have been reached, meaning that around one-third of the initial plasma current flows through the wall structures. Small halo current magnitudes are measured already during the late phase of the displacement, but the largest values occur during the CQ phase due to the loss of poloidal flux inside the core [4] as shown in figure 3, where the vertical lines mark the times when Ip has decayed to 90% and 10%, respectively. A toroidal peaking factor (TPF) at the time of maximum halo current of 1.5–2 is observed, which is, as well as the HF, in the typical range for AUG VDEs [8, figure 12]. Observations in various machines have found that TPF × HF stays below a limit of 0.74 [40], which is also the case for these experiments. While the HF is similar for the discharges, the TPF varies by 30% in between them as shown in figure 4(a). Spikes in the halo current occur simultaneously with large values of the toroidal peaking factor (see figure 3) during the CQ phase, which is a sign of MHD activity. The discharges # 39720 and # 39722 show the largest TPF over time and simultaneously a large relative spike in the halo currents.
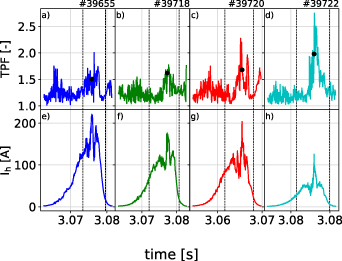
Figure 3. The waveform of the halo currents (e)–(h) is similar in all of the discharges. Only the relative magnitude of the halo current spikes varies, where the larges spikes are correlated with large TPFs (a)–(d). The dot indicates the time of maximum halo current.
Download figure:
Standard image High-resolution image
Figure 4. The discharges with lower plasma current show larger relative spikes in the halo current and also a larger TPF as shown in the overview plot in (a). The halo currents of two tiles with good toroidal coverage indicate a slowly rotating mode for some of the shots. Figure (b) shows the toroidal angle of the sector with the largest halo current for shot # 39655. The moving average is superimposed in red, taking into account the periodicity of the system.
Download figure:
Standard image High-resolution imageWhen taking only the two poloidal positions with almost full toroidal coverage (DUIm and DUAm) into account, the TPF reaches a value of 3. As only a small poloidal area is taken into account here, this value is not relevant for force measurements but allows to better judge the asymmetry. Figure 4(b) shows the toroidal angle of the sector with the largest current for # 39655. From this, a smooth transition of the peak halo current between the sectors can be observed, which is a sign of a mode rotating on the time scale of the CQ. The direction of the rotation varies between the discharges. However, the spikes in the TPF in # 39720 and # 39722 are mostly due to toroidally localized bursts in MHD activity and not the sign of a rotating mode.
2.2.2. Poloidal distribution.
Figure 5 shows the poloidal distribution of the halo currents over time. At the divertor baffle, close to the contact point, the sign of the halo current reverses over time, indicating a shift of the plasma toward the high field side (HFS). As the measurement only shows the integrated values over the tiles, fluctuations and cancellations can occur. The tiles DUIu, DUMi and DUAu lie in the divertor legs (see figure 2), and thus are shadowed from the plasma, leading to less halo currents in this area.
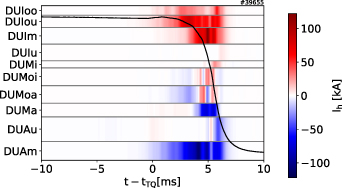
Figure 5. Poloidal distribution of halo current from the inner divertor (DUIx) to the outer divertor (DUAx) for the discharge # 39655. The plasma current in arbitrary units is superimposed as a reference.
Download figure:
Standard image High-resolution imageAs each of the tiles covers a relatively broad area, it is not straightforward to define a halo width. In fact, a sharp drop in the halo current density occurs at the gap in between the heat shield and the divertor as shown in figure 2. The heat shield practically does not carry any halo current in accordance with the previous observation, that over 90% of the halo currents flow into the divertor [8]. In all of the shots, the outermost tiles still have relevant magnitudes of halo current, while there is no halo current in the heat shield. Therefore, the halo current width does not seem to vary strongly with the plasma current, contrary to what was observed before in hot VDE experiments in COMPASS [19].
2.3. Radiation
ASDEX Upgrade is equipped with foil bolometers and diodes in several sectors [41, 42] to measure the radiated energy of the plasma as well as radiation asymmetries. Figure 6 shows the total radiated energy obtained from the foil bolometers at three different toroidal locations during the disruption. It can be seen that significant radiation asymmetries can occur during hot VDEs. A fast camera in sector 16 confirms a melting event, which is responsible for the toroidally localized radiation. The radiated  energy averaged over the three sectors is 0.38 MJ, 0.14 MJ, 0.16 MJ and 0.08 MJ for the four discharges, respectively. This corresponds of a radiation fraction
  varying from 18% to 28% of the total energy, which is lower than previously observed for VDEs in AUG [43]. However, those previous experiments had a larger carbon fraction due to the divertor material. The radiation fraction is defined as follows:
where the thermal energy was taken from the diamagnetic diagnostics, R and a are the major and minor radius, respectively, and li is the internal inductance. The energies at the time of the VDE start are considered. When the time scale of the heating is comparable to the one of the disruption, it has to be taken into account. However, this is negligible in this Ohmic L-mode case.
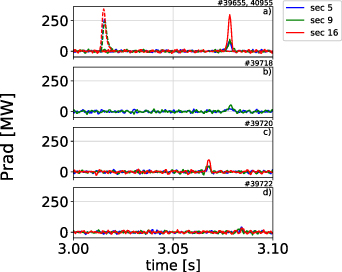
Figure 6. Radiated power measured by foil bolometers in three different sectors (5, 9 and 16) for the four hot VDE discharges and a Neon-SPI mitigated one in the dashed lines for comparison.
Download figure:
Standard image High-resolution image2.4. Energy distribution
The total energy of the plasma ( ) is transferred into radiation (
 ), coupled into the conductive structures (
 ) and conducted into the PFCs (
 ) [44]:

The coupled energy can be calculated from the change of currents in the vacuum vessel [45], where the energy transferred to the PF coil system has been neglected here. A rough estimate of the latter by considering the change of PF coil currents is an order of magnitude smaller than the other energy sinks, without, however, considering the power supply system. The mutual inductance between the plasma and the conductive structures required for  has been calculated with STARWALL by replacing the plasma core with a set of axisymmetric filaments. The calculation is performed for an already significantly displaced plasma to take into account the change of distances to the structures during the VDE, but neglecting the further change in mutual inductance during the TQ and CQ phases. The radiated energy has been shown in the previous section. As the measurements of the heat flux on the divertor were not available, the conducted heat is estimated from the missing energy, which makes up to 60% of the total energy for the hot VDE discharges as shown in figure 7. However, the active coil system and the change of the self- and mutual inductance of the plasma have been neglected in this estimation.

Figure 7. Energy distribution for the four hot VDE discharges. The radiation fraction is around 25% in all the discharges and the coupled energy around 20%, which leaves half of the total energy to be conducted into the PFCs.
Download figure:
Standard image High-resolution image2.5. Forces
The vacuum vessel is suspended by eight rods equipped with strain gauges to measure their elongation [46]. This value can be related to a force by Hooke's law given by:

with ε (µm m−1) being the elongation, E = 200 GPa the elasticity module and A the cross-sectional area of 552 mm2 per rod. However, as the peak of the elongation is delayed with respect to the maximum of the halo and vessel currents, inertia effects play a role. This value can therefore only give an estimation for the real force and a detailed mechanical model of the vessel system would be required for a more realistic result. Additionally, there are measurements of the horizontal and vertical distance between the vacuum vessel at the port location and the supporting structures of the TF coils. The oscillation of the VV, in particular the ports, can thus influence the measurements.
Figure 8(a) shows the vertical force as calculated above for shot # 39722. The vertical force starts with the displacement of the plasma (2.97 s) as eddy currents are induced in the vessel and interact with the magnetic field. In the first steeper phase (2.97 s–2.99 s), the force is due to the variation in the control coils. The force then steadily increases and reaches its peak after the disruption, which is in contrast to the simulation results that will be shown in section 5.4, where the maximum of the force occurs with only a small delay to the peak of the halo currents, indicating that inertia is relevant. Afterward, the sign reverses due to oscillations of the vacuum vessel. The shape of the oscillations is the same for all the discharges, but the amplitude of the maximum scales with the square of the plasma current as shown in figure 9.
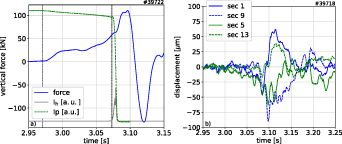
Figure 8. The vertical force of shot # 39722 is shown in (a), where the beginning of the displacement at 2.97 s and the disruption time at around 3.07 s is shown with vertical lines. The plasma and halo current on an arbitrary scale is given for indicating the CQ duration. In (b), the horizontal displacement of the vessel is shown on two opposing sectors, respectively, for shot # 39718, where a small horizontal shift of the vessel can be seen.
Download figure:
Standard image High-resolution image
Figure 9. The vertical force (a) scales with the square of the plasma current, while the horizontal displacement (b) scales with the  .
.
Download figure:
Standard image High-resolution imageThe horizontal movement is smaller and the measurements are influenced by vessel and port oscillations. In opposite sectors, the sign of the displacement is reversed, indicating a small global displacement in the range of 0.1 mm. In the discharges # 39655 and # 39720, the data are noisy, whereas in # 39718 and # 39722 (see figure 8(b)), the signal indicates a measurable horizontal shift. In figure 9, the maximum horizontal displacement is shown ( with dx
and dy
being the maximum of two opposing sectors at each time instant). Thus, the sideways shift increases linearly with Ip
, showing that the TPF alone can only be an indicator at constant plasma current. Based on the calculations in [8], the impulse can be obtained from the maximum elongation by assuming that the period of the horizontal force is much smaller than the vessel damping time. A displacement of 0.11, 0.08, 0.06 and 0.05 mm would correspond to an impulse of 126, 90, 72 and 55 Ns, respectively, and scale thus with
with dx
and dy
being the maximum of two opposing sectors at each time instant). Thus, the sideways shift increases linearly with Ip
, showing that the TPF alone can only be an indicator at constant plasma current. Based on the calculations in [8], the impulse can be obtained from the maximum elongation by assuming that the period of the horizontal force is much smaller than the vessel damping time. A displacement of 0.11, 0.08, 0.06 and 0.05 mm would correspond to an impulse of 126, 90, 72 and 55 Ns, respectively, and scale thus with  according to Noll's formula [47].
3. Model and parameters
JOREK is a non-linear MHD code with a reduced as well as a full MHD model and optional, modular extensions for neutrals, impurities, kinetic particles, etc., as described in [33]. The following results were obtained with the reduced MHD model, not including parallel flows and a single temperature model to reduce computational costs. Also, a simplified impurity radiation model is included in some simulations. The coupling to STARWALL allows the inclusion of conductive structures and active coils for free boundary simulations [34, 35, 48]. The model of the structures in AUG contains the PSL, a simplified 2D model of the vacuum vessel as well as the PF coils without power supply system. The VDE growth rates for the AUG model have been benchmarked against CASTOR before to validate the passive structures [49]. While JOREK has the possibility to construct flux aligned grids, a poloidal grid with 90 radial and 120 poloidal elements is chosen due to the displacement during the VDE. In this work, Dirichlet boundary conditions are considered for the temperature T, the density ρ, the vorticity ω and the potential u. The halo width and magnitude is a result of the electric field and resistivity given by the SOL temperature. Realistic sheath boundary conditions are necessary to evolve the latter fully self-consistently, which is beyond the scope of this work.
The resistivity η is set to the Spitzer value assuming an effective ion charge state  of two consistent with measurements of the equilibrium. A lower limit to η is applied that corresponds to a value of Te
= 1.1 keV. The parallel heat conductivity is the Spitzer-Haerm one with a cutoff at a temperature of around 700 eV for numerical reasons and to take into account the heat flux limit in a simplified way. The values of the resistivity, viscosity and diffusion are listed in table 3. The perpendicular heat and particle diffusion profiles are chosen to obtain approximately constant kinetic profiles when taking into account Ohmic heating as well as a particle source inside the core. To avoid excessive gradients of the temperature, the perpendicular heat diffusion is increased smoothly, when the gradient length decreases to a value of 1 cm [50]. In the following, the results of the axisymmetric simulations are shown, where the methodology of [27] was applied to initiate the TQ. The results of the non-axisymmetric simulations are presented in section 5.
of two consistent with measurements of the equilibrium. A lower limit to η is applied that corresponds to a value of Te
= 1.1 keV. The parallel heat conductivity is the Spitzer-Haerm one with a cutoff at a temperature of around 700 eV for numerical reasons and to take into account the heat flux limit in a simplified way. The values of the resistivity, viscosity and diffusion are listed in table 3. The perpendicular heat and particle diffusion profiles are chosen to obtain approximately constant kinetic profiles when taking into account Ohmic heating as well as a particle source inside the core. To avoid excessive gradients of the temperature, the perpendicular heat diffusion is increased smoothly, when the gradient length decreases to a value of 1 cm [50]. In the following, the results of the axisymmetric simulations are shown, where the methodology of [27] was applied to initiate the TQ. The results of the non-axisymmetric simulations are presented in section 5.
Table 3. Basic parameters of the 2D and 3D simulations. The perpendicular profiles were chosen to obtain a steady state including Ohmic heating and a particle source in the core.
| Name | Parameter | Value | Dependency |
|---|---|---|---|
| Resisitivity | ηcore (Ωm) | 3.2 × 10⁻⁸ | Spitzer, 
|
| Viscosity | µ (kg m−1 s−1) | 3.5 × 10⁻⁷ | Constant |
| par. heat diffusivity |
 (m s−1) (m s−1) | 3.1 × 1029 | Spitzer, 
|
| perp. heat diffusivity |
 (m s−1) (m s−1) | 4.9 × 10¹⁸ | Profile |
| perp. particle diffusion |
 (m2 s−1) (m2 s−1) | 6.9 | Profile |
4. 2D simulation
4.1. Initial drift phase
The VDE is initiated by the virtual position controller in JOREK [49], displacing the plasma by 2 cm in 20 ms with the fast control coils like in the experiment. The resulting coil currents are close to the experimental ones. Afterward, all coil currents are frozen except for the OH coil, which still varies like in the experiment. Only the results of shot # 39655 are presented in this section, but the axisymmetric evolution of the other discharges showed a similar behavior when comparing the results with the experimental observations. The vertical growth rate depends on the initial equilibrium, in particular on the axis position and current profile, as well as on the geometry and resistance of the passive conductors and the SOL temperature. The profile of the latter can be influenced by the parallel and perpendicular heat conduction coefficients, and additionally by the temperature on the boundary of the computational domain. The resulting growth rates of a scan in these quantities for # 39655 are shown in figure 10. A higher parallel or perpendicular heat conduction reduces the temperature in the SOL, so that halo currents are reduced and the plasma moves faster, as it has been studied before [27, 31]. For appropriate parameters, the vertical position evolves consistently to the experiment and also the separatrix shape is consistent with equilibrium reconstructions at different points in time (see figure 11). During the first drift phase, also the PSL current evolution shown in figure 12 evolves with the displacement as the experimental one, showing that the conductive structures are described correctly.
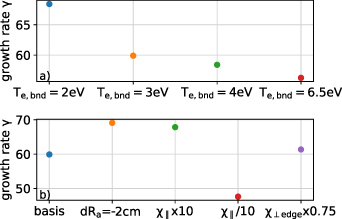
Figure 10. The dependence of the growth rate on different influences is shown. The base case corresponds to the parameters in table 3 and a boundary temperature of 3 eV. The growth rates are sensitive to the SOL temperature, the placement of the conductive structures and the initial position of the axis. Here, dRa is the displacement of the radial axis position of the equilibrium compared to the experiment.
Download figure:
Standard image High-resolution image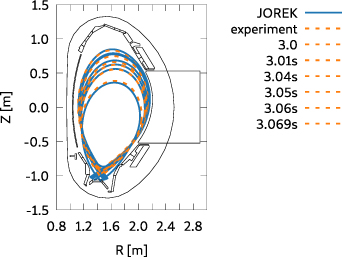
Figure 11. The separatrix outline is reconstructed for several time points until shortly before the disruption. The evolution in the simulation (blue) follows the experimental one (orange).
Download figure:
Standard image High-resolution image
Figure 12. The evolution of the PSL current with the displacement of the magnetic axis  is comparable to the experimental one before the disruption (# 39655). During the current quench, the real PSL can carry a net current in its loops, which is not included in the model used for these simulations.
Download figure:
Standard image High-resolution image4.2. Artificial TQ and CQ
In order to induce TQ artificially in the axisymmteric simulations, the perpendicular heat and particle diffusion coefficients are increased to a constant value that is two orders of magnitude larger than the initial one. Furthermore, the hyper-resistivity [51] is increased to mimic the redistribution of current as it happens during the fast reconnection phase of the TQ. This leads to a spike in the plasma current, due to the conservation of magnetic helicity [52] as shown in the overview of the simulation results in figure 13. After the thermal energy has decreased to around 10%, the perpendicular heat diffusion is decreased to a value of 2 m2 s−1 throughout the domain and the value of the hyper-resistivity is reduced again to a value that does not influence the physical evolution. At the final phase of the CQ, before the last closed flux surface is lost, the latter parameter is increased for numerical reasons, as in reality, MHD activity would lead to a flattening of the current profile, when q95 decreases below a threshold. This will also be shown in section 5.

Figure 13. Comparison of the (a) thermal energy, (b) plasma current, (c) axis and (d) q95 evolution between simulation and experiment (blue) for different minimum values of the parallel conduction.
Download figure:
Standard image High-resolution imageAfter the TQ, Ohmic heating leads to reheating due to the enhanced resistivity by the reduced temperature and the large current density, which leads to the increase in thermal energy shown in figure 13(a). The post-TQ temperature is established by a balance of Ohmic heating, heat conduction and radiation [53], which requires a knowledge of pre-existing impurities, sputtering and realistic boundary conditions. This is, however, beyond the scope of this work. For VDEs, also the vertical growth rate is important which determines the rate of flux surface opening [44] and is linked with the SOL temperature by the halo currents. A colder SOL does not allow for large halo currents and thus accelerates the vertical motion.
Using circuit equations, one can calculate the temperature that is consistent with the observed CQ times:
where L is a matrix of the self- and mutual inductance of the system, I the currents of the plasma and resistive structures and R the resistance matrix of the conductors and the plasma assuming Spitzer resistivity. An estimate of the CQ time  using (5), neglecting the effect of the shrinking plasma cross section, shows that a a temperature in the range of 5–8 eV is expected in order to obtain the same
  as observed in the experiment. A CQ in JOREK with a predefined uniform temperature confirms this result. Neither impurity radiation nor a realistic heat flux is included due to the missing convection and a reduced parallel conduction as a result of the Dirichlet boundary conditions fixing the boundary temperature at a few electron volts, so that in total, the energy loss is underestimated. Consequently, the CQ is ten times longer than in the experiment.
4.2.1. Heat flux dependence.
To estimate the influence of the heat flux, simulations with a minimum value for the parallel conduction have been carried out.  is set to the value corresponding to a threshold temperature
  if the electron temperature falls below this value:

Here,  has been varied in the range of 10 eV–50 eV. Figure 14 shows how
  reduces when increasing the heat flux to the boundary. At the same time, the movement of the current centroid is faster, which leads to a faster reduction of the region of closed flux surfaces and decrease in q95. The integrated heat flux over time varies from 0.44 MJ to 0.53 MJ, which is close to the simple estimation of section 2.4 of 0.68 MJ. Also, the Poynting flux through the computational boundary of 0.38 MJ–0.24 MJ is in the same order as the estimated coupling energy of 0.28 MJ. For a minimum conduction of 50 eV,
  is still a factor of 2 larger. When adding a uniform background radiation as another energy sink (crosses in figure 14(b)),
  can be reduced further. This shows that a realistic heat flux is crucial for modeling the correct SOL temperature and CQ dynamics. Figure 13 shows the thermal energy, the plasma current, the magnetic axis evolution and q95 in comparison to the experiment for different minimum parallel conduction and without background impurity radiation. The halo current magnitude is similar between simulation and experimental measurement and does not vary strongly with the CQ time. Altogether, the evolution of the axis position, q95 and halo current magnitude is consistent with the observations.
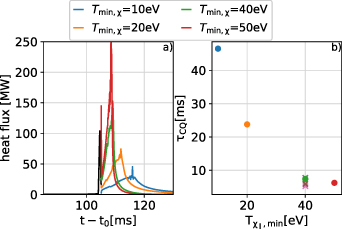
Figure 14. A minimum value for the parallel heat conduction corresponding to a temperature  of 10 eV–50 eV changes the heat flux on the boundary shown in (a) against the time since the VDE start t0 and the CQ time (b). The larger the parallel conduction, the faster the CQ. Additionally, a uniform background impurity density of tungsten or carbon was added to see the effect on the CQ time. These cases are repsented by the crosses.
Download figure:
Standard image High-resolution imageIn other simulations, the resistivity, thus also the Ohmic heating, is increased by a factor of 5 to obtain the same effect, which corresponds to a reduction of the temperature by a factor of 2.9. With the right factor, also the CQ time can be reproduced and the influence on the halo current magnitude or the maximum force is low. The halo fraction varies from 20% to 30% depending on the case. For the case closest to the experimental results, the HF is 26% and the CQ time is 3.6 ms compared to a value of 2.82 ms in the experiment with a HF of 27.6%.
4.2.2. Force calculation.
The vertical force is calculated from the EM stress tensor as introduced in [54, equation (11)]. The order of magnitude is similar compared to the experiment as shown in figure 15, where a force of around 175 kN is reached for # 39655. The forces will be analyzed more in detail in section 5. A variation of the boundary temperature, the perpendicular diffusion profiles and the resistivity lead to a range of CQ times. The shorter the CQ, the more the vertical force is reduced as shown in figure 15 because the vertical moment ( ) of the current decreases.
Figure 15. The maximum vertical force reduces with the CQ time due to the decrease in the vertical current moment  .
.
Download figure:
Standard image High-resolution image5. 3D simulations
As 3D simulations are computationally much more expensive, only the case with the largest current (# 39655) is studied in detail. A recent improvement [55] is used in the TQ and CQ phases, which allows a speed-up of more than 4 in the highly non-linear phase by accounting for mode-coupling in the pre-conditioner. The same model and boundary conditions as described in section 3 are used and a total of five to ten harmonics from 0 to 4 or 9, respectively, are included for non-axisymmetric effects of the VDE evolution. Additionally, the diamagnetic drift effect is included to suppress the tearing modes, which would otherwise form prior to the TQ and which were not observed in the experiment. The initial drift phase is carried out as before and the non-axisymmetric effects do not have an influence on the vertical motion. As described before, the resistivity is scaled by a factor of 5 in some of the simulations after the TQ, and in some cases, a uniform background impurity density is added with a simplified impurity model.
5.1. TQ phase
With the 3D effects now present in the simulations, MHD instabilities arising due to the vertical motion can trigger the TQ self-consistently. The mechanism of the thermal energy loss is described in the following. Like in the 2D simulations, the outer layers of the plasma core are scraped off at almost constant plasma current, resulting in a reduction of the edge safety factor. Furthermore, the current profile steepens at the edge and leads to a triggering of MHD modes. In particular, a 2/1 mode is triggered as well as a smaller, more localized 3/1 mode which can be seen in figure 16. Different to previous observations [28, 31], the mode is not only localized in the edge but reaches into the core. Figure 17 shows how the magnetic topology becomes stochastic starting from the edge, leading to a fast loss of temperature in this region. This becomes evident in the temperature profile in figure 18(a), where the first three time slices correspond to the first three Poincaré plots in the previous figure. As the movement continues, q95 reduces further while the 2/1 mode grows in size (figures 17(b) and (c)) until the core becomes fully stochastic at around 100.64 ms. This increases the rate of thermal energy loss by parallel heat transport along magnetic field lines, which now connect the boundary to the core. This can be seen from the steepening of the slope of the thermal energy loss in figure 18(b).

Figure 16. The temperature perturbation of the (a) n = 1 and (b) n = 2 modes shows a clear 2/1 and 4/2 structure. The time corresponds to figure (c) in figure 17.
Download figure:
Standard image High-resolution image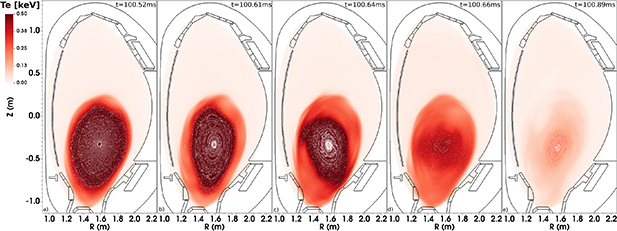
Figure 17. At the beginning, the edge becomes stochastic until more MHD modes are triggered and the whole region becomes stochastic on a time scale of 50 µs.
Download figure:
Standard image High-resolution image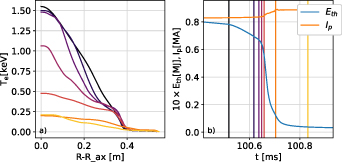
Figure 18. (a) The evolution of the temperature profile and (b) of the plasma current and thermal energy during the TQ is shown. The colored lines in (b) indicate the time slice of the temperature profile. The first three lines correspond to figures 17(a–c).
Download figure:
Standard image High-resolution imageThe TQ takes place on a time scale of  . The temperature flattens to a final temperature of 250 eV as shown in figure 18 as the parallel heat conduction becomes inefficient at lower temperatures due to the
  dependence of
  . After the TQ, the closed flux surfaces reform gradually in the core (figure 17(e)) and a reheating takes place.
5.2. CQ phase
As described in section 4.2, the post-TQ temperature results from a balance of Ohmic heating, impurity radiation and the heat flux at the boundary. The halo current decay is determined by the SOL temperature and contributes to the rate of flux surface opening by the scraping off mechanism. Thus, a small change of the temperature can have a large influence on the CQ time and secondary MHD activity after the TQ. To see the effect of impurities, a scan in tungsten content has been performed varying from 10−5 to 10−3 of the original particle content, where tungsten is included as a uniform background impurity density as the divertor consists of tungsten tiles. In the simplified impurity model used here, the radiation  is given by:

with the uniform impurity density  and, the temperature Te
and density
and, the temperature Te
and density  dependent, linear radiation function
  of the impurity based on ADAS data. The effects of the impurities on ne
,
of the impurity based on ADAS data. The effects of the impurities on ne
,  or η are not taken into account. Furthermore, density has been lost during the VDE and TQ phase due to the boundary conditions, while a constant or increasing electron density is expected due to ionization of impurities. Thus, the radiation is underestimated. Simulations with constant particle content have been repeated, where no large difference in the global dynamics is observed.
Apart from this, the heat conduction is underestimated in these simulations with Dirichlet boundary conditions. Using the Spitzer resistivity and not including radiation or realistic heat fluxes, the CQ time is a factor of ten larger. Thus, a self-consistent inclusion of sputtering and impurity radiation as well as a realistic heat flux is important to perform realistic MHD simulations.
Therefore, a scaling of the resistivity by a factor of 5 is applied as described in section 4, which corresponds to a reduction of the global temperature by a factor of 2.9. Figure 19 shows the evolution of the plasma current and poloidal halo currents in the simulation for two cases with a background impurity density nW of 3 × 10¹⁴ m−3, which is too low to affect the CQ time. In the second case, the resistivity is scaled by a factor of 5, resulting in a faster CQ. It can be seen that the maximum of the halo currents does not vary with the CQ time.
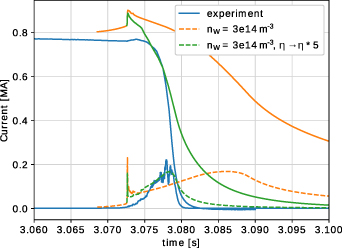
Figure 19. The plasma current evolution with a constant background impurity density of tungsten nW with and without scaled resistivity is shown and compared to the experiment (blue).
Download figure:
Standard image High-resolution image5.2.1. MHD events during the CQ phase.
In the experiments, spikes of the halo current during the CQ phase (see figure 3) are a sign of MHD activity. This is also observed in the simulations. Two cases with different amount of background impurity density are compared in figure 20 as an example. In the case with a tungsten density nW of 3 × 10¹⁴ m−3, the edge safety factor decreases to a value below 2 and stays, however, above unity. While in the other case with nW = 3 × 10¹⁶ m−3, a crash occurs when q95 reaches 2 and q on axis drops below 1, flattening the current profile inside the q = 2 surface and reducing the temperature. As a consequence of the resistivity increase due to the temperature reduction and enhanced by the scaling of η, the temperature recovers fast and a second crash occurs when q95 crosses 2 again. The associated TPFs (figure 23) also behave accordingly. In the case with larger MHD activity, the TPF stays at a higher value for a longer time. On the other hand, in the case with less tungsten, the halo currents become axisymmetric again at the time of largest halo current. While the impurity density is not sufficient to reduce the CQ time, it can influence the MHD dynamics by localized cooling.
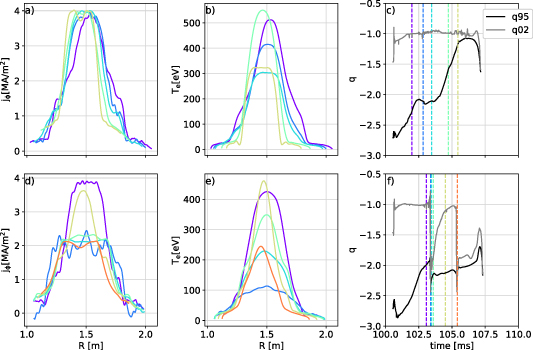
Figure 20. The MHD activity changes with the amount of tungsten. In the first row, a uniform background impurity density of 3 × 10¹⁴ m−3 was introduced. In the second row, it has a value of 3 × 10¹⁶ m−3. For the latter case, a crash occurs when q95 decreases below a value of 2 and q on axis ( ) is around 1, flattening the current profile as shown in figure (d). The vertical lines correspond to the time slices of the profiles in figures (a, b) and (d, e).
Download figure:
Standard image High-resolution image5.2.2. Simulations at low q95.
As described above, reconnection events also take place during the CQ phase, when instability limits are crossed which prevent the decrease in q95 below a value of 2. In order to see the effect of low q95, 2D simulations are continued with a total of five harmonics at a time where q95 is already below unity. A violent reconnection event takes place that increases q95 to a value above 1. The forces do not reach a value bigger than observed in the full 3D simulations, where the crash appears at a larger value of q95. In JET, large sideways forces are usually observed in correlation with a large 1/1 kink mode [45], which does not seem to be present in AUG [8]. The reason for this difference is not yet answered and the question of how to reach q95 values below 2 will be subject for future work.
5.3. Halo currents
The poloidal halo currents in the reduced MHD models are reconstructed from the force balance assumption ( ) and agree well with full MHD models [28]. Note, however, that the calculation of the halo current magnitude differs between experiment and simulation. In the experiment, the average of each divertor side is taken, whereas the axisymmetric halo current magnitude in JOREK is calculated in the following way:
where the absolute of the current normal to the computational domain  is integrated on the boundary. Consequently, the halo current magnitude also includes oscillations on small scales, which are smoothed out in the experimental data. This difference can be seen in figure 19, where the TQ leads to small localized current structures that are not visible in the shunt current signals, but cause a peak of the halo currents in the simulation. However, this does not influence the magnitude during the CQ as the current has a dominant sign on either side of the contact point. Figure 21 shows that the contact point of the plasma with the structures is at the same location between the simulation and experiment, whereas the halo current width in the simulation is larger. These simulations do not contain the detailed geometry of the divertor, which has an influence on the spread of the current. Furthermore, sheath boundary conditions are necessary for a more realistic evolution of the SOL parameters. In particular, the limit on the ion saturation current has an influence on the halo current width [26], but is not accounted for in the present work as this is numerically very challenging in 3D simulations. As the halo current has a similar magnitude as in the experiment, this is not supposed to have a large effect on the global vertical force that only scales with the effective poloidal path leff of the halo currents described by [8]:

However, the halo current width determines local heat loads and forces. Also, the toroidal distribution of the halo currents is of particular interest for the local forces and heat loads.
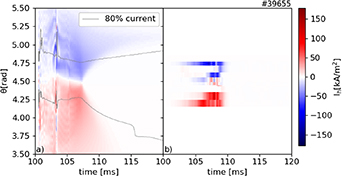
Figure 21. The poloidal halo current distribution in the simulation (a) is wider than the experimental one (b). Eighty percent of the current is contained within the gray lines.
Download figure:
Standard image High-resolution imageFigure 22 shows the toroidal distribution of the halo currents for the case with a tungsten background impurity density nW of 3 × 10¹⁶ m−3 at different times during the TQ and CQ. During the reconnection phase of the TQ, the current distribution shows localized structures, which are not observable by shunt currents that only provide spatially integrated halo currents. In the local measurements by Langmuir probes, however, a spike at the time of the TQ is measured, showing that those currents also occur in the experiment. The TQ is followed by the CQ phase, where a stationary n = 1 pattern develops in the simulated halo currents that is also present in the eddy currents in the wall (not shown here). The capturing of the halo current rotation requires more realistic boundary conditions [31]. The TPF between the experiment and JOREK is comparable, but its evolution depends on the MHD activity during the CQ phase and decays faster (see figure 23).
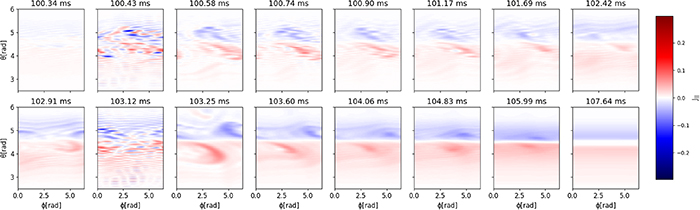
Figure 22. The normal current to the computational boundary in the poloidal and toroidal direction is shown for different times during the TQ and CQ. The current corresponds to the case with nW
of 3 × 10¹⁴ m−3 and  .
.
Download figure:
Standard image High-resolution image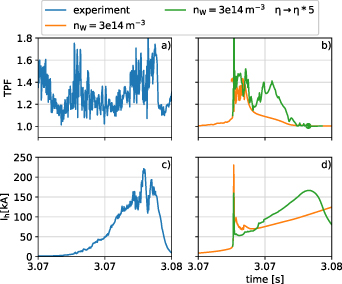
Figure 23. The magnitude of the halo current asymmetry (a, b) as well as their magnitude (c, d) is comparable between experiment and simulation. However, the asymmetric currents decay faster in the simulation. The first spikes are an artifact from the calculation of the halo current in JOREK and is caused by small-scale oscillations during the TQ phase.
Download figure:
Standard image High-resolution image5.4. Forces
It is possible to decompose the force in a halo current and passive structure component [28] by changing the surface on which the stress tensor is computed. Figure 24 shows the evolution of the different components, where the eddy current component also includes the PSL contribution. Here, the halo current force is calculated by placing the integration surface just outside the boundary of the computational domain, while the total force is calculated by placing the boundary outside the vacuum vessel. The contribution from the wall currents and PSL is then obtained by substracting the halo contribution from the total one. The vertical force in the 3D simulation is similar to the axisymmetric simulations due to the fact that it depends mostly on the n = 0 evolution of the plasma. As the inertial effects of the vessel are not included in the model, the peak of the force (figure 24) is not delayed with respect to the maximum of the halo currents and also the vessel oscillations, responsible for the negative peak, are not part of the modeling. During the initial displacement phase starting at 2.97 s, only the eddy currents in the PSL and the VV produce a vertical force. At the time of the CQ, the halo currents are the main contributor to the vertical force because the induced wall currents by the Ip spike during the TQ reduce the eddy current contribution. After the plasma current has decayed, the total vertical force is given only by the wall current contribution which now mainly come from currents induced in the CQ.

Figure 24. The experimental force has a similar magnitude as in the experiment, but occurs with the peak in the halo currents. The force is mainly due to halo currents until the plasma current has decayed and the eddy currents in the wall and PSL become important again.
Download figure:
Standard image High-resolution image
The horizontal force ( ) is two orders of magnitude smaller than the vertical one and not included in the figure. In contrast, JET routinely shows sideway forces in the same order of magnitude as the vertical one [7]. The finding of a small horizontal force in the simulation is consistent with the observation that the horizontal displacement is small in AUG and that the edge safety factor stays above 2 during the CQ phase of the simulation. The impulse of the vessel has been estimated in section 2.5 and is around 126 Ns for the discharge # 39655. The impulse calculated from the 3D simulation is, however, an order of magnitude lower with around 13 Ns, which can be the result of the asymmetries that seem to decay faster than in the experiment and the lack of a kink mode due to the large safety factor throughout the CQ phase. Furthermore, the wall model in STARWALL only considers an axisymmetric wall with isotropic resistivity, so that the wall currents are allowed to flow freely, whereas in reality, the vessel resistivity is not uniform. When estimating a force, the discrepancy is similar. For a statically applied force, a displacement
  of 0.1 mm corresponds to a force of 7.1 kN. The total horizontal force in JOREK is in the order of kN and thus is also smaller.
In addition, the occurrence of the horizontal force in JET is correlated with a toroidal asymmetry of the plasma current [7], which is at the moment not fully reproducible with the current JOREK model as Ip is conserved from toroidal plane to plane as it was shown previously in [28]. The presence of an Ip asymmetry can also not be confirmed in AUG due to the saturation of the poloidal field probes during the disruption.
6. Discussion and conclusion
Four hot VDE experiments have been carried out in AUG in a clearly defined way to provide a basis for simulations with the non-linear MHD code JOREK. During these discharges, large values of the poloidal halo current with a halo fraction of around 30% and of the vertical forces with up to ≈170 kN have been found. The scaling of the halo currents with Ip
and of the vertical force with its square has been confirmed, while the horizontal forces scale like Noll's formula with  . The toroidal peaking factor of the halo currents in the range of 1.5–2 is found to be correlated with spikes in the halo current and local MHD activity.
In contrast to previous results in COMPASS [19], a variation of the halo current width with Ip was not observed. Halo currents are measured in the full lower divertor for all the performed shots shown here, while their magnitude is negligible in the heat shield or in the tiles in front of the PSL. The sharp drop can indicate that the gap between the divertor and the heat shield limits the maximum halo current width. This is, however, not fully understood to this moment.
The energy lost by conduction was estimated from an energy balance including the energy lost by radiation and transferred to the conductive structures. The results indicate that over 50% of the total energy is lost by heat fluxes to the PFCs. The parameters of the hot VDEs found here are in the range of findings of previous AUG experiments [8, 43], with the difference that the radiated energy fraction is decreased with respect to the former reference due to the different divertor material.
For the first time, non-axisymmetric simulations of hot VDEs at realistic parameters and including the diamagnetic drift have been carried out for AUG. It was shown that the global parameters, like the vertical movement, the halo current amplitude, the value of q95 at the TQ onset and the vertical force, can be reproduced well with these simulations. However, the CQ time depends on the final temperature and thus on the heat flux to the PFCs and impurity radiation. The main energy sink is given by conduction into the PFC structures, where the power deposition is determined by the heat conduction in the SOL and the vertical motion. A scan of the heat flux in the 2D simulations by an enforced lower threshold on the parallel conduction showed that the CQ time reduces with increasing heat flux. At a value corresponding to 50 eV, the total conducted energy is in the range of the estimated value from the experiment and the CQ time is reduced to 5 ms. A self-consistent model of the SOL temperature would require realistic boundary conditions as well as impurity radiation, which will be the focus of future work. Also the halo width from the experiment could not be recovered as it depends on the SOL physics and divertor geometry.
In these hot VDE discharges, impurity radiation can explain 20%–30% of the total energy loss and should therefore be taken into account. However, a fully consistent inclusion would require the knowledge of the species and magnitude, which is beyond the scope of this work. The inclusion of tungsten as a background impurity in small quantities showed a change of MHD activity, while the global evolution was not influenced significantly. The resistivity was scaled globally in some of the simulations included in this manuscript to mimic the effect of the lower temperature, while radiation and heat conduction would act mainly in the SOL, accelerating the VDE due to faster decay of the halo current. This is not supposed to influence the global vertical force or halo current magnitude, as the latter does not vary strongly with the CQ time.
While a link between MHD activity and the toroidal asymmetries of halo currents is shown, it was not possible to reach a low safety factor ( ) during the CQ in the 3D simulations. MHD relaxation events that flatten the current profile prevented q95 to even reach a value below 2, unless the core plasma current has decayed already to a low value. In JET, the large horizontal force is associated with a 1/1 kink mode and would therefore require a low safety factor. The conditions to get to low q95 values during hot VDEs will be the interest of future studies, where a key role is presumably a larger, more realistic heat flux that reduces the SOL temperature. While the vertical force is in accordance with the experimental results, the horizontal force was found to be one order of magnitude smaller in the simulation. This can be both due to the large values of q95 that prevented a kink mode to form and also the asymmetry of the vacuum vessel contributes to compensate the force by the halo currents.
Acknowledgments
This work has been carried out within the framework of the EUROfusion Consortium, funded by the European Union via the Euratom Research and Training Programme (Grant Agreement No. 101052200—EUROfusion). Views and opinions expressed are, however, those of the author(s) only and do not necessarily reflect those of the European Union or the European Commission. Neither the European Union nor the European Commission can be held responsible for them.
This work was partially carried out using EUROfusion High Performance Computer Marconi-Fusion through EUROfusion funding.
This work was partially carried out using supercomputer resources provided under the EU-JA Broader Approach collaboration in the Computational Simulation Centre of International Fusion Energy Research Centre (IFERC-CSC).
ITER is the Nuclear Facility INB No. 174. This paper explores physics processes during the plasma operation of the tokamak when disruptions take place; nevertheless, the nuclear operator is not constrained by the results presented here. The views and opinions expressed herein do not necessarily reflect those of the ITER Organization.
Data availability statement
The data cannot be made publicly available upon publication because no suitable repository exists for hosting data in this field of study. The data that support the findings of this study are available upon reasonable request from the authors.