

Abstract
A new method for studying the thermalization and transport of injected impurities at the edge of hot plasma, (considering the last closed magnetic surface, the free path is between 1 and 2 cm approx.) under no perturbative conditions, is presented. In the proposed technique, a Nd:YAG laser is used to ablate Li from the lithiated wall of the stellarator TJ-II. While the laser pulse allows for the analysis of the released species through laser induced breakdown spectroscopy (LIBS), its laser pulse also provides a time reference for the time-of-flight (TOF) measurements of the Li+ ions performed. This is done by positioning light detection systems sensitive to an intense Li II spectral line at different toroidal locations away from such a source. TOF times of tens to hundreds of microseconds are recorded. Then, by de-convolving the shape of the recorded light pulse, the velocity distribution of the lithium-ion during its thermalization with the background plasma can be extracted. From this velocity distribution, the ion temperature of the background ions and the toroidal rotation at the plasma periphery can be deduced. In contrast with conventional Doppler spectroscopy, this technique uses filter-scope detectors rather than high-spectral-resolution spectrometers thus a tradeoff between spectral and time or space resolution is required. Finally, preliminary results of the application of this novel technique are shown to validate this proof of principle.
Export citation and abstract BibTeX RIS

Original content from this work may be used under the terms of the Creative Commons Attribution 4.0 license. Any further distribution of this work must maintain attribution to the author(s) and the title of the work, journal citation and DOI.
1. Introduction
The measurement of ion temperatures with good spatial resolution at the periphery of fusion plasmas is much more challenging than for their electronic counterpart. While a wealth of techniques exists for evaluating electron temperature, Te, at the edge and scrape-off layer (SOL) of magnetic confinement plasma, ion temperature, Ti, diagnostics have been limited to the retarding field analyzer (RFA) [1] and the ion sensitive probe [2], both of which are susceptible to degradation and are highly sensitive to alignment errors as well as to model assumptions. On the other hand, passive spectroscopy with sub-Doppler resolution [3] can provide line-integrated Ti values if a good signal-to-noise ratio is achieved and no anomalous velocity components exist, which is not the case in many instances [3, 4]. In contrast, using a different approach, Pitcher and Stangeby measured the toroidal dispersion of a thermal He beam source to validate the recorded ion temperatures in a He plasma [5]. Since ion–ion collisions are the dominant term in the heating of impurities (typically born with kinetic energies of a few eV) along field lines at the relatively highly collisional plasma boundary, the direct rate of thermalization of these impurities with the background species, rather than the local ion temperature value, represents a figure of merit for many simulations.
In some previous works made on the stellarator TJ-II [6, 7], the He/He+ line ratio method was successfully tested as a diagnostic for Ti measurement in the plasma boundary region of this device. When combined with the traditional He line-ratio technique and a suitable Collisional-Radiative model [8], it allows microscopic edge plasma parameter profiles to be obtained, i.e. Ti, Te, and ne. However, the presence of plasma rotation as a drift term for the locally generated He ions represented an important setback and complicated the interpretation of the diagnostic [7]. Although several methods for the measurement of Ti at the edge of TJ-II have been tried (RFA, He beam, Doppler spectroscopy...) no systematic recording of this important parameter has been achieved so far. In contrast, the injection of a well-localized source of lithium, both in position and in time, opens up the possibility for transport studies in the periphery of such magnetic confinement plasmas. Such a source can be generated using laser-ablation as ablated Li is ionized rapidly on entering the plasma and thereafter transported along magnetic field lines. It should be noted that although the experimental set-up is very similar to the set-up of the laser blow-off technique used on the TJ-II [9], detection is focused principally on the first ionized state of the injected impurity. For this, Li light monitors are located at different toroidal positions around the device. It is considered that, during the toroidal displacement of the injected lithium, collisions with plasma particles lead to rapid ionization of the Li atoms and thereafter to rapid thermalization of the resultant cold Li+ ions. This equilibration process can be followed by time-of-flight (TOF) measurements using monitors located at different distances from the source. For this, light sensitive detectors with narrow bandpass filters are used. In this way, the resultant signals can be analysed to extract the parameters of interest.
The goal of this work is to demonstrate the viability of following the toroidal propagation of Li ablated by laser ablation off the inner vacuum vessel wall of the TJ-II device. It should be noted that lithium coatings are regularly applied to the inner surfaces of its vacuum chamber. When compared with other candidate atomic elements, lithium offers several positive benefits as a probing species. In particular, in TJ-II a lithium coating is regularly applied to the hardcore wall in this device to achieve improved density control. Moreover, re-deposition of lithium by the plasma ensures a constant supply of this element at the same location when performing repeated measurements. This simplifies the experimental set-up here. In addition, its low Z and mass result in negligible contamination of the plasma as well as good mass matching with main plasma species (D, T, He) used in TJ-II, the latter enabling fast thermalization with the background plasma. According to neoclassical theory, maximum energy and momentum transfer via inelastic collisions are obtained for particles with equal mass. A good mass matching implies fast thermalization of the injected lithium. Thus, the Ti value of the impurity ions transported along the plasma is constant, having reaches the plasma particle background Ti value almost immediately Moreover, being a low recycling species, only directly injected atoms will be probed by the detector. Since the amount of background Li in TJ-II plasmas is significant, a well localized injection (in time and space) is important to discriminate laser injected Li from sputtered Li and thus perform these measurements. Sputtered lithium continuously enters the plasma. Such a source does not allow synchronizing Li and Li+ signals to extract the TOF values of interest here, (this will be discussed in more detail later).
In addition, the large difference between the first and second ionization potentials results in a long dwelling time for the Li+ ions, hence, only local transport away from the injection point has to be considered as loss term at edge relevant parameters. The impurity has to dwell into the plasma long enough for full thermalization with the background plasma before being lost by imperfect confinement. Here, a long dwelling time signifies that the time for Li+ to be ionized to Li+2 is long compared to thermalization times with background plasma and to expected TOF values.
In this work, which is performed on the stellarator TJ-II, the technique is described from first principles and examples of its use for studies of edge ion temperature and toroidal rotation are given. Basic aspects of the application of this new method to other fusion devices and possible challenges are also addressed.
2. Background
When low-energy ions are introduced into plasma, they undergo Coulomb collisions with electrons as well as with main plasma ions and impurities. This leads to their full thermalization provided that the residence time within the plasma is long enough to allow for sufficient collisions. The rate,  at which the laser induced breakdown spectroscopy (LIBS) injected impurity thermalizes with background (hydrogenic) plasma ions is given by the neoclassical expression [10]:
where C is a constant, ne is the electronic plasma density, Mimp and Zimp are the main-ion mass and charge of the injected impurity respectively, m is the hydrogenic mass, ln Λ is the Coulomb logarithm, also assumed constant here, and Ti is the plasma ion temperature. It should be noted that if the injected impurity temperature is assumed to be much smaller than the Ti, (Ti mp≪ Ti), then the rate is maximized when Mimp = m. If a Maxwellian distribution function of velocities, v, f(v) is assumed for the thermalized ions:
where Ti is ion temperature, m is ion mass, and kB is Boltzmann's constant. The distribution function f (v) can be converted into the distribution g(TOF) by changing the variables in the velocity expression using the Jacobian matrix of partial derivatives [11]. Here, TOF refers to time-of-flight. Then the transformation of the f(v) distribution to a g(TOF) distribution, where TOF = v/l, leads to:

By differenciating the function g(TOF), we find that it peaks at
For data analysis, it is convenient to define a function h(u), where  as:
as:
So far, it has been assumed that ion velocity is determined solely by the thermalization process. However, if the contribution of the toroidal plasma rotation is considered, the observed velocity, vx, would be formed by 2 components, one due to ion rotation (vrot) and the other to the thermalization velocity (vt herm) contribution, hence vx is given by:

Consequently, the corresponding g(TOF) function, in terms of the TOF, can be written as:
Equation (7) shows a maximum at:

These equations are applied to the TJ-II, a four-period heliac-type device [12] in which the experiments described in this work were performed. As an example, figure 1(a) shows the evolution of TOF simulated traces for Li+ ions (equation (3)) for a toroidal travel distance of l = 2.33 m (from sector A1, where laser ablation is performed, to sector A8, where a Li+ monitor is located, see figure 2). Note: ion propagation along TJ-II magnetic surfaces is considered when determining this l [13]. In the simulations in figure 1(a), no toroidal rotation is considered for Li+ ion temperatures between 10 eV and 45 eV. In contrast, figure 1(b) shows the effect of toroidal rotation on the TOF trace for Ti = 30 eV (see equation (7)). Here, a negative vrot corresponds to anti-clockwise rotation from the injection point in figure 2 to the monitoring point, while a positive vrot corresponds to a clockwise rotation in the same figure 3.
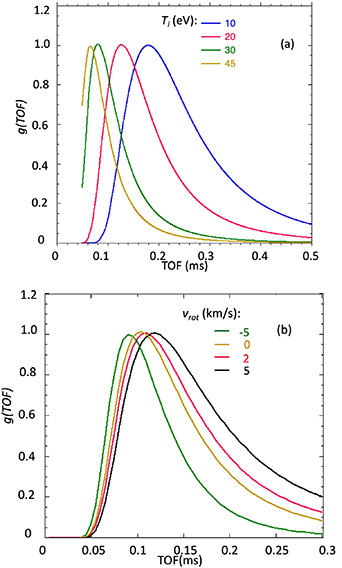
Figure 1. (a) Simulation of the TOF distribution function g(TOF) (equation (3), without vrot) for Li-ion temperatures between 10 eV and 45 eV and a toroidal distance of 2.33 m between a Li source and a Li+ monitor. (b) Simulation of the TOF distribution function g(TOF) for different toroidal rotation values (equation (7)) for a fixed Ti of 30 eV.
Download figure:
Standard image High-resolution image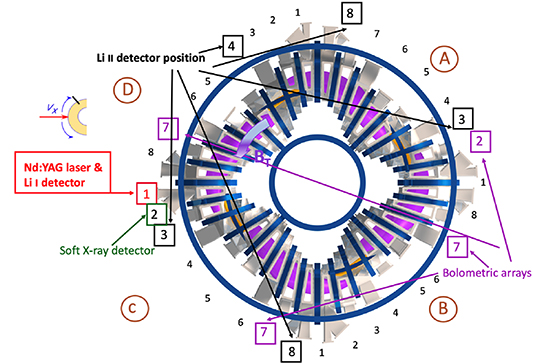
Figure 2. Bird's eye sketch of the TJ-II sectors showing the Nd:YAG laser injection point, the x-ray and bolometry detection systems and the different positions of the Li monitor (sectors A3, A8, C3, C8 and D4). A more detailed scheme for the Nd:YAG laser experimental set-up will be presented in figure 3.
Download figure:
Standard image High-resolution image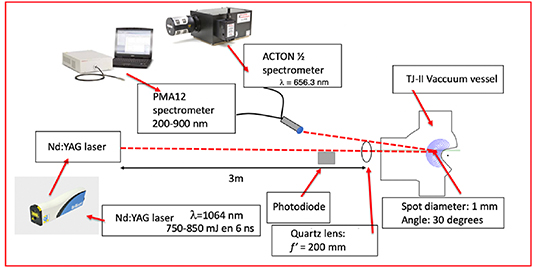
Figure 3. Experimental set-up located in sector A1 of the TJ-II (see figure 2) that is used to ablate lithium off the hardcore wall and to monitor a line emission from neutral lithium.
Download figure:
Standard image High-resolution image3. Experimental
The experiments reported here were performed in the TJ-II, a four-period, low-magnetic-shear stellarator with major and average minor radii of 1.5 m and ⩽0.22 m, respectively [12]. For these experiments, plasmas were generated using hydrogen as the working gas in the standard TJ-II configurations and heated using electron cyclotron resonance heating (ECRH) operated at the 2nd harmonic of the electron cyclotron resonance frequency (ν = 53.2 GHz, PECRH < 600 kW). This gyrotron is coupled to the plasma by means of a quasi-optical transmission line and up to 250–300 kW of power can be injected in X-mode at densities up to 25 W cm−3. No auxiliary heating was provided. As a result, central electron densities and temperatures up to ne (ρ = 0)  0.7 × 10¹⁹ m−3 (measured by a microwave interferometry) and Te (ρ = 0)
  0.6 keV (by electron cyclotron emission (ECE) monitors), respectively, were obtained, (ρ is the normalized effective radius). In the TJ-II plasma discharges are sequentially numbered.
A 6–8 ns pulse from a Nd:YAG laser (750 mJ) is used to ablate lithium off the inner wall of the vacuum chamber. Table 1 summarizes the main experimental parameters. Thin layers of lithium are deposited regularly on the inner walls of this chamber in order to improve plasma control [14]. The poloidal cross-section of the plasma is kidney shaped with strongest plasma/wall interaction in the region called the hardcore. The laser is focused through an optical vacuum viewport in sector A1 to a ∼1 mm spot size on the surface of the hardcore, at a position just above the central coil vertical position, using a quartz lens with f' = 900 mm which is located outside the vacuum chamber at 3 m from the laser (see figure 3).
Table 1. Experimental parameters.
| Working gas | Hydrogen |
|---|---|
| Injected heating power | ECR: ν = 53.2 GHz |
| Power heating | <600 kW |
| Line averaged electron density (interferometry) |
ne (ρ = 0)  0.7 × 10¹⁹ m−3 0.7 × 10¹⁹ m−3
|
| Central electron temperature (ECE) |
Te (ρ = 0)  0.6 keV 0.6 keV |
| Magnetic field on-axis | 1 T |
| Nd:YAG laser energy | 750 mJ |
| Nd:YAG laser pulse length | 6–8 ns (single pulse: one pulse per discharge) |
| Nd:YAG laser wavelength | 1064 nm |
To understand this LIBS process, several consecutive phases can be differentiated: Firstly, the laser beam is focused on the wall of the vacuum chamber. Later, a laser pulse creates a micro-plasma, by ablating the outer layer of the wall, which propagates in the opposite direction to the propagation direction of the laser beam. This creates a micro-crater in the material (this phase is known as rupture). Consequently, the laser energy is captured in part by the chemical species that make up the wall, whose elements are excited, creating a plasma. During the expansion phase of the micro-plasma, a continuous emission spectrum is produced. Finally, the emission of this radiation causes a cooling since the chemical species lose energy through the emission of discrete spectral lines where the desorbed elements can be identified. Neutral lithium is first present in the local ablation micro-plasma. Since the plasma produced by LIBS expands, if there is hot plasma in the vicinity of this ablation plasma, the neutral LIBS plasma can penetrate through the closed magnetic field surfaces and come into contact with the hot plasma. The particles at the edge of the plasma, in particular the electrons, impact on the LIBS plasma inducing ionizations, and once partially ionized this plasma (or plasmoid) expands toroidally in both directions along the magnetic field lines as occurs with solid hydrogen pellets injected into TJ-II [15]. As this lithium plasmoid expands toroidally along the field lines collisions occur with plasma particles (particularly electrons) that thermalize the initially cold Li+ ions. Although the thermalization time competes with the TOF, for a first approximation, we assume that Li is ionized (2.5 μs), thermalized, and then propagated along the field lines. When this process reaches equilibrium, and the ions are thermalized, measurements of the TOF can be carried out. This consists of recording the temporal evolution of the intensities of a neutral Li emission line (Li I) in sector A1 and of a Li+ emission line (Li II) in other sectors, that is, at different distances from the source, as indicated in figure 2. Then, by analysing the evolution of the Li I and Li II emissions until ion thermalization occurs, TOF measurements can be obtained which will allow Ti to be deduced for the plasma periphery region, thereby resulting in a novel technique. The ablation of lithium and its subsequent displacement can be seen by following the evolution of neutral and singly ionized Li line emissions [16], the latter at different toroidal distances from the ablation location. During their toroidal transport, collisions with plasma particles thermalize the initially cold Li+ ions. Moreover, the use of monitors located in different machine sectors of TJ-II allows TOF measurements to be determined for a range of distances, l, as shown in figure 2, for instance, in sectors A3, D4, A8, C8, C3, where l = 0.67, 1.67, 2.33, 2.90, and 4.64 m, respectively [12].
For TOF measurements, a photomultiplier (PMT) detector (model R3896 by Hamamatsu, Japan) fitted with a suitable narrowband transmission filter (full width at half maximum = 1 nm, center wavelength = 548.5 nm, model 010FC10-50/5484, by Andover Corporation, USA) is used to follow Li II emission at 548.5 nm [17]. In addition, to follow neutral Li emissions in sector A1, a ½ m focal length spectrometer (ACTON Spectra Pro 500, Princeton Instruments, USA) with a PMT detector (H9305-04 Hamamatsu, Japan) is used (see figure 3). It is set to 670.7 nm, the wavelength of the resonant Li I emission line [17]. In addition, a broad wavelength range spectrometer (PMA-12 by Hamamatsu, Japan) collects radiation between 200 and 900 nm to provide a global view of plasma emissions, and x-ray monitors (AXUV detectors & Al/C filter) and bolometers (naked or unfiltered AXUV detectors), that collect global plasma radiation, are used to support the experiments. Finally, a light-sensitive photodiode located in sector A1, which collects scattered laser emission, permits precise timing of the laser pulse to be obtained.
4. Results
A representative TOF trace is displayed in figure 4(a). Here, the experimental TOF is the time difference between ablation of the Li I and the Li II (Li+) arrival time signals for l = 2.33 m, i.e. the distance travelled along field lines from sectors A1 to A8. Several features are apparent from this figure. First, a sharp peak with a 13 μs full-width at half-maximum, is observed in the Li I emission. This corresponds to the Li ablation at 1100.26 ms along the discharge. Next, a peak is seen in the Li II emission at ∼0.9 ms later. This second peak is significantly broader than the Li I peak. Next, figure 4(b) shows some representative plasma signal traces together with the chord-averaged line density. As can be seen, there are no detectable perturbations in plasma density, Hα signal and outer electron temperature, as shown by ECE traces for the normalized minor effective radius, ρ = 0.64 and ρ = 0.75, during a 40 ms time window after injection, i.e. non-perturbative conditions are fulfilled.

Figure 4. (a) Temporal evolution of Li I (blue open squared markers) and Li II (red open circled markers) signal at the injection port in sector A1 and at l = 2.33 m toroidally away from it (sector A8), respectively, plus a fit (green line) to the latter assuming Ti = 25 eV for TJ-II plasma discharge #50 073. (b) Temporal evolution of line-averaged electron density (blue), Balmer Hα emission in sector C4 (green open squared markers), and electron temperature at ρ = 0.75 (red) and ρ = 0.64 (orange open dots).
Download figure:
Standard image High-resolution imageA fit to the Li II signal for Ti = 25 eV is made in figure 4(a). This fit is made using equation (8) for TOFmax. While excellent agreement is observed in this plot between 50 and 160 μs, fit values are systematically lower than experimental Li II values for longer TOFs. This becomes more evident if the Li II signal is plotted using the function h(u) defined in equation (5). See figure 5. In this case, a straight-line provides a good fit to TOFs values between 70 and 160 μs, with a slope corresponding to Ti∼ 26 eV, in good agreement with the previous value. However, for values outside of this range, a deviation from expected behaviour predicted by equation (3) is apparent. At TOF values shorter than 70 μs (right side of the figure) a straight-line fit yields a lower Ti value. Since a rapid rise of the Li II signal is observed at the onset of the trace in figure 4(a), under-sampling by the detector analogic-digital converter partly contribute to this, although other physical processes may also contribute significantly (see below). In contrast, for TOF values above 160 μs (left side in the figure), a fast rise of h(u) is observed and values of Ti ⩽ 5 eV would be deduced from a similar fit. In this time range, the Li II signal merges with the background signal and therefore this type of analysis becomes less reliable. Indeed, a possible contribution from a slower and colder tail in the velocity distribution, coming from the SOL region, cannot be ruled out as radial discrimination is not possible with the current detector geometry, and a neutral lithium cloud encompassing a fraction of the minor radius can be generated by the laser ablation process. Only by properly selecting the flux surface to be monitored with a suitable detection geometry could this issue be tackled. Efforts in this direction are presently underway.
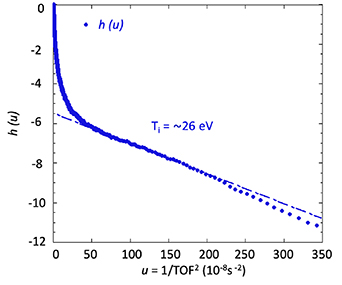
Figure 5. Plot of h(u) from equation (5) versus u = 1/TOF2 for the Li II signal plotted in figure 4(a). A straight line fit is made to the central section of this data assuming that Ti = ∼26 eV.
Download figure:
Standard image High-resolution imagePossible modifications to lithium traces induced by toroidal plasma rotation are analytically described by equation (6). The largest expected change occurs in the location of the Li II signal maximum. The effect of such rotation is to displace the light peak in time, i.e. to shorter TOF values when rotation is negative and to longer TOF times when positive (see figure 1(b)). Thus, the contribution of negative or positive toroidal plasma rotation is to yield apparent Ti values that are higher or lower, respectively, than the true experimental ones. Moreover, the width of the distribution is also affected. For instance, a negative rotation leads to a narrower TOF distribution while a positive rotation broadens the same distribution. Simulations of distorted distributions are plotted in figure 6(a) and compared to a Li II signal recorded for an ECRH plasma, for ne∼ 6 × 10¹⁸ m−3, made with He as the working gas. As shown, several combinations of Ti and vrot are used to fit the distribution. In contrast, a simple thermal distribution with a higher ion temperature, Ti= 40 eV, and no plasma rotation (as deduced from TOFmax = 1100.35 ms as displayed above) yields a significantly broader TOF trace.

Figure 6. (a) An experimental Li II light signal trace (dark blue) as a function of time after laser ablation for TJ-II shot #50 063 (sector A8) with fits made using equation (7) for a range of ion temperature (Ti) and toroidal rotation velocity (vrot) combinations. (b) Plot of h(u) for the fittings used in (a).
Download figure:
Standard image High-resolution image
When choosing suitable combinations of Ti and vrot for such a fitting, consistency with the location of the maximum of g(TOF) is required. Thus, the relationship given above can be reformulated as 1/TOFmax (see equation (8)), where positive or negative values of the rotation velocity can appear. This boundary condition has been used for the selection of the fitting curves shown in figure 6(a): for instance, Rapisarda et al [18] measured toroidal vrot of −8 km s−1, using C III emissions at the plasma edge of TJ-II. In contrast, in a separate work [19], the same authors measured, using He II emissions, positive vrot of 5 km s−1 in regions closer to the plasma core, (for TJ-II plasmas heated with ECRH and with similar averaged plasma densities). Here, as seen in figure 4(b), the combination of Ti = 18 eV and vrot = −13 km s−1 provides a good fitting to the data within the experimental uncertainties. Alternatively, a combination of Ti = 25 eV and vrot = −10 km s−1 could also be a valid solution. Another way to justify the incorporation of toroidal plasma rotation in the TOF distribution is equation (5). In the absence of rotation or other components in the distribution, a linear fitting in the h(u) plot should be obtained, as seen in figure 5. However, deviations from linearity are expected in the presence of rotation. This is clearly seen in figure 6(b) where different fittings are made with suitable Ti and vrot combinations. As shown, all possible solutions provide a linear fit with the right slope within a given interval of the abscissa at lower times. However, bending of the h(u) function towards lower values at longer TOF times, as experimentally observed, provides evidence of negative toroidal rotation. Conversely, bending of the curve upward indicates positive rotation, which, unfortunately, is hard to distinguish from the presence of a low Ti tail in the TOF distribution. Similar results are observed for these detectors, with maxima at the times predicted by equation (8). For these measurements, we had only one detector/filter set available to us. Nevertheless, these measurements were not obtained simultaneously, they were obtained on a shot to shot basis. This was moved from one sector to another when performing tests. An upgrade of our technique would consist of employing several detectors, located in the different sectors, to measure the Ti with different flight lengths for a single injection. This would strengthen this technique.
5. Discussion
The method proposed here relies on several simplifications which may not be fulfilled in some instances. Perhaps the most obvious of these is the assumption that Li ions, generated by laser injection and subsequent electron impact ionization of the corresponding neutrals, are instantaneously thermalized with background plasma. In a hot magnetic confined plasma, ablated Li atoms are ionized quite rapidly compared to the TOF times of interest here. With a 1st ionization potential of 5.41 eV and an ionization-rate of 9 × 10⁻¹⁴ m3 s−1 for Te (edge) < 30 eV [20], the ionization time is expected to be of the order tion ≈ 6 μs for ne (edge) < 2 × 10¹⁸ m−3 [21]. The resulting Li+ ions are subsequently transported along field lines. During this process, ionization to Li2+ by electron impact (the ionization potential is 75.64 eV) together with thermalization with the main plasma species takes place. However, the ionization time is significantly longer for Li+ ions, i.e. ≈2.5 ms for an ionization-rate of 2 × 10⁻¹⁶ m3 s−1 [20], for the same plasma conditions, this being much longer than the transit times recorded here. Thus, although the technique is based on TOF measurements and the amplitude of the Li+ light pulse is secondary (as long as it is above the noise level), the lifetime of the Li+ ions sets the range for TOF values (and hence the distance from the laser injection port) of practical use in an experimental device. Thus, the thermalization of cold ions with initial temperature, Ti0, with the plasma background can be described by the expression: Ti
(t) = Ti0
[1 −exp(−t/τt
herm)] [22] where the characteristic thermalization time, τtherm is given by the inverse of the thermalization rate,  as defined in equation (1). Even when good mass matching between the plasma particles (H, He) and lithium exists, thus fostering a quick thermalization between the injected and plasma species, the thermalization process is not instantaneous and part of the time from the injection to the detection locations is transited at a continuously increasing ion temperature of the, initially cold, Li ions. Although this effect can become minor for large source to measurement separations, it is necessary to consider this effect for locations where the Li II emission is still above detector noise levels, i.e. at short distances. Only estimates of the thermalization time are possible as the impurity content and their ionization state at the plasma edge will strongly accelerate the thermalization process. Thus, for example, for an ion plasma temperature of Ti= 25 eV and an edge electron density ne = 2–4 × 10¹⁸m−3, the thermalization time for Li+ in a pure H plasma is ∼100 μs. This time is drastically reduced in the presence of impurities, such as Li2+ ions (according to equation (1)) (the ionization potential for Li+ is 75.64 eV according to NIST [17] and therefore the contribution of these Li2+ ions could be a negligible fraction for the considered radii). So, in any case, the deduced ion temperatures may be considered as a lower limit, and testing the technique at different distances from the source could provide a full picture of the thermalization process, including the background plasma composition.
Finally, it is necessary to consider the initial thermal energy of the injected lithium atoms. It is known that laser ablation generates suprathermal atoms, with kinetic energies that depend on the mass of the ejected atom, as well as other species, (ions, excited neutrals and clusters [23]. For Li, a velocity ∼8 km s−1 was measured for laser blow-off ablation with the same Nd:YAG laser off a LiF layer [24], which will result in a penetration of a few centimeters in the TJ-II plasma edge, although the kinetic velocity may not necessary be the same for LIBS. Aside from limiting the use of the LiLA-TOF diagnostic to ion temperatures above a few eV, a radial spreading of the Li+ source can result in a blending of different flux tubes sampled by the detector, and hence, multiple TOF components. This could explain the presence of a low Ti tail in the present experiments, indicating the presence of a Ti gradient near the plasma boundary [7].
The detector set-up here used also imposes some limitations on the accuracy of the measurements. The sampling rate, at 100 kHz, limits reconstruction of the fast signal rise at the onset of the Li+ trace. Also, the fact that the injected Li trace has a non-zero-time width implies some convolution of the signal at short times. Both limitations will especially affect the location of the maximum of the TOF trace and fitting of the data to the function given in equation (5) should always be chosen as it provides a more accurate Ti value.
As described above, plasma toroidal rotation has a direct impact on the shape of the TOF trace. The values of vrot between −10 and −13 km s−1. (However, the edge toroidal rotation values typically found in TJ-II are ⩽−10 km s−1, thus the Ti= 25 eV would appear to be more credible) and associated ion temperatures deduced from figure 6 are in good agreement with previous measurements in TJ-II by RFA (17–21 eV in the SOL) [25]. However, an independent, more accurate estimate of vrot and Ti would be only possible by simultaneously recording the lithium traces at two toroidal locations, on opposite sides of the injection point whenever available. Work on the required improvements of the diagnostic addressed so far is in progress in TJ-II.
6. Conclusion
An original technique to measure Ti and vrot at the periphery of fusion plasmas has been developed. The viability of injecting Li using LIBS and recording the lithium traces of the plasma-generated Li+ ions to study ion toroidal, and, consequently, deducing the TOF by means of its propagation has been demonstrated. The preliminary values of Ti and vrot deduced are consistent with those measured with other diagnostics in TJ-II. The present limitations have been identified and steps oriented at the improvement of the new diagnostic are in progress.
Acknowledgments
This work was funded by the projects from the Spanish Ministerio de Ciencia e Innovación RTI2018-100835-B-I00 (MCIU/AEI/FEDER, UE) and PID2020-116599RB-I00.
Data availability statement
The data that support the findings of this study are available upon reasonable request from the authors.