

Abstract
Investigation of helicon wave heating and current drive (CD) in toroidal plasma has been carried out with the ray-tracing code GENRAY. The wave trajectories, profiles of power deposition and driven-currents are presented. It is shown that increasing the poloidal launch angle does not change the absorption rate of the wave, but moves the peak of the wave deposition toward the plasma core. Wave frequencies in the range of our interest (460 MHz ∼ 480 MHz) do not change the absorption of the wave. Under low parameter plasmas, we find that both the peak position and magnitude of the wave power deposition are dependent on the launched parallel refractive index n||. With increasing the refractive index, the driving efficiency first increases and then decreases. The parallel refractive index figure of merit for mid-plane launching in HL-2M configuration is 3.2. With high plasma parameters, both the position and magnitude of the driving current are weakly dependent on n||. The magnitude of the driven current is determined by both the absorption rate and the value of ξe, which is related to n||. It is also demonstrated that driven current increases with increase of the core plasma temperature and decrease of the core plasma density. The plasma ohmic current seems do not significantly affect the helicon CD efficiency, but moves the driven current toward the plasma core region and narrows the width of the driven current profile. In addition, the preliminary calculations including scrape-off-layer (SOL) suggest that the power absorption rate loss in SOL is about 5%–20%. These results provide a reference and theoretical basis for the design and construction of HL-2M helicon wave system.
Export citation and abstract BibTeX RIS
1. Introduction
It is generally believed that fast waves can be divided into two different types of branches: one has a frequency in the range of ion cyclotron frequency, which is what we usually called 'fast wave'; the other has a frequency far above the ion cyclotron frequency and approaches the lower hybrid frequency, we usually call it 'helicons', 'whistlers' or 'fast wave in the lower hybrid range of frequencies'. The ray of fast wave ends with absorption on ions at the ion cyclotron resonance layer, while the ray of helicon wave ends with complete absorption on electrons [1]. Helicon wave heating has been proposed as a particularly attractive means for plasma heating and current drive (CD) in the high beta plasmas [2]. The importance of helicon wave for CD was first realized through ARIES reactor studies [3]. Although helicon CD has not been tested experimentally, the current calculation results show the effectiveness of using it to drive current [4–6]. Therefore, heating and driving current with helicon wave become an important method for the next generation of tokamak, such as ITER, CFETR, and K-Demo [7, 8].
For helicon, it has two important physical aspects: one is to slow down the radial speed in trajectory of the wave, and the other is to increase the damping rate comparing with the lower frequency fast wave. At present, a series of numerical calculations have verified the high efficiency of the helicon CD, no matter results are calculated by the ray tracing code GENRAY using the Ehst-Karney formulation, the Fokker-Planck code CQL3D includes quasi-linear effects, or the full wave code AORSA [8, 9]. In order to obtain the CD capability of helicon in a specific configuration, R. Prater et al [4] and S. J. Wang et al [10] have calculated the helicon CD for DIII-D and KSTAR configurations respectively. The helicon CD in both the DIII-D and KSTAR is being prepared for the next stage of operation.
Theoretically, the GENRAY/CQL3D calculations show that helicon wave propagation is not so chaos as fast wave, and the damping rate is strong. The kinetic effect as well as the effect of dc field is also investigated on DIII-D and EAST [11]. With the quasi-linear code, the results in [11]. indicate that the quasilinear effect is not negligible. This confirms the importance of nonlinear effect of RF waves with high injected wave power. At present, some particle-in-cell (PIC) simulation codes have extended their capabilities to study these RF wave propagation and their nonlinear interactions with plasmas. Using both fluid and PIC methods, [12] studied the nonlinear effects (such as parameter decay instability) of wave in slab configuration, the results show that there are similarities between parameter decay instability scenarios observed on the Alcator C-MOD experiments and PIC simulations. A. Kuley et al have studied the linear physics of lower hybrid wave (LHW) and ion Bernstein wave in cylindrical geometry [13] as well as in toroidal plasma [14]. The GTC code has also been verified for the linear and nonlinear electromagnetic simulation of LHW [15, 16]. All those preliminary studies indicate that for wave heating and CD, the extension of the PIC simulation code will provide a basis for the study of the effects of toroidal geometry, electromagnetic effects, nonlinear dynamic effects, nonlinear ion Landau damping, and parameter decay instability. Here, because our paper focuses on wave heating and CD with lower injected power, we still use the WKB approximation method without considering the nonlinear effects of helicon waves.
Simulations on FNSF-AT show that at same wave injection power, helicon CD efficiency that is at least 50% higher than that of the best ECCD. The difference of the wave trajectories and absorption character between fast wave, LHW and helicon wave are also presented [1]. Recently, C. Lau et al have studied the helicon wave CD in both DIII-D and ITER with the full wave code AORSA. They focus on the simulations including the scrape-off-layer (SOL), and show that high SOL densities could lead to significant helicon wave power loss (∼10%–20%) in the SOL [6, 17]. In the K-DEMO configuration, GENRAY is used to calculate the performance of the helicon wave drive current. The results show that when the wave frequency is 1–2.5 GHz in this configuration, a driven current of 55–70 kA MW−1 can be obtained. The simulation results also show that the CD efficiency and deposition location of the wave depend weakly on the frequency and the launching position [18]. On the spherical tokamak VEST, JongGab Jo et al used the full wave finite element solver COMSOL to study the coupling between high harmonic fast waves and plasma [19]. Besides, N. Bertelli et al also have performed modeling of HHFW heating with National Spherical Torus Experiment (NSTX) equilibria. Their results show that in the presence of NBI, the absorption of fast ions may be dominant, hence there is a clear competition between electrons and fast ion absorptions [20]. Hence, even though the above calculations have been performed, there are still issues, like the n|| dependence, CD efficiency sensitivity on plasma parameters, and plasma Ohmic current, need to be elucidated, especially the work of calculating the helicon wave CD using the ray-tracing code with the SOL module has not been reported.
In experiments, the NSTX has explored the HHFW heating and CD. The experiments with HHFW have achieved fNI ∼ 0.65 with Prf = 1.4 MW in a Ip = 300 kA plasma (shot 138 506), using a wave of toroidal mode number kϕ = −8 m−1 (CD phasing) [21]. Recently, a deuterium H-mode discharge with a plasma current of 300 kA, an axial toroidal magnetic field of 0.55 T, and a calculated non-inductive plasma current fraction of 0.7 has been obtained in the NSTX with 1.4 MW of 30 MHz HHFW heating and CD. One quarters of the non-inductive current was yielded directly by HHFW power inside a normalized minor radius ∼0.2 [22]. It should be noted that the frequency of HHFW in NSTX is much lower than the 'helicon' or the 'fast wave in the lower hybrid range of frequencies' studied here, and the characters of them are much different. The HHFW in NSTX refer to the convention fast wave in ion cyclotron frequency range, which has frequency ∼7–11ΩD, ΩD here is the gyration frequency of the deuterium. The helicon wave we refer to has frequency of ∼50ΩD.
In sum, helicon CD becomes a new and significant way of RF CD due to its efficient CD capability. Moreover, this CD efficiency is much higher in high beta plasmas because of the fact that the ratio of the imaginary part to the real part of the wave number (damping per unit wavelength) increases for higher values of harmonic number and beta as βω/Ωi. On the other hand, the HL-2M is designed to be a tokamak with high beta plasmas. The design of the HL-2M uses the advantages of a detachable toroidal field coils to improve the experimental flexibility of studying high-performance plasmas, thereby exploring the technical and engineering potential of ITER and future fusion reactors [23]. In order to obtain high performance plasma, the RF systems in HL-2M will also be upgraded. A LHCD system of 4 MW and an ECRH system of 8 MW, are currently under installation. Helicon wave system is also being designed due to its high CD efficiency [24–27]. Therefore, helicon wave was proposed as a particularly attractive mean for plasma heating and CD in HL-2M.
In this paper, we systematically simulate the helicon wave propagation, absorption, and CD in HL-2M, and investigate the sensitivity of driving capability to plasma parameters. We find that the poloidal launch angles do not change the absorption rate of the wave, but increasing of the poloidal launch angle moves the peak of the wave deposition towards the plasma core. For the first time, we have shown that the wave frequencies in the range of our interest (460 MHz ∼ 480 MHz) do not change the absorption of the wave. When we further increase the wave frequency, no desired strong absorption will be observed. Under low-parameter plasmas, we find that both the peak position and magnitude of the wave power deposition are dependent on the launched parallel refractive index n||. With increasing the refractive index, the driving efficiency first increases and then decreases. The parallel refractive index figure of merit for mid-plane launching in HL-2M configuration is 3.2. With high plasma parameters, both the position and magnitude of the driving current are weakly dependent on n|| . The magnitude of the CD is determined by both the absorption rate and the value of ξe, which is related to n||. The driving current increases with increase of the core plasma temperature and decrease of the core plasma density. The preliminary calculations including scrape-off-layer (SOL) suggest that the power absorption rate loss in SOL is about 5% −20%. In addition, to our surprise, the plasma ohmic current seems do not significantly affect the helicon wave CD efficiency, but moves the driving current position toward the plasma core region and narrows the width of the driving current profile.
The rest of this paper is organized as follows. The GRNRAY code is introduced and the parameters of HL-2M are presented in section 2. In section 3, we report the results of numerical study for helicon wave heating and CD in HL-2M configuration. Brief conclusions are given in section 4.
2. GENRAY code and the parameters of HL-2M
The helicon wave is absorbed directly through electron Landau damping (EDL) and transit time magnetic pumping (TTMP). The condition for TTMP/ELD resonance is  , where
  is the wave frequency, k|| is the parallel wave number, and v||e is the electron velocity parallel to magnetic field. In warm Maxwellian plasmas, the wave damping in plasmas with electron density ne and electron temperature Te is given by
where k⊥ is the perpendicular wave number and k⊥i is its imaginary part, ξe = v||/vte = c/n||vte, where v|| is the phase velocity of the wave parallel to the magnetic field, c is the speed of light, vte =(2kTe/me)1/2 is the electron thermal speed, and n|| is the parallel refraction index. k⊥ is given by
here,  33 = Y(ωpe/ω)2, Y = 2
  [1 + ξeZ(ξe)], Z(ξe), S, D, and the G in equation (1) can be found in [4].
In our calculations, we use GENRAY to calculate the helicon wave CD. GENRAY is a well-known ray-tracing code, and has been verified with other international tracking programs, such as TORAY [28], TORBEAM [29], GRAY [30] and C3PO/LUKE [31]. GENRAY calculates the ray-tracing equations in cylindrical coordinates:
Here we use the cylindrical space coordinates R= (R, ϕ, z); R is the radial coordinate, ϕ is the toroidal angle, and z is along the vertical axis. N = Kc/ω =(NR, M = RNϕ, Nz). In the code, the poloidal injection angle, β, is defined by measuring counter clockwise from the mid-plane at the low field side, where positive and negative angles are above and below the plane, respectively. The toroidal injection angle, α, is measured counter clockwise around the z axis. ω is wave frequency,  is the dispersion function calculated with cold plasma approximation [32].
By solving the above equations, the wave propagation in space can be obtained. Then, along the wave propagation trajectory, we obtain the deposition of wave power in the plasma by the following formula:

Among them, P(0) is the initial incident power, l is the vector directed parallel the trajectory, k is the wave number, and Im (k) is related to Im (N⊥), which is the imaginary part of perpendicular refractive index. The driving current can be obtained from this relation:  . The current-driving efficiency is calculated using the asymptotic formulas [33].
The HL-2M tokamak parameters are as follows [34, 35]. Plasma major radius R = 1.78 m, minor radius a = 0.65 m, plasma current IP= 1.0 & 2.0 MA, plasma elongation κ = 1.87, triangularity δ = 0.45, and the toroidal magnetic field Bt = 2.2 T. The scenarios of the two single-null diverted HL-2M equilibria, shown in figure 1, were constructed with the EFIT code [36]. β in figure 1 refers to the poloidal injection angle. The density and temperature profiles are expressed with empirical formula as following,
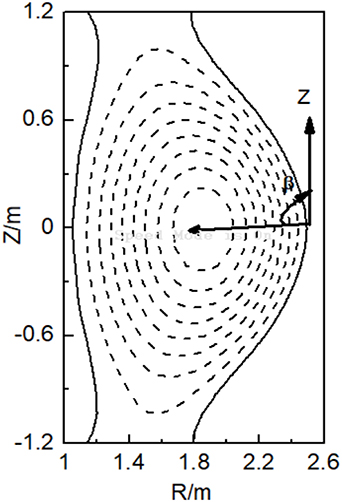
Figure 1. HL-2M scenario, with Ip = 1.2 MA, the toroidal field is 1.8 T. β is the poloidal launch angle, which is measured counter clockwise from the mid-plane at the low field side.
Download figure:
Standard image High-resolution imagewhere nec and nea are the core and edge electron densities, respectively, Tec and Tea are the core and edge electron temperatures, respectively, the i = 1 and s = 1/2 are the empirical indexes. We set nec = 4.0 × 10¹⁹ m−3, nea = 1.5 × 10¹⁹ m−3, Tec = 4 keV, Tea = 0.05 keV. The effective charge Zeff = 1.8 with a flat profile is assumed. In the calculations, according to different studying cases, we will adjust the plasma core density and temperature exponentially.
3. Numerical results
3.1. Helicon wave power absorption and current drive
We first use GENRAY to calculate the heating of the plasma by the helicon wave. For the heating calculations described here, a cone of 30 rays with 1 MW Gaussian power distribution is launched from the outboard plasma. The total power absorption and the normalized radial position ρr of the power absorption peak versus the launch angle for f= 480 MHz, 476 MHz, 472 MHz, and 460 MHz are shown in figure 2, where ρ is the square root of the normalized toroidal flux. We can see that the total power absorption as well as the peak of the wave deposition do not depend sensitively on the wave frequency in the range of our interest (460 MHz ∼ 480 MHz), based on the availability of klystrons at that frequency range. As we continue to increase the frequency of the wave, desired strong absorption will not be observed. This is mainly because the value of ξe increases with the wave frequency and weak damping occurs with large ξe. Figure 2 also shows that the poloidal launch angle cannot change the absorption rate of the wave, but increasing the poloidal launch angle can move the peak of the wave deposition towards the plasma core. It should be noted that the fact that the power absorption rate in figure 2(a) is less than 100% at some points is because of the numerical error. The power absorption rate of the helicon wave increases to 99% when the number of rays is increased. In order to maintain the consistency of the given input parameters, here we still give the power absorption rate that calculated with a cone of 30 rays. This phenomenon can be attributed to the geometric space. Because of the whistle-like nature of the waves, the helicon wave rotates toward the magnetic axis, and the radial position of the emission point at the high launch point is smaller than the radial position of the emission point at the mid-plane. Waves are usually absorbed at similar propagation distances. As a result, the wave is absorbed at the position closer to the center of the plasma when launched at high altitudes.

Figure 2. Total power absorption rate (a) and normalized radial position ρr of the power absorption peak (b) versus launch angle for for f = 480 MHz, 476 MHz, 472 MHz, and 460 MHz.
Download figure:
Standard image High-resolution imageRay data are represented here. Figure 3 is GENRAY calculated helicon wave trajectories, and the power along the ray path with the plasma parameter, nec = 4.0 × 10¹⁹ m−3, Tec = 4 keV. The displayed trajectories show the characteristics of the helicon wave propagation. The color in the wave trajectories indicate the normalized absorption rate, which can be used to give the position where the wave is mainly absorbed. The position of the wave power deposition is heavily dependent on the initial n||. For all the three cases, the power absorption rate of the wave reaches 99%. Figure 4 is the same case as figure 3 but with plasma parameter, nec = 6.4 × 10¹⁹ m−3, Tec = 8 keV. We can see that the wave is absorbed within a short distance with high plasma parameter. Later, we will find that this is because of that the local plasma parameter ξe = v||/vte reaches a smaller value earlier. The design of HL-2M includes the discharge configuration of 1.2 MA and 2.0 MA. The appearance of the weak single pass absorption area is mainly shown in figure 3, because the plasma parameters we give are low. In contrast, due to the relatively high plasma parameters, the weak single absorption phenomenon in figure 4 is not so obvious.
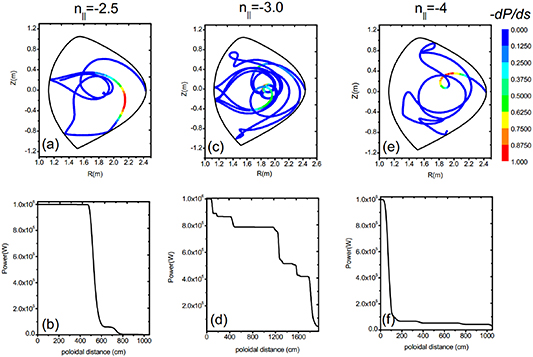
Figure 3. (a), (c), (e) helicon trajectories; (c), (d), (f) the ray power along the ray path. The plasma parameter is nec = 4.0 × 10¹⁹ m−3, Tec = 4 keV.
Download figure:
Standard image High-resolution image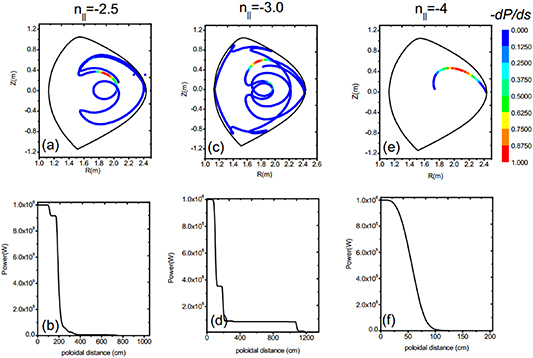
Figure 4. (a), (c), (e) helicon trajectories; (c), (d), (f) the ray power along the ray path. The plasma parameter is nec = 6.4 × 10¹⁹ m−3, Tec = 8 keV.
Download figure:
Standard image High-resolution imageThe total power absorption rate and the radial position ρr of the power absorption peak versus the parallel index of refraction for different plasma parameters, namely, nec = 6.4 × 10¹⁹ m−3, Tec = 8 keV and nec = 4.0 × 10¹⁹ m−3, Tec = 4 keV, are shown in figure 5. With low plasma parameter (Tec = 4 keV), in the low n interval, the absorption rate is sensitive to the parameter n||. The absorption peak tends to move to plasma core with increasing of n||. With high plasma parameter (Tec = 8 keV), the absorption rate does not depend on the n||, and reaches 99% for all the cases. The change of the position of absorption peak with n|| does not show regularity, and two absorption peaks appear in some cases. The relationship between wave absorption and n|| will be analyzed in detail in the following section with ray data information. Another notable phenomenon here is that the CD appears to be mostly peaked closer to on-axis in some cases. This is mainly due to the relatively low plasma parameters we adopted. The off-axis driven current is achieved when high plasma parameters are used. Figure 6 shows the helicon wave trajectories and the corresponding driven current profile under different plasma parameters. We can see that at higher plasma parameters (nec = 6.4 × 10¹⁹ m−3, Tec = 8 keV), the peak position of the helicon driven current profile is ρ ∼ 0.7, while at lower plasma parameters (nec = 4.0 × 10¹⁹ m−3, Tec = 4 keV), the peak position is ρ ∼ 0.18. This phenomenon is mainly because of that the lower temperature reduces the main coupling with the electrons. So in this case, the wave is fully absorbed only when it is closer to the magnetic axis. From the panel of wave trajectories, we could also find that in plasmas of higher temperature, waves are absorbed near the plasma edge. These simulation results are consistent with the calculation results in [10] and the discussion in [13]. In our calculations, roughly speaking, the lower-parameter plasma refers to that the core plasma temperature and density are lower than nec = 4.8 × 10¹⁹ m−3, Tec = 6.4 keV, respectively; while the high-parameter plasma refers to that the core plasma temperature and density are higher those values.

Figure 5. Total power absorption rate (a) and normalized radial position ρr of the power absorption peak (b) versus the parallel refractive index for different plasma parameters, namely, nec = 6.4 × 10¹⁹ m−3, Tec = 8 keV and nec = 4.0 × 10¹⁹ m−3, Tec = 4 keV.
Download figure:
Standard image High-resolution image
Figure 6. Helicon wave trajectories and profiles of driven current for different plasma parameters, namely, (a), (b) nec = 6.4 × 10¹⁹ m−3, Tec = 8 keV and (c), (d) nec = 4.0 × 10¹⁹ m−3, Tec = 4 keV.
Download figure:
Standard image High-resolution imageWe now simulate the helicon wave CD capability. In our calculations, 30 rays, launched at a single point, standing for the centre of the antenna, are traced. The helicon wave frequency here is set to 476 MHz here and the centre value of n|| spectrum is 3.0 initially. In all calculations, the actual n|| is negative because the current is clockwise and the equilibrium magnetic field is counter clockwise. In order to get the CDn positively, negative n|| is used.
Shown in figure 7 are the driven current profiles and power absorption for the three n||, namely, n|| = − 2.5, −3, and −4. The total currents calculated in the three cases are 71.5 KA, 145.4 KA, 103 KA, and the corresponding driving efficiencies (ne(1020 m−3)Id(A)R(m)/P(W)) are 0.050 A Wm−2, 0.10 A Wm−2, and 0.070 A Wm−2, respectively. It can be seen that helicon wave drives a higher current, in comparison with ECW (∼0.020 A Wm−2), lower frequency fast wave (FW, ∼0.012 A Wm−2), especially at a specific n||. The position of the driven current also changes with the value of n||.
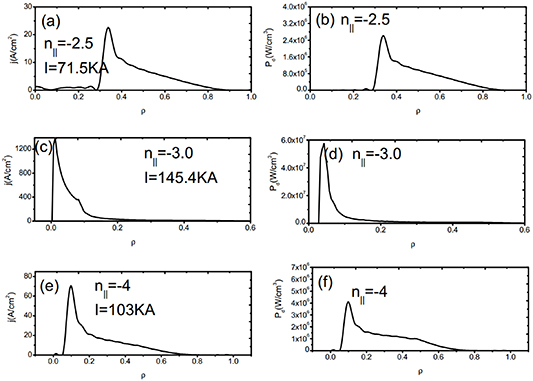
Figure 7. Profiles of driven current calculated with GENRAY (a), (c), (e) and power absorption (c), (d), (f) for n|| = − 2.5, −3, and −4.
Download figure:
Standard image High-resolution imageSince in the previous study of electron cyclotron CD, the resonance and deposition position can be changed by adjusting the poloidal angle, and the results also show that at large poloidal angle, that is, at the point of high position ejection, the efficiency of current driving is higher. Therefore, in order to obtain the optimized scheme of the helicon driving current wave emission conditions in the HL-2M configuration, we performed a scanning of the poloidal injection angle, as well as the parallel refractive index. The total driven current (a) and the locations of the maximum driven current density ρ (b) in the plane of poloidal angle and parallel refractive index are given in figure 8. In GENRAY the poloidal launch location is specified by the poloidal angle. The poloidal launch angle was varied over the range −20° to +20° in steps of 5°, while the n|| was varied in steps of 0.2 from 2.8 to 4.2. We can see that the maximum driven current exist at the desired mid-radius location. And there is little difference in launching a helicon wave above or below the mid-plane, especially under conditions of large parallel refractive index. It should be noted that we only scanned a certain range of poloidal angle corresponding to the weak field side launch of helicon wave. For the high field side (HFS) launch of the waves, there are currently many studies on LHW [37–39]. The latest studies on the HFS launch of LHW indicate [32] that the wave is attenuated in the higher temperature region, which leads to improved CD efficiency. Moving the LHRF antenna to the HFS also has the advantages of reducing plasma-material interaction. However, for the helicon wave, current calculations show that when the wave is launched from the HFS, and the driving efficiency is weakly larger than those when the wave is launched from weak field side [7]. Therefore, here we no longer calculate the helicon CD for waves launched from HFS. From figure 8, we also find that large n||, to some extent, enhances the driven current. However, after reaching a certain value (here n|| = 3.2), increasing n|| will not increase the driving efficiency any more, and will cause a small decrease in driving efficiency. This phenomenon is consistent with those in electron cyclotron CD [40]. Generally speaking, waves with n|| = 3.2 and launch angle of 5° are good choice for the core plasma CD. Finally, it should be noted that a large n|| will shift the current deposition position toward the center of the plasma; with large n||, increasing the poloidal angle will move the driving position to the plasma core, especially increasing the poloidal angle in a positive direction. This result agrees with the result in figure 2. In the scanning range, the position of the driven current density peak covers the range of 0–0.35.
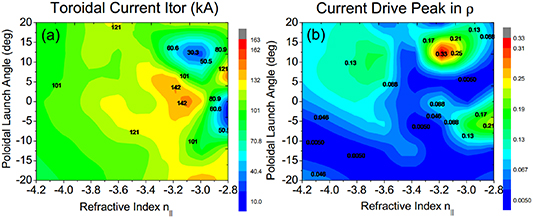
Figure 8. Contours of total driven current (a), and the normalized radial position in ρ of the current drive peak in the plane of poloidal angle of the launcher and the value of launched n||.
Download figure:
Standard image High-resolution imageFigure 9 shows the ray data information along wave trajectories, for launched n|| of −2.5 (left) and −4.0 (right). The top row of boxes are the electron temperature and n||; the middle boxes are the power P remaining in the ray, the derivative −dP/ds showing the rate of power absorption, and the normalized minor radius ρ; and the bottom boxes show the local value of ξe = v||/vte. In both cases, the vertical dotted line represents the location of the peak rate of attenuation. Both the absolute value of the launched n|| and electron temperature increase as the ray propagates. From the top boxes, we can see the maximum absorption occurs at the position of higher temperatures. From the rate of power absorption and the normalized minor radius ρ, we find that the peak of the driven current profile for both cases are ∼0.4 and ∼0.2, respectively, and this behavior is consistent with the absorption peak in figure 6. The absolute value of ξe = v||/vte ∝ n||(Te)−1/2 decrease as the ray propagates. The absorption takes place where ξe has a suitable value, peaking at ξe ≈ 0.2 here. Combined with contour plot, we found that the CD efficiency increases first, then decreases slightly with the increase of the launched n||. The magnitude of the CD is determined both by the absorption rate and the value of ξe.

Figure 9. Ray parameters along wave trajectory for n|| of −2.5 (left) and −4.0 (right). The top row of is the electron temperature and n||; the middle row is the derivative −dP/ds showing the rate of power absorption, and the normalized minor radius ρ; and the bottom row is the local value of v||/vte = ξe. In both cases, the vertical dotted lines indicate the location of the peak rate of attenuation.
Download figure:
Standard image High-resolution imagen|| was scanned at a lower plasma parameter above. In fact, the change of driving position and driven current with n|| is more complicated, especially under different plasma parameters. From the current results, under high parameter plasmas, the driving position and the driven current magnitude are both weakly dependent on n|| when n|| is between 3.4 and 4.2. The driving position increases with n||, namely, it moves toward the edge of the plasma with increasing n||. While the magnitude of the driven current decreases with the increase of n||, as shown in figure 10, which depicts the profiles of driven current with different n||. This is consistent with the results in [10]. When n|| is less than 3.4, the driving position and the driven current have a more complicated relationship with n||, and even at some values of n||, due to the multi-pass absorption regime, two peaks appear. This is why the results are so different from previous publications.
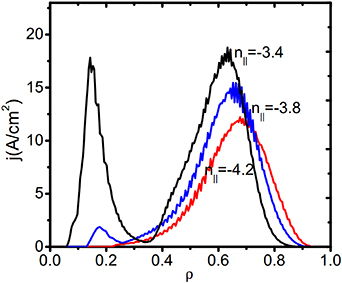
Figure 10. Profiles of driven current with different n|| under plasma parameters: nec = 6.4 × 10¹⁹ m−3, Tec = 8 keV.
Download figure:
Standard image High-resolution image3.2. Sensitivity of driving capability to plasma parameter
The dependence of the helicon wave CD on plasma parameters, such as nec and Tec, is also investigated. Contours of total driven current and the normalized minor radius where the driven current peaks in the plane of the core plasma temperature and density are shown in figure 11. The core plasma temperature was varied over the range 1.6 KeV to 9.2 KeV in steps of 0.8 KeV, while the core plasma density was varied in steps of 0.4 from 3.6 × 10¹⁹ m−3 to 5.6 × 10¹⁹ m−3. From figure 11, we can see that the driving current increases with the increase of the core plasma temperature and the decrease of the core plasma density, which is similar with the ECCD. Those results are in good agree with the following analytic formula for CD efficiency, which is proposed by Ehst and Karney,
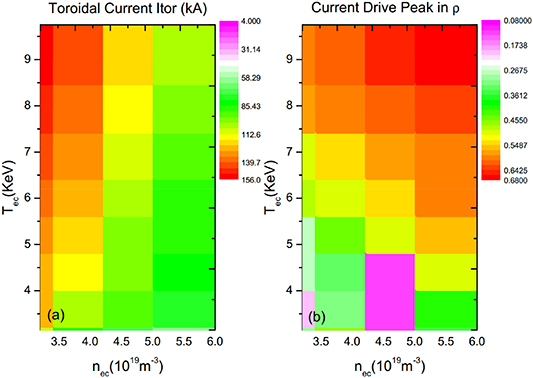
Figure 11. Same as figure 7 but in core plasma density and temperature plane.
Download figure:
Standard image High-resolution imagewhere C, M, R, η0 are given in [11]. Therefore, lower driven current at higher plasma density may impose a restriction on the application of helicon wave. What should be noted is that the dependence of the driving efficiency on the plasma density is not clearly described before. The previous study only showed that the driving efficiency increased with the increase of TKev/n20. This tends to indicate that when the temperature is kept constant, the driving efficiency increases as the plasma density decreases, which is consistent with our calculation here. Moreover, driving efficiency, as mentioned in [7], increases with increasing density, is mainly due to the definition of driving efficiency. If the driving efficiency is defined as ne(1020 m−3)Id(A)R(m)/P(W), there is no doubt that it increases as the plasma density increases. However, the driven current decreases with increasing plasma density, that is correct and consistent with that of previous results. Our calculation here also illustrates this point. Furthermore, as shown in figure 11, a large center temperature and a large center density will shift the current deposition position outward. The reason can be explained as following. As mentioned above, the magnitude of the CD is determined by the value of ξe. Generally, ξe needs to be reduced to a certain value when the wave is absorbed. Increasing Te decreases the value of ξe. Therefore, a large Tec will reduce ξe to a specific value in advance, causing the wave power to be deposited at outer region of the plasma.
In order to study the effect of equilibrium plasma current on the helicon wave CD, we have investigated the helicon CD in both 2.0 MA and 1.2 MA plasma current configurations and compared the results. The driven current density profiles in 1.2 MA (a) and 2.0 MA (b) plasma current configurations are shown in figure 12. We find that in 1.2 MA plasma current configuration, the driven currents are 103 KA, 101 KA, and 99 KA when the poloidal injection angles are 0°, 6°, 12°, respectively. In 2.0 MA plasma current configuration, the corresponding driving currents are 87 KA, 99 KA, 87 KA. A difference of 50% in ohmic current causes only 10% driven current difference. Thus, the plasma equilibrium current here seems do not significantly affect the helicon CD efficiency. However, a large plasma equilibrium current could move the driven current toward the plasma core region and narrow the width of the driving current profile.
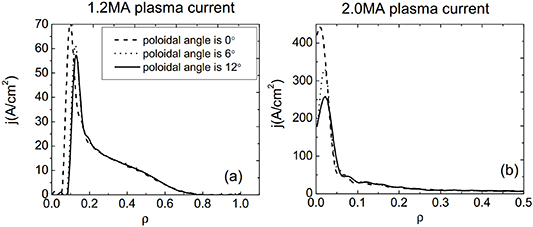
Figure 12. Driven current density profiles in 1.2 MA (a) and 2.0 MA plasma current (b) configurations.
Download figure:
Standard image High-resolution image3.3. GENRAY modeling for HL-2M with SOL
GENRAY currently includes the SOL module. Simulations with SOL could include information of magnetic fields, plasma profiles, and geometry. The magnetic field geometry in the SOL is imported directly from the equilibrium reconstruction using the EFIT code. Outside the LCFS region, the density and temperature of the plasma are given in the following form [41]:
where nLCFS = ne,i (a) and TLCFS = Te,i(a) are the electron and ion densities and temperatures at the LCFS, respectively, σn and σT are the normalized (to plasma radius) exponential density and temperature decay lengths outside of the LCFS starting at ρ = 1, respectively.
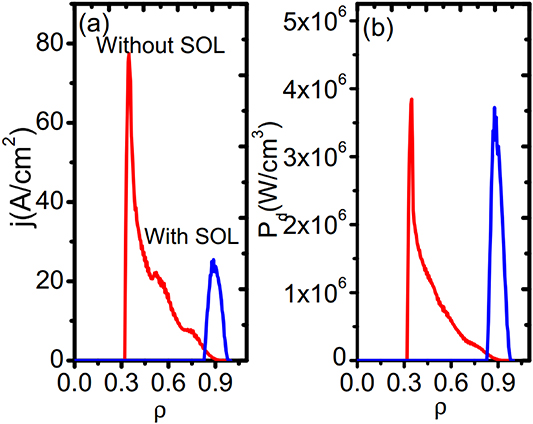
We first use the 1.2 MA plasma equilibria to calculate helicon wave power deposition and CD with and without SOL. In the calculation, the plasma and SOL parameters we used are: nec = 2.2 × 10¹⁹ m−3, nea = nLCFS = 0.3 × 10¹⁹ m−3, Tec = 9.7 keV, Tea = TLCFS = 0.05 keV, σn = 0.05, and σT = 0.05. Figure 13 shows the profiles of driven current density (a) and power deposition (b) with SOL and without SOL in 1.2 MA plasma current configuration. It is clearly show that when the SOL region is included, the absorbed power of the wave drops about 5%. The surprising result is that the driven current is reduced from 177 KA to 71 KA. Meanwhile, the deposition position of the wave also changes the SOL module is included,. In the case without SOL, the wave is located in the off-axis plasma region (ρ ∼ 0.4), whereas it is mainly absorbed at the edge of the plasma when considering the SOL region. The plasma temperature is high so the efficiency of current driving is high when the wave is absorbed at the plasma core. This also explains why the driven currents of the two cases differ so much. It should be noted that after analyzing the change of n||, we found that in these two cases, the change trends of n|| are very different. When SOL is included, n|| changes slowly first, and then there is a large-scale decline process. In contrast when SOL is not included, after a slow change, n|| rises sharply and then falls. It can be seen that in these two cases, the local n|| is very different. In addition, it is found from the previous analysis that different n|| results in different ξe. The local ξe determines the deposition location of the wave, which explains why the CDn profile shifts so much when the SOL is included.
Figure 13. Profiles of driven current density (a) and power depostion (b) with SOL and without SOL in 1.2 MA plasma current configuration.
Download figure:
Standard image High-resolution image
We also calculated the wave power absorption when the SOL region is included in the 2.0 MA plasma scenario. Given in table 1 are helicon wave power absorption rate and driven current in the cases with and without the SOL for the two discharges. We find that the power absorption rate drops by about 20% in the 2.0 MA plasma equilibria. However, the deposition positions of the power are not much different for the cases with and without SOL, and the magnitudes of the driven currents are also very similar. In short, the current preliminary SOL calculations show that the loss of absorption rate of helicon wave in SOL is about 5%–20%, while the changes of driven current vary with the plasma parameters. It should be noted that when the SOL region is included, the previous research on CD with ray-tracing codes is mainly for LHW, and there are few for helicon waves. Reference [6] used GENRAY to calculate the helicon CD with including of SOL plasma. However, wave trajectories are given only there. Therefore, for the first time, we use a ray-tracing code to conduct a preliminary calculation of the helicon CD when SOL region was included.
Table 1. Helicon wave power absorption rate and driven current in the cases with and without SOL for two scenarios.
| Cases | absorption rate | current drive |
|---|---|---|
| 1.2 MA scenario with the SOL | 94.7% | 71.3 KA |
| 1.2 MA scenario without the SOL | 98.9% | 177.9 KA |
| 2.0 MA scenario with the SOL | 63% | 58.5 KA |
| 2.0 MA scenario without the SOL | 86.8% | 56.6 KA |
4. Conclusions and discussions
The study of helicon wave heating and CD has been carried out in toroidal plasma with the ray-tracing code GENRAY. The wave trajectories, power deposition, and driven-current profiles are systematically studied. First, it is shown that the poloidal launch angle do not change the absorption rate of the wave, While increasing the poloidal launch angle can move the peak of the wave deposition towards the plasma core. For the first time, we have shown that wave frequencies in the range of our interest (460 MHz ∼ 480 MHz) do not change the absorption of the wave. When we continue to increase the wave frequency, no desired strong absorption is observed. Second, it is found the helicon wave heating and CD exhibit different characteristic under different parameters. Under high-parameter plasmas, the driven current exhibits less chaos, and is weakly dependent on the initial refractive index; under low-parameter plasmas, the heating and CD of the helicon have multiple absorption, and the wave deposition positions, and the magnitude of driven current is greatly affected by the emission n||. Therefore, it has many interesting conclusions that are different than previous papers, and the possible explanations for those results are given. The parallel refractive index figure of merit for mid-plane launching in HL-2M configuration is 3.2 with low-parameter plasmas, and the magnitude of the driven current is determined by both the absorption rate and the value of ξe = v||/vte. Third, we systematically clarified the relationship between the magnitude and efficiency of wave drive current and the plasma temperature and density. It is presented that driving current increases with increase of the core plasma temperature and decrease of the core plasma density. Therefore, like other waves such as electron cyclotron waves, high plasma temperature will greatly improve the current driving efficiency. Fourth, the relationship between drive efficiency and plasma ohmic current is unexpected. The plasma ohmic current seems do not significantly affect the helicon CD efficiency, but moves the driven current position toward the plasma core region and narrows the width of the driving current profile. Fifth, the preliminary SOL calculations suggest that the power absorption rate drops about 5%–20% in the cases with SOL, and the changes of driven current vary with the plasma parameters.
These results give some new physics of helicon wave heating and CD in tokamak plasmas, and provide a reference and theoretical basis for the design and construction of HL-2M helicon wave system. Future study includes the quasi-linear study of helicon wave CD in HL-2M configuration, and the investigation of non-linear effects such as parameter decay instability of helicon waves. Besides, the comparison of the wave power absorption using the ray-tracing and full wave code that containing the SOL module also needs to be clarified in future work.
Acknowledgments
This work is supported by the National Key R&D Program of China (Nos. 2018YFE0303102 and 2017YFE0301702), NSFC (Nos. 11905109 and 11947238), U.S. DOE SciDAC ISEP, and the China Postdoctoral Science Foundation No. 2018M640230.