

Abstract
The differences in performance of a 1.9 kJ plasma-focus device PACO assembled with three different cathode configurations are experimentally qualified. In particular, the current sheath kinetics and the neutron yield operating with deuterium gas are systematically studied for the whole range of neutron-producing pressures, and the measurements are analyzed searching for relations between relevant physical magnitudes. The pinching time was found correlated with the dimensionless driver parameter, and this feature was found statistically independent of the cathode. The variation of the inductance jump associated with the radial collapse stage is used to estimate the effective pinch length,  mm, and radius,
  mm. The maximum production in a single shot was registered for the smallest cathode radius, 41 mm, whereas the intermediate cathode radius, 45 mm, scored better in average. In all configurations, the neutrons per deuteron pair correlates fairly well with an estimation of the effective equilibrium temperature of the pinch, which suggests a prevalence of thermonuclear neutrons measured perpendicularly to the focus axis.
Export citation and abstract BibTeX RIS
1. Introduction
Plasma Focus (PF) devices are pulsed coaxial-discharge configurations proposed in the 60s by Mather [1] and Filippov [2] for producing transient dense magnetized plasma conditions known as z-pinches. These devices can emit neutron and x-ray pulses on demand, and therefore have been proposed as ambient-friendly alternatives to isotopic sources. A valuable feature of these devices is that they are relatively cheap and portable, which makes them attractive in research laboratories or for industrial applications [3–8]. In essence, a PF is a coaxial gun composed of two cylindrical electrodes placed in a chamber filled with a few mbar of gas. A bank of capacitors stores an initial energy that is released into the chamber by means of a high current switch (spark gap). When the spark gap closes, an electrical discharge starts in the gap between the electrodes forming an umbrella-like plasma layer. The Lorentz force pushes that current sheath (CS) towards the open end of the electrodes, collecting the particles of gas ahead of it. Finally, the CS arrives at the electrodes end and collapses radially, generating a plasma column, called pinch, with ion densities in the range of 1019 particles per cubic centimeter and temperatures up to some keV [3–6]. Depending on the filling gas, x-ray and neutron pulses are emitted from the pinch, which have been proposed for a number of applications, ranging from introspection imaging to substance detection, among others [7–19].
The objective of the present article is centered in the neutronic production and its relation with the geometry of the plasma gun. In order to expand the scope of applications, it is important to find ways to improve the efficiency of the neutronic emissions of plasma focus discharges. There is a growing interest on this account, and considerable efforts and resources has been spent to come up with better designs and operation modes with diverse success. Much progress has been done in contributing to the understanding of the physical mechanisms involved in the kinematics of the plasma formation and sheath, and its relation to the neutron emissions. An accepted fact is, for example, that the neutron yield of a given plasma-focus device varies depending on the pressure, the charging voltage and the geometry of the electrodes. The physics of the pinches, which is where the fusion reactions responsible for the emissions take place, is still an open issue and, albeit there have been advances in this matter [20–28], more experimental data is needed to get better insight to feed the theory [29–34].
The geometric configuration of the coaxial gun of electrodes has been studied in a wide range of charging energies, from 1 MJ [35–39] to 0.1 J [40–45]. Between these two extremes, a variety of intermediate devices were studied, all of them following the general scaling law of increasing neutron yield as the energy of the discharge increases [46–54]. A systematic study of the influence of the electrodes geometry in the neutron production was reported by Beg et al [55], who made a series of experiments with different anode lengths, and found that there is an optimum anode length where the neutron production peaks at an optimum filling pressure. Kashani et al [56] investigated the performance of a 7 kJ plasma focus with barred and solid cathode, finding that although the cathode structure influences the energy dissipation in the run-down phase, no substantial differences regarding the corresponding neutron emissions could be recognized. Hill and Hubbs [57] measured neutrons in a plasma focus using three different cathode structures: cylindrical 4.75 cm diameter and 8 cm length, hourglass shaped, and 'choked' cylindrical. The highest neutron yield was measured with the 'choked' cylindrical cathode. Bruzzone et al [58] found that the neutron emission decreases substantially when a solid cathode is used instead of a barred cathode.
In the present work, the current sheath kinetics and the neutron yield of the plasma focus PACO [59, 60] assembled with three different cathode configurations, were measured systematically for the whole range of neutron-producing pressures. The measurements are analyzed searching for characteristic magnitudes and relations between them to get insight about the physics of the discharges and ultimately optimize future designs.
2. Experimental method and device
The experiments were performed in the plasma-focus device PACO, which is charged by a bank of four Maxwell 33519 capacitors (0.9 μF, 40 nH) in parallel assembly. The bank and the anode of the coaxial gun are connected through the spark gap by means of transmission lines made of flat copper strips separated by a mylar film. The spark gap is triggered by a fast HV pulsed power source controlled by the operator. The anode is a massive cylinder, 40 mm diameter, 20 mm free length, made of free-of-oxygen cooper. The front 10 mm length of the anode is drilled with a 10 mm diameter cylindrical hole. A tungsten cylinder (10 mm diameter, 5 mm thick) is placed at the bottom of the anode cavity. The insulator is a tube of borosilicate, 50.3 mm external diameter, 43.0 mm internal diameter, 12 mm long. In all the shots the initial voltage of the capacitor bank was fixed at 31 kV (i.e. 1.9 kJ).
The purpose of the experiments is to study the influence of the cathode geometry on the discharges, in particular on the kinematics of the current sheath and the neutronic emissions. Three different cathode structures were assembled to the gun, namely:
- (1)Twelve brass rods, 8 mm diameter and 40 mm length, equally spaced around a circumference of 82 mm diameter.
- (2)Twelve brass rods, 8 mm diameter and 40 mm length, equally spaced around a circumference of 90 mm diameter circle.
- (3)No surrounding barred structure, thus the chamber walls acting as the sole cathode structure.
Vacuum is made in the discharge chamber first with a mechanical pump and then with a diffusion pump (Edwards Difftak 160/700). Then the chamber is filled with deuterium gas within a range of pressures p between 0.6 and 3 mbar, which is controlled with an electronic manometer (Edwards Barocel 600AB). The electrical diagnostics consists of a calibrated Rogowski coil that measures the evolution of the current temporal derivative, and a resistive divisor to measure the anode voltage. The signals are digitalized using a Tektronix TDS5104B oscilloscope placed in a Faraday cage. The stray inductance of the circuit external to the coaxial gun, was calculated from the period of a discharge in short circuit between the anode and the cathode, resulting Lo = 55.1 nH. The neutrons and x-rays emitted in each discharge are measured using a plastic scintillator type NE102A placed at 2.49 m from the pinch region perpendicular to the axis. The neutron signal was calibrated using a silver-activation detector that was previously calibrated with a reference Am-Be source, and this calibration was second tested against a 3He detector calibrated with a reference Cf source. All instruments were carefully synchronized following the method recommended by Bruzzone et al [61].
For each cathode configuration the chamber was conditioned performing a series of preliminary discharges at different deuterium pressures in order to release traces of gases absorbed in the electrodes and walls. Then, shots at pressures from 0.1 to 5 mbar were performed to determine the range where neutrons and x rays are produced. Afterwards, a series of systematic discharges were made keeping the pressure constant in each run, covering the neutron-production range with a step of 0.1 mbar. In each discharge the synchronized signals of current derivative, anode voltage and scintillator output, were recorded.
3. Results
The complete set of experiments accounts to a total of 897 discharges, which were processed to glean information regarding the correlation between the characteristic magnitudes of each event.
Figure 1 shows the typical set of signals obtained in each shot. In particular, these correspond to a discharge performed on 1.8 mbar with the barred cathode located at 45 mm from the axis. The current evolution (second from the top) was calculated by numerically integrating the current derivative (at the top) using the trapezoidal rule. Then, the following graphic is the voltage between electrodes. The fourth graphic from the top is the output signal of the radiation detector, where two characteristic peaks can be distinguished corresponding to the x-ray yield, Yx, and the neutron yield, Yn.

Figure 1. Typical signals of a single shot at 1.8 mbar utilizing the 45 mm radius barred cathode, showing the characteristic magnitudes extracted for analysis.
Download figure:
Standard image High-resolution imageThe last plot is the CS inductance indirectly assessed from the electrical signals following the method proposed early by Mather [62] and revisited and tested by Bruzzone et al [33, 61]. Accordingly, the temporal evolution of  is calculated as:
where  is the inductance due to connections between the voltage divider and the initial CS,
  is the electrical current,
  is the voltage of the anode, and
  is the time instant when the breakdown stage is completed. The graphic at the bottom shows the evolution of
  The magnitude ΔLp shown in the graphic is interpreted as the inductance jump brought about by the radial run over of the CS at the anode's end and its following radial collapse towards the axis.
Following the synchronization method recommended in Bruzzone et al [63] the following characteristic times shown in the graphics are determined:
to: zero reference time of the discharge, chosen so as to ensure that the CS resistance is negligible compared to 
tp: time of occurrence of the pinch, assumed to be simultaneous with the first peak of the voltage.
tn: time of occurrence of the neutronic signal.
Finally, the magnitude  is the pinch current, i.e.
  at t = tp. In figure 2, the signals obtained in discharges over each electrode configuration under the same conditions (1.8 mbar, 31 kV) are plotted together for visual comparison. In what follows, the various characteristic magnitudes extracted from the signals are analyzed searching for patterns in their trends and relations between them.

Figure 2. Comparison of typical signals of a single shot at 1.8 mbar utilizing the barred-cathode configuration of 45 mm radius (red) and 41 mm radius (blue), and without barred-cathode (black).
Download figure:
Standard image High-resolution image3.1. Current sheath kinematics
Figure 3 shows the dependence of the pinch time, tp, with the pressure for each cathode configuration. Every point corresponds to a discharge that produced emissions of x rays and neutrons. As expected, there is a general trend of the pinch time to increase with the filling pressure. For a given pressure between 1 and 3 mbar, the pinch in discharges with the barred cathodes occurs in average about 70 ns before without barred cathode. Both trends are depicted by the two view-guiding curves shown in figure 3. At pressures lower than 1 mbar no pinches are observed without barred cathode, whereas with the barred cathodes the pinch time departs from its higher-pressure trend and rather appears to continue the trend without barred cathode. On the other hand, the time of the maximum circuit current was found statistically the same for all pressures and all configurations, averaging 870 ns with a general standard deviation of 20 ns.

Figure 3. Pinch time dependence on the pressure. The data points corresponding to the configurations without any barred cathode are represented by empty circles (black), the data corresponding to discharges using a cathode of 41 mm radius is represented by down triangles (blue) and the discharges using the 45 mm radius cathode are represented by up triangles (red). Every point corresponds to a discharge that produced emissions of x-rays and neutrons.
Download figure:
Standard image High-resolution imageFigure 4 shows the dependence of the pinch current, Ip, with the pressure for each configuration. In all cases the pinch current decreases with the filling pressure at an average rate of 30 kA mbar−1. Similarly to what is observed with the pinch time, for a given pressure between 1 and 3 mbar, the pinch current with either of the barred cathodes is in average about 20 kA higher than without barred cathode. Likewise, at lower pressures the behavior of the pinch current with barred cathodes also seems to approach the trend observed without barred cathode. These two trends are depicted by the two view-guiding curves in figure 4. The transition between trends is about 1.1 mbar and 0.7 mbar, for the 90 mm and 82 mm barred-cathode diameter, respectively.

Figure 4. Pinch current dependence on the pressure. The data points corresponding to the configurations without any barred cathode are represented by empty circles (black), the data corresponding to discharges using a cathode of 41 mm radius is represented by down triangles (blue) and the discharges using the 45 mm radius cathode are represented by up triangles (red). Every point corresponds to a discharge that produced emissions of x-rays and neutrons.
Download figure:
Standard image High-resolution imageThe behavior of the pinch time and the pinch current might be associated with different breakdown and lift-off regimes as well as the kinematics of the current sheath [64]. The latter is expected to be particularly relevant in the present device, because PACO's anode length-to-diameter ratio is close to unity, and thus the rundown, run over and pinch stages are somehow overlapped in time. On this account, correlating the pinch time with the pinch current may provide further insight. Figure 5 relates the pinch time to the so called dimensionless driver parameter,  where
where  is the external anode radius and
  is the permeability of vacuum, which has been reported as a significant operational magnitude in small plasma foci [34]. Interestingly, within the experimental uncertainties all the data points can be cast in a single correlation independent of the cathode configuration, namely:

Figure 5. Pinch time as function of the parameter  The data points corresponding to the configurations without any barred cathode are represented by empty circles (black), the data corresponding to discharges using a cathode of 41 mm radius is represented by down triangles (blue) and the discharges using the 45 mm radius cathode are represented by up triangles (red). Every point corresponds to a discharge that produced emissions of x-rays and neutrons.
Download figure:
Standard image High-resolution imageThe values of the coefficients obtained by least square fitting are:

3.2. Processing of the electrical signals
Processing the electrical signals it is possible to extract further information relevant to the current sheath dynamics and the pinch phase. The voltage drop on the CS is calculated by [33]:
The voltage over the pinch  is the maximum value of
  and it is of particular interest because it is associated to the acceleration-driven fusion mechanisms. Figure 6 shows the pinch voltage Vp as a function of the pinch current. The data points without barred cathode follow an increasing trend about 130 V kA−1 spanning over a range of currents between 140 and 180 kA. On the other hand, the data corresponding to discharges in barred-cathode configurations split up in three sets, ranging currents between 180 and 215 kA. Most of the points continue the trend followed by the data without barred cathode. The rest of the shots with barred cathodes appear to follow a similar increasing trend but at higher pinch voltages. The latter suggests the occurrence of different regimes, which might be chalk up to pinch-instability modes or breakdown patterns brought about by the presence of the barred cathode.

Figure 6. Voltage drop on the current sheath at the pinch time. The data points corresponding to the configurations without any barred cathode are represented by empty circles (black), the data corresponding to discharges using a cathode of 41 mm radius is represented by down triangles (blue) and the discharges using the 45 mm radius cathode are represented by up triangles (red). Every point corresponds to a discharge that produced emissions of x-rays and neutrons.
Download figure:
Standard image High-resolution imageFigure 7 shows the inductance jump  due to the radial run-over and radial collapse of the CS at the end of the anode (see figure 1). It can be seen that
  is independent of the pressure, at least within the present statistics. Since
  is basically determined by the radial collapse, it is possible to infer some effective information about the pinch geometry. Assuming a simplified cylindrical geometry as shown in figure 8, the inductance jump during the radial collapse up to the pinch start can be approximated by [21]:

 and
and  are effective values of the radius and length of the pinch,
  is the cathode radius, and
  is the permeability of vacuum. In the case without barred cathode the chamber wall is taken as acting cathode. Figure 9 shows the fitting of equation (1) by minimum square differences with the data. The corresponding values of the parameters, with 67% confidence, are:

Figure 7. Inductance jump during the CS radial collapse, ΔLp, plotted against the filling pressure. The data points corresponding to the configurations without any barred cathode are represented by empty circles (black), the data corresponding to discharges using a cathode of 41 mm radius is represented by down triangles (blue) and the discharges using the 45 mm radius cathode are represented by up triangles (red). Every point corresponds to a discharge that produced emissions of x-rays and neutrons.
Download figure:
Standard image High-resolution image
Figure 8. Simplified effective geometry of the radial collapse of the current sheath.
Download figure:
Standard image High-resolution image
Figure 9. Inductance jump during the radial collapse, ΔLp, plotted as function of the cathode radius. In the case without barred cathode the chamber wall is taken as acting cathode.
Download figure:
Standard image High-resolution imageAccording to Soto et al [45] and Lee and Serban [3], the pinch size is proportional to the anode radius, with coefficients (0.1–0.2) and (0.8–1.0) for  and
and  respectively. The problem is that in the present case the anode inner and outer radii differ by a factor 2 (1 and 2 cm respectively). Taking this into account, the value of
  is consistent with the scaling law using the outer anode radius, whereas the value of
  is consistent with the scaling law using the inner anode radius.
3.3. Neutrons
Figure 10 shows the dependence of the neutron production with the deuterium filling pressure for each cathode configuration. Notwithstanding the great dispersion of the data, which is common in fusion plasma-focus devices, an optimum pressure for which the average neutron yield is maximum can be distinguished. The dashed curves shown in each graphic correspond to parabolas obtained by nonlinear regression, which gives the characteristic magnitudes shown in table 1. The maximum production in a single shot was registered for the cathode radius of 41 mm, whereas the emissions measured in the shots with the cathode radius of 45 mm scored better in average. The range of optimum pressures is much wider with the 41 mm cathode, where the production is practically constant over the whole range of operating pressures. In the other two cases the optimum pressures are bounded within a range of 1 mbar.

Figure 10. Neutron yield dependence on the pressure without any barred cathode (up), 41 mm radius barred cathode (middle) and 45 mm radius barred cathode (down).
Download figure:
Standard image High-resolution imageTable 1. Characteristic magnitudes in each cathode configuration.
 (mm) (mm) |
ΔLp (nH) | Optimum pressure (mbar) | Max <Yn>/109 | <En> (MeV) | Skewness (neutron velocity spectra) |
|---|---|---|---|---|---|
| 41 | 3.4 ± 0.5 | 1.6 ± 1.1 | 2.8 ± 1.4 | 2.35 ± 0.31 | −0.61 |
| 45 | 3.8 ± 0.5 | 1.7 ± 0.5 | 3.3 ± 0.9 | 2.53 ± 0.28 | −0.93 |
| 100 (no barred cathode) | 4.8 ± 0.5 | 2.0 ± 0.4 | 2.8 ± 0.9 | 2.34 ± 0.21 | −1.38 |
Taking into account that the shape and trajectory of the current sheath is essentially the same for all the shots, it is usually assumed that the number of deuterons in the pinch is proportional to the charging pressure [20, 27, 34]. This being the case, the number of deuterons pairs is proportional to the square of the pressure. Therefore, the quotient between the neutron yield and the square of the pressure,  can serve as a score of the reactivity of the pinch, in the sense that
  is proportional to the reactive fraction of pairs of deuterons in the focus. The left graphic in figure 11 shows the plot of
  in relation with the voltage along the pinch, which can be associated with reactions promoted by voltage-induced acceleration, e.g. the so-called beam target mechanism. In turn, in the right graphic of figure 11,
  is plotted against the magnitude
  which is proportional to the effective Bennett temperature of the pinch, and hence associated with thermonuclear reactions. The plots suggest that in the present device the pinch reactivity is better explained by a thermonuclear scenario rather than with acceleration-driven mechanisms. However, it should be noted that Vp and Ip are interrelated because they shear common causes (see figure 6), and so the present evidence should be taken as indicative but not conclusive regarding the actual mechanism of neutron production in the pinch.
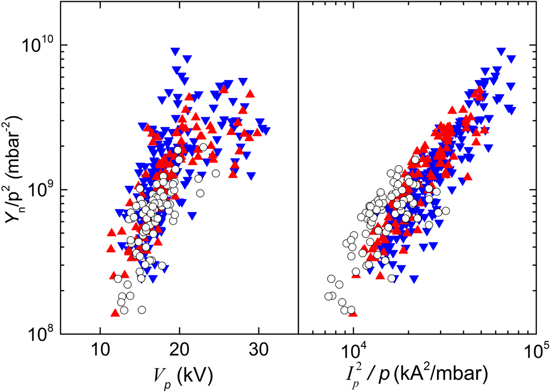
Figure 11. Reactivity of the pinch,  plotted against the voltage drop along the pinch Vp (left) and against
  (right).
Download figure:
Standard image High-resolution imageThe energy spectrum of the neutrons can be assessed by time of flight. The time of arrival of the neutrons on direct flight is calculated as the time of the rising ramp of the signal (see figure 1). Specifically, it is defined as the time in the ramp when the signal is half the value of the peak. Figure 12 shows the histograms of the neutrons velocity for each cathode configuration. The means and standard deviations of the neutrons' energy is given in table 1, all consistent with the tabulated value of 2.45 MeV for a center of mass at rest. The probability distribution of the velocity presents a negative skewness in all cases, whose magnitude increases with the cathode radius (see table 1).

Figure 12. Histograms of the neutrons velocity measured perpendicularly to the pinch axis.
Download figure:
Standard image High-resolution image
4. Conclusions
The differences in performance of the plasma focus PACO operating with three different cathode configurations were experimentally characterized. All the experiments were carried out using deuterium gas, and the discharges produced neutrons from D–D reactions in every configuration. In order to be systematic, the charging voltage was kept the same for all the discharges, and the gas pressure was used as the main control parameter, within the neutron-production range between 0.6 and 3 mbar. For a given pressure, increasing the cathode radius decreases the pinch current, and associated with this the inductance variation during the radial collapse increases. The latter was indirectly estimated using the electrical signals, and showed no statistically significant variation with the pressure. The poorer performance of the unbarred cathode configuration may be associated to instabilities of the plasma sheath, which could be controlled by the confinement of the barred cathodes.
An interesting correlation was found between the time of the pinch and the dimensionless driver parameter. This observation can be used to test and calibrate kinematic models of current sheaths in PF devices.
The maximum production in a single shot was registered for the lowest cathode radius, 41 mm, whereas the intermediate cathode radius, 45 mm, scored better in average. In all configurations, the neutrons per deuteron pair correlates fairly well with an estimation of the effective equilibrium temperature of the pinch, which suggests a prevalence of thermonuclear reactions.
Acknowledgments
This research was supported by the grant PICT 2012-0926 from Fund for Scientific and Technological Research—Argentina (FONCYT), grant PIP 2013-0391 from National Scientific and Technical Research Council—Argentina (CONICET) and by the National University of the Center of the Buenos Aires Province—Argentina (UNCPBA). This work was partially supported by the Interistitutional Dense Plasmas Program (PIPAD).