
Abstract
Classical particle drifts are known to have substantial impacts on fluxes of particles and heat through the edge plasmas in both tokamaks and stellarators. Here we present results from the first dedicated investigation of drift effects in the W7-X stellarator. By comparing similar plasma discharges conducted with a forward- and reverse-directed magnetic field, the impacts of drifts could be isolated through the observation of up-down asymmetries in flux profiles on the divertor targets. In low-density plasmas, the radial locations of the strike lines (i.e. peaks in the target heat flux profiles) exhibited discrepancies of up to 3 cm that reversed upon magnetic field reversal. In addition, asymmetric heat loads were observed in regions of the target that are shadowed by other targets from parallel flux from the core plasma. A comparison of these asymmetric features with the footprints of key topological regions of the edge magnetic field on the divertor suggests that the main driver of the asymmetries at low density is poloidal E × B drift due to radial electric fields in the scrape-off layer and private flux region. In higher-density plasmas, upper and lower targets collected non-ambipolar currents with opposite signs that also inverted upon field reversal. Overall, in these experiments, almost all up-down asymmetry could be attributed to the field reversal and, therefore, field-dependent drifts.
Export citation and abstract BibTeX RIS

Original content from this work may be used under the terms of the Creative Commons Attribution 3.0 licence. Any further distribution of this work must maintain attribution to the author(s) and the title of the work, journal citation and DOI.
1. Introduction
An important requirement in the development of fusion power plants based on magnetic plasma confinement is the ability to regulate power flux sufficiently to avoid overloading the plasma-facing components. This is made especially challenging by the tendency of the edge magnetic topology to focus the exhaust plasma onto relatively narrow strike lines along the targets. It is therefore crucial to develop a good understanding of the physics governing fluxes in the edge plasma in order to control and optimize the plasma exhaust properties.
One important factor in determining edge fluxes is classical drift flow due to electric fields (E × B drift) as well as the curvature and gradients inherent to a toroidal magnetic field (curvature and ∇B drift). Extensive theoretical and modeling work [1–4] has indicated that combinations of these drifts can cause discrepancies in temperatures, densities, and power fluxes between different divertor targets that are often observed in tokamaks [5–7]. Drift flows have also been proposed as a determining factor for the tokamak scrape-off layer (SOL) width, and, as a result, the localization and intensity of power flux to the divertor [8, 9].
Drift effects have been observed in the edge plasmas of multiple stellarators, including Heliotron-J [10], W7-AS [11–13], and LHD [14]. While the underlying drift mechanisms behind such effects are the same as in tokamaks, the differences between tokamak and stellarator configurations can lead to fundamentally different outcomes. Due to the inherently three-dimensional nature of stellarator edge magnetic fields, modeling of drifts in stellarator edge plasmas is more computationally challenging than for tokamaks; hence, a full theoretical understanding of stellarator edge drift flows remains a topic of ongoing work.
The Wendelstein 7-X (W7-X) device [15, 16] presents a new opportunity for investigation of edge drift effects in high-performance stellarator plasmas. During typical operation, W7-X employs a nonaxisymmetric island divertor configuration [17] in which the divertor targets intersect one or more resonant magnetic islands that in turn surround the core plasma [18, 19]. The islands exist naturally in the vacuum magnetic field and arise from resonant radial field components generated by the non-planar magnetic coils. While the W7-X divertor configurations are topologically similar to tokamak divertors and are designed to serve the same purpose, they have a number of significant differences including (1) that the x-points wrap helically around the last closed flux surface (LCFS) and (2) that the divertor targets are toroidally localized; i.e. there exist poloidal cross-sections that do not intersect any divertor targets.
Under ideal conditions, each of the ten targets in W7-X are identical in their geometry and in the topology of the impinging magnetic field. Thus, in the absence of error fields or particle drifts, each target should receive identical patterns of heat and particle flux. Modeling to date, such as field line diffusion or EMC3-EIRENE [20] simulations, is usually based on such ideal conditions. In experiments to date, however, asymmetries in the loads have always been observed. Many of these asymmetries can be attributed to field errors arising from coil misalignments and deformations [21], which can be at least partially corrected through the use of trim and control coils [22, 23]. Edge drifts may also play a significant role, and their influences on the heat and particle fluxes would be difficult to control with magnetic coils.
In this paper, we present the first dedicated study of edge drifts in W7-X, focusing on their effects on the distributions of particle and heat flux to the targets. In section 2, we describe the edge magnetic topology in detail and discuss possible drift flow patterns that may arise. Section 3 describes the general discharge properties used for the study as well as the alignment of some key profile diagnostics relative to the magnetic field. In section 4, we present observations of edge flux distributions from low-density discharges whose asymmetric features on upper divertor targets relative to lower targets essentially switch places in response to reversal of the magnetic field. The asymmetries in this case appear to arise primarily from poloidal E × B flows in the edge plasma. Finally, in section 5, we present target flux profiles under conditions of higher density, under which the overall profile shapes are significantly different from the lower-density case but still exhibit up-down asymmetric properties including net current flows to the divertor targets.
2. The W7-X edge magnetic field
2.1. Edge topology
The discharges for the studies described in this paper were all carried out in the W7-X low-iota magnetic configuration, so named because its rotational transform (ι) profile is systematically lower than that of the other configurations typically employed in W7-X. The magnetic geometry is shown in figure 1. The confinement region is bounded by a single island with ι = 5/6, which determines the LCFS. The low-iota configuration is well-suited for edge drift studies for a number of reasons. First, the edge island chain does not resonate with the n = 1 and n = 2 error fields, making it less vulnerable to asymmetric deformations that would otherwise convolute the asymmetric effects of drift flows. In addition, the field lines in the SOL have longer connection lengths compared to other W7-X configurations, which would tend to elevate the influence of perpendicular drifts in the edge relative to parallel transport. Finally, the downstream diagnostics—particularly the target-integrated Langmuir probes—can fully capture the plasma-target interaction region, which is not the case for the other attainable island divertor configurations in W7-X.

Figure 1. (a) Geometry of the W7-X low-iota magnetic configuration, including the LCFS (red), a flux surface within the edge island (pink) that wraps helically around the LCFS, and the ten divertor targets (dark gray). Translucent planes indicate cross-sections at key toroidal angles referred to in this paper, including the location of the multipurpose manipulator (−159°), the lower-divertor (−81°) and upper-divertor (−63°) Langmuir probe arrays, and a cross-section between target modules (36°). (b) Poincaré cross-sections corresponding to each of the translucent planes in (a), including the island separatrix (red), island flux surfaces (pink), and target components (black).
Download figure:
Standard image High-resolution imageThe island consists of a helical flux bundle that circles the torus six times toroidally and five times poloidally before returning to its starting point. It therefore intersects all ten of the divertor targets at different locations. As a result, the island magnetic flux is partitioned into a discrete set of flux tubes defined according to which targets they intersect. As shown in figure 2, the boundaries between these flux tubes are characterized by jumps in the connection length Lc, or the distance traveled by a field line between the two target intersection points. The flux near the o-point of the island never makes contact with the target; i.e. its connection length is infinite.

Figure 2. Poincaré cross-section of the edge island in the W7-X low-iota configuration. This particular cross-section, at toroidal angle ϕ = 36°, is not intersected by divertor targets. The Poincaré points were determined for the vacuum magnetic field assuming ideal coils. The inset shows contours of connection length for the magnetic field lines intersecting the area indicated by the dashed rectangle. The main topographic regions of the edge field as described in the text are indicated with labels. Note: all field line trace and connection length calculations for this paper were conducted with the software described in [24].
Download figure:
Standard image High-resolution imageWith the exception of the region near the o-point, flux tubes within the island intersect targets at various points, thereby forming different segments that are isolated from one another in terms of parallel transport. The flux tube segments in the inner half of the island (i.e. between the o-point and the LCFS) have longer Lc than those in the outer half. The longest connection lengths are seen in segments located closest to the island separatrix, where the field line pitch angle relative to the x-point is the smallest. These segments constitute the scrape-off layer (SOL) and form the main channel for parallel transport in the edge, as they are the only ones that pass adjacent to the core plasma. Outside the island, in the private flux (PF) region, flux tube segments have intermediate connection lengths and do not make direct contact with the core plasma except at the x-points. The shortest connection lengths are seen in flux tube segments in and around the outboard half of the island that are shadowed from the core plasma by the targets. Since these segments do not pass close to the LCFS, plasma from the core can only reach these regions via perpendicular transport mechanisms such as turbulence or classical drifts. Unlike the SOL and PF regions, the shadowed region has no topological equivalent in a tokamak with axisymmetric divertor geometry; rather, it arises in W7-X due to the discontinuous nature of the divertor targets.
The shadowed region may be further subdivided according to the targets contacted by the flux tubes. These regions are shown in figure 3. While most of the flux tube segments in the edge field travel from a lower target to an upper target, there are two regions in which flux tubes either make contact with upper targets on both ends (the upper-target shadowed, or UTS, region) or with lower targets on both ends (the lower-target shadowed, or LTS, region). Connection lengths within the UTS and LTS are aproximately 45 m, corresponding to six toroidal field periods or 1.2 toroidal revolutions. The presence of these regions, which border both the SOL and PF regions, has consequences for asymmetric drift flows, as will be seen in section 4. The remaining shadowed regions, including the small inner shadowed (IS) region adjacent to the o-point and the larger outer shadowed (OS) region that includes the outboard side of the island, exhibit flux tube segments that, as in the SOL and PF regions, connect upper and lower targets. We note that flux tubes in some peripheral portions of the shadowed and PF regions intersect additional plasma-facing components (e.g., baffles) prior to reaching the divertor targets. Such intersections were not considered for this initial study, which focuses on fluxes to the divertor targets, but will be investigated in future work.
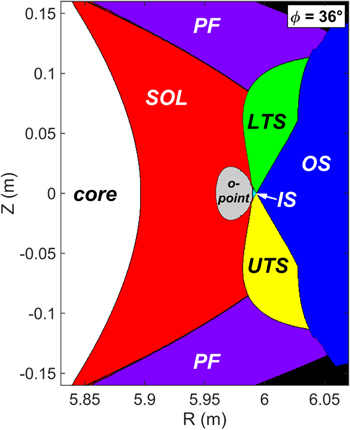
Figure 3. Contours of the different topological regions of the edge magnetic field within the same cross section as in the inset of figure 2. Regions include the core, confined region around the island o-point, scrape-off layer (SOL), lower-target shadowed (LTS) region, upper-target shadowed (UTS) region, inner shadowed (IS) region, outer shadowed (OS) region, and private flux (PF) region.
Download figure:
Standard image High-resolution image2.2. Expected drift directions
Due to the non-axisymmetric nature of the W7-X divertor configuration, it is naturally more difficult to develop an intuitive picture of SOL drift motions than in tokamaks. Nevertheless, the W7-X edge island topology has enough in common with tokamaks that a number of the drift flow patterns often seen in the edges of tokamaks have close analogs in W7-X.
2.2.1.
 drift
drift

One such flow pattern arises from the component of the electric field that typically points away from the LCFS and the island separatrix. This is often referred to as the radial electric field Er in tokamaks and derives from the tendency for flux tubes further away from the separatrix to have lower electron temperatures Te and therefore lower electric potential ( ) relative to the (equipotential) target [2].
The resulting poloidal drift patterns,  , are illustrated schematically in figure 4 for the case of (a) a lower-single-null tokamak configuration and (b) for the W7-X low-iota configuration. In these drawings, the direction of the magnetic field B is always assumed to be positive, which by W7-X conventions means counterclockwise when viewed from above ('into the page' in figure 4) such that B × ∇B points upward. In the tokamak case (figure 4(a)), vθ is directed counterclockwise about the core plasma. In the tokamak SOL, flow is therefore directed from the outer divertor target to the inner divertor target. In the PF region, vθ is directed from the inner target to the outer target. In the W7-X low-iota configuration (figure 4(b)), vθ in the SOL within the edge magnetic island would flow clockwise about the island o-point. This trend holds regardless of the poloidal location of the island with respect to the core plasma; hence, the effect is not canceled by the helical rotation of the island about the core LCFS.

Figure 4. Schematic depiction of radial electric fields Er and the resulting poloidal drift flows vθ in (a) lower-single-null tokamak geometry (Reproduced courtesy of IAEA. Figure from [2]. Copyright (1996) IAEA) and (b) the upper and lower island divertor geometry of W7-X in the low-iota configuration. Note that the upper and lower cross sections are not taken at the same toroidal angle ϕ0; rather, they come from angles ϕ0 and −ϕ0 at which their respective geometries are mirrored in the Z = 0 plane. The magnetic field B is assumed to point into the page in each case. Correspondingly, the direction of ion ∇B and curvature drift vi is upward.
Download figure:
Standard image High-resolution imageThe inherent up-down asymmetry of these flow patterns in W7-X arises from the topology of the flux tubes in the island. First note that, within the island, Er is primarily expected to be observed in flux tubes in the SOL. In the W7-X low-iota configuration, such flux tubes have one terminus on a lower target and the other terminus on an upper target. On both upper and lower targets, the intersections with SOL flux tubes and the targets are in the outboard side of the island, whereas the incident flux tubes in the inboard side are in shadowed regions (figure 4(b)). Following any SOL flux tube from the upper-target end to the lower-target end will result in a gradual clockwise trajectory about the island o-point. Thus, in the SOL, the clockwise poloidal drift flow tends to sweep particles away from the upper targets and toward the lower targets when the magnetic field is positive. The inverse is true when the field is negative and vθ is counter-clockwise.
An analogous argument may be made about the flow in the PF region outside the island. Here, assuming the radial electric field still points away from the island separatrix, the directions of vθ relative to the upper and lower targets would be the opposite of those within the SOL (figure 4(b)).
As discussed in section 2.1, the W7-X edge field exhibits additional topology that has no equivalent in an axisymmetric device; namely, the shadowed regions. In the W7-X low-iota configuration, these areas intersect the upper and lower targets on the inboard side of the island (figure 4(b)). Since the parallel losses in these regions will be substantially greater than in the SOL or PF regions due to the shorter Lc, the drift flow patterns may not extend all the way through these regions. In addition, since the shadowed region has no boundary with the core plasma, the principal source of plasma in this region must be perpendicular transport from the SOL and PF regions. As shown for the upper target in figure 4(b), poloidal E × B flow could serve as a mechanism for perpendicular transport from the SOL into the shadowed region. Near the lower target, on the other hand, any corresponding fluxes in the opposite direction (from the shadowed region into the SOL) would be lower in magnitude.
It should be noted that these arguments have assumed low-density, high-temperature edge plasmas in which Te does not vary much along the field lines. With rising density, however, a significant drop of Te between the LCFS and the targets is expected, especially in light of the long Lc in the SOL (figure 2). This will give rise to parallel potential gradients, leading in turn to a poloidal electric field component Eθ due to potential differences between adjacent segments of flux tubes that differ in their distance from the nearest target [2]. As shown in figure 5, this component would tend to point in the poloidal direction toward the nearest target. Thus, in the case of positive magnetic field, a radial drift flow vr in portions of SOL flux tubes closer to upper targets would be directed radially inward. Near the other end of the SOL flux tubes, closer to the lower target, vr would be directed radially outward. Similar flow patterns may also be established in the shadowed regions. Depending on the edge density and temperature, these radial flow patterns may connect the poloidal flow channels (figure 4(b)) between the SOL and PF regions to form poloidally-closed flow channels.
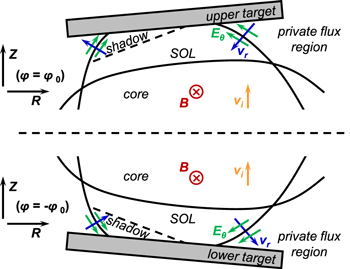
Figure 5. Schematic depiction of poloidal electric fields Eθ and the resulting radial drift flows vr in the upper and lower W7-X island divertor geometry of the low-iota configuration.
Download figure:
Standard image High-resolution image2.2.2. Diamagnetic drifts
Additional flows may arise from the diamagnetic drift, in the B × ∇p direction. The main component of this flow is divergence-free and has been shown to make no contribution to target fluxes [25]. However, other components originating from the gradient and curvature of the magnetic field may play a nontrivial role. The direction of such drifts for positive ions is illustrated as vi in figures 4 and 5; electrons would drift in the opposite direction. With that being said, in island divertor geometry the flow direction would not resonate with the helical paths of the flux tubes [11], and therefore its net effect on fluxes to the target is expected to be weaker than that of the electric drifts.
3. Experimental setup
3.1. Plasma conditions
Traces of some key plasma parameters for the discharges in this study are shown in figure 6. The plasma discharges were conducted under essentially the same conditions except for three control parameters: the magnetic field direction, the total heating power, and the gas fueling rate. The sole heating source was second-harmonic X-mode electron cyclotron resonant heating (ECRH) with absorption localized to the magnetic axis. Although no direct current drive was employed, the discharges exhibited steady increases in toroidal current (figure 6(d)) that could be attributed to the slowly-evolving bootstrap current. To control for this effect, the downstream profiles evaluated in this paper—unless otherwise indicated—were taken at the same time after the beginning of the discharge (1.1 s), at which point the toroidal current was between 0.8 and 1.5 kA. The current was always directed against the toroidal magnetic field in the discharges described here.

Figure 6. Time traces of global plasma parameters for four of the key discharges evaluated in this work: (a) ECRH heating power, (b) line-integrated density, (c) diamagnetic energy [26], and (d) plasma current. The ECRH trace was not available for discharge 20180829.009 due to a data acquisition failure; however, the programming was the same as for 20181002.047. The sign of the plasma current is such that positive current flows against the direction of the toroidal magnetic field.
Download figure:
Standard image High-resolution imageThe plasmas were fueled with hydrogen gas admitted through valves in the periphery of the vacuum vessel. The fueling rate was controlled by active feedback to maintain a defined line-integrated density, which was measured by a dispersion interferometer with an integration path length of approximately ℓ = 1.3 m [27]. The discharges shown in this paper each had one of two set points:  m−2 or 6 × 10¹⁹ m−2. In practice, the actual line-integrated density was not perfectly steady throughout the discharge and could undulate about the set point by up to 25% on time scales of approximately one second (figure 6(b)). For the edge plasma profiles shown in this paper, we will indicate the approximate measured value of the line-integrated density for the respective time points for which the profiles were recorded.
The main set of 70 superconducting coils in W7-X is driven by monopolar power supplies. To reverse the magnetic field, the electrical leads to each coil set must be physically exchanged. It is therefore not feasible to reverse the magnetic field between discharges on the same experiment day. Instead, the forward-field and reversed-field discharges were conducted on two different days within the W7-X OP 1.2b experiment campaign, five weeks apart. Nevertheless, as shown in figure 6, similar global plasma parameters were attained for corresponding cases of forward and reversed field.
3.2. Edge plasma diagnostics
The local power flux into each divertor target was determined from data collected by a system of infrared (IR) video cameras [28]. The infrared images recorded by the cameras were mapped to geometric locations across the surfaces of each divertor target [29]. This yielded a time history of the temperature distribution across each target, which was in turn used to calcuate the instantaneous power flux to the target at each time point by the THEODOR code [30].
Measurements of particle fluxes and electron temperatures on the divertor targets were carried out by two arrays of target-embedded Langmuir probes [31, 32]. The system consists of four poloidal arrays of 10 probes each. Two of these arrays are located close together on a lower divertor target at toroidal angle ϕ = −81°, whereas the other two are located on an upper target at ϕ = −63°. Due to the W7-X stellarator symmetry, the cross-section of the flux surfaces at ϕ = −81° is a mirror image in the midplane (Z = 0) of the cross-section at ϕ = −63°.
For the work in this paper, only measurements from one 10-probe array each on the upper and lower targets will be considered. The probes in these arrays were operated with a sinusoidally swept electrical bias (500 Hz, between −180 and +20 V relative to the surrounding target), permitting measurements of electron temperature, ion flux, and the net current flow from the target through interpretation of the current-bias (I–V) characteristic. To obtain steady-state values, individual parameter measurements were obtained from five consecutive sweeping cycles. The main sources of error were scatter in the data due to plasma fluctuations, as well as uncertainty in the probe collection area. In addition, uncertainty in the electron temperature values became quite high (50% or greater) when the temperature in eV approached the magnitude of the sweeping range in V due to the decreased parameter sensitivity of the curve fit to the I–V characteristic.
The positioning of these probes relative to the edge magnetic islands is depicted in figure 7. As shown in figures 7(a) and (b), the divertor probe arrays span across multiple different topological regions on both the upper and lower target. The outermost three probes are positioned in the PF region. The next two are in the SOL in the island where the flux tubes have the longest connection lengths and pass close to the core plasma. The innermost five are in shadowed regions where the flux tubes have short connection lengths and never pass close to the core. As will be seen later, measurements from probes in different topological regions can have strikingly different behavior. Another parameter that varies along the probe array is the angle at which the magnetic field strikes the target (figure 7(c)). Note that while the magnetic field is nearly parallel to the target in the vicinity of the innermost probes, the faceting of the each probe tip ensures that the incident angle of the probe with the field is at least 3° [32].

Figure 7. Locations of the Langmuir probes in W7-X relative to edge magnetic islands. (a) Array of 10 probes in the upper divertor target, shown along with Poincaré data calculated for the vacuum magnetic field in the low-iota configuration. The line connecting the probes indicates the surface of the divertor target. The different colors serve to identify field lines in plot (d) that originate from corresponding probes in plot (a). (b) Array of 10 probes in the lower divertor target, shown along with contours of the connection lengths Lc of flux tubes that intersect the cross-section at each location. (c) Connection lengths Lc of the flux tubes intersecting the lower divertor probe array (left axis) and the angle of magnetic field relative to the target surface (right axis) in the vicinity of each probe (vertical dashed lines). These quantities are nominally the same for the upper-target probe array. (d) Schematic of the multipurpose manipulator (magenta lines), indicating the approximate position and orientation of the array of fluctuation probes (squares). The array, shown in the innermost position used in these experiments, can be retracted along the horizontal magenta line. Also shown are Poincaré data for the nearby edge island, as well as projections of flux tubes originating from the upper-target Langmuir probes (circles with colors corresponding to those in plot (a)). (e) Contours of Lc in the vicinity of the multipurpose manipulator.
Download figure:
Standard image High-resolution imageMeasurements of flow velocity in the PF region were taken by probes mounted on the W7-X multi-purpose manipulator [33]. The manipulator can be moved along a horizontal axis approximately aligned with the major radius of the torus, thereby allowing for radial profiles to be obtained. The poloidal velocity vθ at each radial position was determined by an array of fluctuation probes, depicted schematically in figures 7(d) and (e). The component of the flow velocity along the array was determined from spatiotemporal correlations in the fluctuations measured by different probes in the array, as described in [34]. Because the array is aligned nearly parallel to the island separatrix and perpendicular to the magnetic field, this measured velocity component is close to vθ as illustrated in figure 4(b). In addition, a set of Mach probes mounted on the manipulator head obtained the ratio of the parallel flow velocity v∥ to the ion sound speed cs [34]. From this measurement, v∥ was estimated by assuming  , where k is Boltzmann's constant, the electron temperature Te is assumed to be equal to the ion temperature, and the ion mass mi is assumed to be that of a proton. Te was measured by a triple probe, also mounted on the manipulator head.
3.3. Uncertainties in the magnetic topology
The orientation of the magnetic islands relative to the diagnostic arrays shown in figure 7 was calculated from the ideal vacuum field for the W7-X low-iota magnetic configuration. However, deformations to the coils and plasma effects such as bootstrap current and magnetohydrodynamic (MHD) equilibrium are both expected to perturb the edge islands from their ideal structure. For example, both coil deformations and bootstrap current are expected to modify the rotational transform profile. This would change the minor radius of the ι = 5/6 resonance and, therefore, move the island toward or away from the divertor targets. In particular, the boundaries between the key topographical regions along the targets—the PF region, the SOL, and the shadowed regions—would be affected.
The effects of coil misalignments on the rotational transform profile have been studied for other W7-X configurations [35] and, in one case, were found to decrease the rotational transform on the magnetic axis by up to 1%. If such an offset were applied to the low-iota configuration, it could result in an outward radial displacement of up to 5 cm of the island separatrix along the target. However, the precise offset to ι varies depending on the configuration—in one case being as low as 0.1%—and has not yet been diagnosed for the low-iota configuration.
In addition, toroidal plasma currents are known to modify the rotational transform profile, and have in fact been observed to modify upstream profiles [36, 37] and deposition patterns on the divertor targets [38]. Vacuum field line calculations for the low-iota configuration with a 1 kA filament current on the magnetic axis predict a radial shift of the separatrix along the target by approximately 1 cm.
Since the torodial currents recorded for the experiments in this study were always oriented in a direction that would tend to increase rotational transform, it is expected that the offsets due to the plasma current would tend to cancel the reduction of ι due to the coil deformations, although the net effect of the two contributions is not known at this time. Therefore, while we will indicate the positions of the topological boundaries in the edge profiles presented in section 4, the locations should be interpreted as approximate. A more precise diagnosis of the actual locations is a topic of active investigation.
Another factor that could influence the magnetic topology is the finite plasma pressure. Modeling of an equilibrium with β = 3% in the low-iota configuration by the HINT2 code predicts a substantially reduced magnetic island size compared to the vacuum configuration [39]. Although the volume-averaged β of the discharges studied in this paper was always less than 1%, such effects may still be present to a lesser degree, particularly in the higher-density discharges.
4. Edge fluxes in low-density discharges
4.1. Asymmetric loads on shadowed regions of the target
Observed power flux distributions to the divertor targets in hydrogen plasmas with a line-integrated density of 2.5 × 10¹⁹ m−2 are shown in figures 8(a), (b), (d) and (e). Each value plotted in figures 8(a) and (b) represents an average among equivalent points on four of the lower targets, whereas each value in figures 8(d) and (e) represents an average among equivalent points on five of the upper targets. The data in the top row (figures 8(a) and (d)) were taken in a discharge with a forward magnetic field, and the data in the middle row (figures 8(b) and (e)) were taken in a discharge with a reversed magnetic field but otherwise similar plasma conditions.

Figure 8. Comparison of measured power flux distributions across divertor targets with the footprints of the different topologal regions of the edge magnetic field as defined in figure 3. (a) Typical heat flux distribution on lower targets with a forward magnetic field with  m−2 and 5 MW of heating power. The distribution shown consists of averaged values for corresponding points on four lower divertor targets. (b) Similar to (a), but with a reversed magnetic field. (c) Footprints of certain edge topological regions, as indicated by the strike points on a lower target of field lines originating from the cross-section shown in figure 3 as well as four other similar cross-sections in the corresponding symmetry planes. (d) Heat flux distribution across upper targets under similar conditions as in (a), averaged among corresponding points on the five upper targets. (e) Similar to (d) but with a reversed magnetic field. (f) Similar to (c), but for an upper divertor target. Vertical dotted lines (−81° in (a)–(c); −63° in (d)–(f)) indicate the locations the Langmuir probe arrays on the lower and upper targets. Vertical dashed lines (−88° in (a)–(c); −54° in (d)–(f)) indicate approximate boundaries of shadowed regions. The × mark on each of these dashed lines denotes the radial location of the boundary of the SOL and PF regions as shown in red and purple, respectively, in (c) and (f) at R = 5.315 m.
Download figure:
Standard image High-resolution imageOverall, the distributions across the targets have a similar qualitative appearance: a narrow, nonaxisymmetric strike line extended in the toroidal (ϕ) dimension. However, there are some noticeable differences between the distributions on the upper and lower targets. For example, with a forward magnetic field, there is a region on the left-hand side of the lower target (to the left of the vertical dashed line in figure 8(a), −91° < ϕ < −88°) receiving intermediate levels of heat flux (≈2 MW m−2) with a relatively wide extent in the major radial (R) dimension compared to the rest of the strike line. On the other hand, the radial extent of the loaded area in the equivalent portion of the upper divertor (to the left of the dashed line in figure 8(d), −56° < ϕ < −53°; note the reversed direction of the axis) is lower, comparable to that of the rest of the strike line. In addition, the deposition near the vertical dashed line is concentrated below the × mark denoting R = 5.315 m on the lower target (figure 8(a)), whereas the deposition is concentrated above this mark on the upper target (figure 8(d)). Finally, this discrepancy is reversed in discharges with a reversed magnetic field (figures 8(b) and (e)).
An important property of the areas of interest (i.e. to the left of the vertical dashed lines in each subplot of figure 8) where this up-down asymmetry is observed is that the incident flux tubes are shadowed from the core plasma by other target modules. This can be seen in figures 8(c) and (f), which show the footprints on lower (figure 8(c)) and upper (figure 8(f)) target modules of the topological regions identified in figure 3. Since there is no direct path from these regions of the target to the core plasma, the oberved heat loads must arise from perpendicular transport within the island. Furthermore, since the loading pattern is strongly dependent on the direction of the magnetic field, perpendicular drift flow is likely to be a substantial or dominant contributor.
For a full understanding of the mechanisms driving the up-down profile asymmetries, a three-dimensional model accounting for the interactions between the island topology and the discontinuous divertor target structures will likely be required. Such detailed modeling is beyond the scope of this paper. However, given the specific nature of the shadowed regions that intersect the targets in the areas of interest (i.e. left of the dashed lines in figure 8), the observed heat flux distributions are qualitatively consistent with the poloidal E × B flow patterns (vθ) described in section 2.2.1 and figure 4(b). First, note that the area of interest on the lower target is in the LTS region as defined section 2.1 (figure 8(c)), whereas the area of interest on the upper target is in the UTS region (figure 8(f)). With a forward magnetic field, vθ is expected to flow clockwise about the island o-point in the SOL, meaning that plasma would tend to drift from the SOL into the LTS region (figure 9(a)). This agrees with the presence of a heated patch on the lower target in the portion of the LTS footprint that shares a boundary with the SOL footprint (i.e. to the left of the dashed line and below the × mark in figure 8(a)). With a reversed magnetic field, on the other hand, vθ would flow counter-clockwise about the o-point, resulting in drift from the SOL into the UTS region (figure 9(b)). This is consistent with the observation, under reversed-field conditions, of an area of deposition on the upper target in the portion of the UTS footprint that shares a border with the SOL footprint (i.e. to the left of the dashed line and below the × mark in figure 8(e)).

Figure 9. Schematic illustration of poloidal drift flow (vθ) patterns in the SOL and PF regions at the cross-section at ϕ = 36°. Topological regions are colored according to the definitions in figure 3.
Download figure:
Standard image High-resolution imageIn addition, note that vθ in the PF region is expected to flow anti-parallel relative to vθ in the SOL. In the case of forward field this would imply that, whereas plasma in the SOL would tend to drift into the LTS region, plasma in the PF region would tend to flow into the UTS region. This is consistent with the observation of a streak of deposition in the portion of the UTS footprint that shares a boundary with the PF footprint (left of the dashed line and above the × mark in figure 8(d)). Correspondingly, in reversed field, when plasma would drift from the PF region into the LTS region, we see that a streak of deposition appears on the portion of the LTS region that shares a boundary with the PF region (to the left of the dashed line and above the × mark in figure 8(b)).
4.2. Radial offsets in strike lines
Asymmetric flux patterns were not only observed in shadowed regions of the target, but also in the main strike lines. Figure 10 shows radial profiles of divertor downstream parameters in the same discharges as shown in figure 8. The data in the left-hand column (figures 10(a)–(c)) were taken in the discharge with a forward magnetic field, and the data in the right-hand column (figures 10(d)–(f)) were taken in the discharge with reversed field. All profiles in this figure were acquired 1.1 s after the start of the discharge. Langmuir probe results presented in this paper were averaged over time intervals of 50 ms centered at the respective discharge time point.

Figure 10. Radial profiles of divertor plasma parameters with 5 MW ECRH heating power and a line-integrated density of 2.5 × 10¹⁹ m−2. (a) Power flux density to the target as measured by infrared cameras, showing profiles from equivalent locations on multiple upper and lower target modules; (b) Parallel ion saturation current density on upper and lower targets as measured by Langmuir probes; (c) Electron temperature as measured by Langmuir probes; (d)–(f) similar to (a)–(c) but with the magnetic field in the reversed direction. The power flux measurements in (a) and (d) are precise to within 0.2 MW m−2. Vertical lines indicate the approximate boundaries between different topological regions, indicated with labels in plots (b) and (e) according to the definitions in figure 3. Note that 'UTS' only applies to the upper-target profiles, whereas 'LTS' only applies to the lower-target profiles. Heat flux values derived from infrared emission from the Langmuir probes are ignored and appear as gaps in the curves for the upper divertor targets at ϕ = −63° in plots (a) and (d).
Download figure:
Standard image High-resolution imageFigure 10(a) shows nine overlain radial profiles of power flux to the target as measured by infrared cameras. The profiles in blue shades were taken from the upper target modules at toroidal angles of ϕ = −135° + 72° x for x = 0, 1, 2, 3, 4. As they are separated by intervals of 72°—the toroidal periodicity of W7-X—the cross-sectional geometry of both the magnetic field and the divertor targets at each of these toroidal angles is nominally the same. The angle ϕ = −63° (x = 1) corresponds to a profile across the upper-divertor Langmuir probe array to allow for direct comparison. In this profile, IR data from the locations of the probes are ignored (and appear as gaps in the plotted curve), as the probes are hotter than the surrounding target due to their interaction with the plasma. The profiles in red shades come from the lower target modules at toroidal angles of ϕ = −153° + 72° x for x = 0, 2, 3, 4. The lower-divertor Langmuir probe array is located at ϕ = −81°, although corresponding IR heat flux data for this particular location (x = 1) is not yet available. The locations of the probe arrays within their respective targets are shown as dotted lines in figure 8.
At each of the locations of the profiles of heat flux to lower targets in figures 10(a) and (d), the cross-sectional target and magnetic field geometry is a reflection in the r-axis of the cross-sections shown for the upper targets. Hence, edge modeling conducted to date, which does not account for the effects of drifts, would predict that the radial profiles of power flux to the targets at the upper- and lower-target locations should be identical.
As shown in figures 10(a) and (d), this is clearly not the case experimentally, particularly when comparing upper-target profiles (in blue) with lower-target profiles (in red). While all distributions exhibit peaks near the island separatrix (i.e. the boundary between the SOL and the PF regions), as predicted by field line diffusion modeling, the precise locations of these peaks differ between upper and lower targets. Under forward-field conditions (figure 10(a)), the upper-target profiles are peaked slightly outboard relative to the separatrix, whereas the lower-target profiles are peaked slightly inboard, leading to an overall discrepancy of about three centimeters between upper-target and lower-target peaks. In addition, the lower-target profiles are broader and exhibit a tail on the inboard side of the peak. These results clearly show a violation of the up-down symmetry of the W7-X stellarator. On the other hand, the toroidal variations among the upper-target profiles and especially the lower-target profiles are relatively small by comparison and mostly within the diagnostic uncertainty range of 0.2 MW m−2, indicating that the periodic symmetry of W7-X is well-preserved in these discharges.
The corresponding profiles under reversed-field conditions shown in figure 10(d) stand in striking contrast to the forward-field results. In response to the field reversal, the upper targets and lower targets have seemingly switched places in terms of the qualitative profile characteristics: now it is the lower-target profiles that are peaked outboard relative to the upper-target profiles, and the upper-target profiles exhibit the wider distributions.
Similar discrepancies can be observed in profiles of local ion flux, as indicated by the parallel ion saturation current density jsat (figures 10(b) and (e)), and electron temperature (figures 10(c) and (f)) measured by the Langmuir probe arrays. With a forward magnetic field (figures 10(b)–(c)), the ion flux and temperature profiles are peaked in the SOL on lower targets and in the PF region on upper targets. As with the heat flux profiles, these discrepancies reverse in response to field reversal (figures 10(e)–(f)). Another feature worth noting is the existence of a second peak in ion flux (and, to a lesser degree, temperature) in the OS region near R = 5.3 m that appears only on the upper targets in the forward field case and only on the lower targets in the reversed field case. This second peak is not visible in the power flux profiles due to two underlying differences at this location from the region where the separatrix intersects the target: (1) the lower plasma temperature and (2) the smaller incident angle of the magnetic field on the target (figure 7(c)). A more detailed comparison of the Langmuir- and IR-derived profiles is given in the appendix.
Since the observed asymmetries depend so strongly on the direction of the magnetic field, it is likely that edge drift effects are a significant underlying cause. As with the observation of heated regions in the shadowed areas of the target described in section 4.1, the strike line asymmetries are qualitatively consistent with the poloidal E × B drift patterns described in section 2.2.1. First, the existence of such flows is supported by the temperature profiles. In all cases, temperatures exhibit sharp peaks near the island separatrix and drop off rapidly on either side. This temperature gradient implies the existence of electric fields in the SOL and in the PF region that both point away from the island separatrix, which is an underlying assumption for the formation of the poloidal drift flow patterns depicted in figure 4(b).
The locations of the peaks in heat flux and ion flux also appear to be consistent with the poloidal E × B flow pattern. In all cases, the power flux and ion flux are peaked on the side of the island separatrix on which drifts are expected to flow toward the divertor target. In the forward-field case, for example, these quantities are peaked inside the SOL on the lower target and in the PF region on the upper target (figures 10(a) and (b)). We note that this correlation between peak location and flow direction is not always expected or observed in magnetic confinement devices. In fact, in some models of tokamak edge plasmas, the downstream density is greater in regions where the drift flow is directed away from the target, an effect attributed to compensating parallel flows [4]. However, tokamak edge geometry has some important differences relative to island divertor geometry; in particular, the pitch angle of the magnetic field lines relative to the x-points is larger, and the connection lengths are correspondingly shorter (<100 m in tokamaks compared to several hundered meters near the island separatrix in W7-X). As argued in [11], under such conditions the parallel flow cannot compensate the drift flow, causing the density and heat flux to both be greater where the drift flow is directed into the target. This tendency was observed in low-density diverted plasmas in W7-AS [11].
Finally, the inboard broadening of the flux profiles on lower targets under forward-field conditions and on upper targets under reversed-field conditions might be explained by the same mechanism driving the heat deposition in shadowed regions described in section 4.1. In particular, the broadening occurs primarily within the LTS region in forward field and the UTS region in reversed field, in correspondence with the regions expected to receive drift flows from the SOL (figure 9).
4.3. Flow velocity in the PF region
Further evidence in support of the existence of a poloidal E × B flow pattern can be seen in the comparison between divertor temperature distributions and edge poloidal velocity profiles for different low-density discharges shown in figure 11. Two of the profiles shown were taken in discharges with a forward magnetic field; the other two with a reversed field. For each field direction, one profile was taken during a discharge with 2 MW of ECRH heating power and the other with 5 MW. The line-integrated density was approximately 2.5 × 10¹⁹ m−2 in all cases.

Figure 11. Comparison of poloidal velocity in the private flux region with downstream temperatures for different power levels and magnetic field directions. (a) Profiles of vθ in the PF region determined by a poloidal array of fluctuation probes on the multipurpose manipulator during a plunge occurring 2.1 s after the start of the discharge. Two data points are off the scale of the plot; these are vθ = −38 km s−1 at R = 6.090 m for the 5 MW discharge in forward field and vθ = 80 km s−1 at R = 6.082 m for the 5 MW discharge in reversed field. (b) Profiles of electron temperature along the upper divertor probe array at toroidal angle ϕ = −63° in the forward-field discharges, acquired at 1.9 s. Estimates of the temperature gradient in the PF region (R > 5.45 m, to the right of the vertical dashed line) are given for each profile. (c) Profiles of electron temperature along the upper divertor probe array in the reversed-field discharges acquired at 1.9 s.
Download figure:
Standard image High-resolution imageThe behavior of the vθ profiles relative to one another is largely consistent with the expected poloidal E × B flow patterns in the PF region. First note that, with the exception of a few millimeter-length-scale sign inversions seen in the 5 MW discharges, the sign of vθ inverts in response to field reversal. The flow direction implied by the positive sign is toward the top of the vessel, or counter-clockwise about the core plasma when looking in the positive toroidal direction. In accordance with the expectation of an outward-directed radial electric field in the PF region, vθ is positive with a forward field and negative with a reversed field.
In addition, the relative magnitudes of the velocity profiles from discharges with lower and higher heating powers are consistent with the corresponding trends in electron temperature measured by the divertor Langmuir probes. Temperature profiles from the corresponding shots in forward and reversed field are shown in figures 11(b) and (c), respectively. The profiles were taken from the upper target, from which flux tubes originating from the outermost probes intersect the path of the multipurpose manipulator (figures 7(d) and (e)). Note that for both field directions, the electron temperature gradient along the divertor in the PF region, estimated from the difference in temperature between the probes located at R = 5.52 m and R = 5.47 m, is a factor of about two greater in the 5 MW discharges relative to the 2 MW discharges. This would imply a similar difference in the radial electric field in the PF region, and, as a result, the magnitude of the drift flow velocity. While the relationships between the velocity profiles in the 2 and 5 MW discharges clearly cannot be described by a simple scaling factor, it is nevertheless the case that faster flow rates overall are observed in the 5 MW discharges.
4.4. Parallel and perpendicular flow
A further indication of the importance of E × B transport in the low-density regime can be seen through a comparison of the poloidal and parallel components of the flow velocity in the PF region. Two comparisons of poloidal vθ and parallel v∥ flow velocity are shown in figure 12, obtained from manipulator plunges in discharges with 2 MW (figure 12(a)) and 5 MW (figure 12(b)) of heating power. While the low-power discharge (20180829.015) in figure 12(a) is the same as the low-power, forward-field discharge shown in figure 11, a different discharge was used for the 5 MW case in figure 12(b) (20180829.008) because the Mach probe suffered arcs in discharge 20180829.009. Note that, similarly to discharge 20180829.009, the vθ profile exhibited negative excursions, but these excursions occured in different places: R = 6.081 m, 60.83 m, and 6.085 m for 20180829.008; and R = 6.084 m, 6.087 m, and 6.091 m for 20180829.009. The underlying plasma conditions for the two discharges were the same. We therefore conclude that these excursions are caused by transient, localized plasma fluctuations and will ignore them for the purpose of comparing velocity profiles.
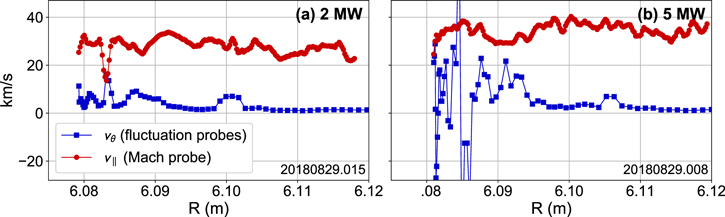
Figure 12. Poloidal and parallel components of the flow velocity in the private flux region in low-density plasmas with (a) 2 MW and (b) 5 MW heating power. Both discharges shown here have a forward magnetic field.
Download figure:
Standard image High-resolution imageTo compare the large-scale tendencies of the velocity profiles from different experiments, we consider the average value of each profile within a radial range near the island separatrix, which we choose to be R ≤ 6.10 m. The standard deviation of the values in this range will be interpreted as an error bar. In the lower-power discharge (figure 12(a)), v∥ has a mean value of 29 ± 3 km s−1. The mean value of vθ in this region was 5 ± 3 km s−1. In the discharge with higher heating power (figure 12(b)), the mean v∥ for R ≤ 6.10 m was 33 ± 3 km s−1, while vθ, ignoring the negative swings as well as one positive outlier at R = 6.085 m, was 12 ± 8 km s−1. In summary, vθ was approximately 1/6 v∥ for R ≤ 6.10 m in the 2 MW discharge, whereas vθ was approximately 1/3 v∥ in the 5 MW discharge.
While v∥ exceeded vθ in both cases, vθ is high enough in principle to essentially determine the transit time for particles flowing from upstream to downstream positions in the PF region. This is because parallel connection lengths Lc in the PF region reach values of 200 m or more near the island separatrix, whereas the perpendicular distance to the target is on the order of the perimeter of the edge island in the poloidal cross-section, approximately 1 m. Hence, whereas parallel-streaming particles would travel from upstream to downstream in a time on the order of 1 ms in the absence of drift flow, the perpendicular component would sweep the particles from upstream to downstream in a time on the order of 10 μs.
5. Edge fluxes in higher-density discharges
5.1. Modified heat and particle flux profiles
The shapes and magnitudes of the edge profiles changed dramatically in response to changes in the plasma density. Figure 13 shows downstream profiles from discharges where the line-integrated density was nearly three times higher ( m−2) than in the discharges shown in figure 10. The heating power (5 MW) was the same in all cases.
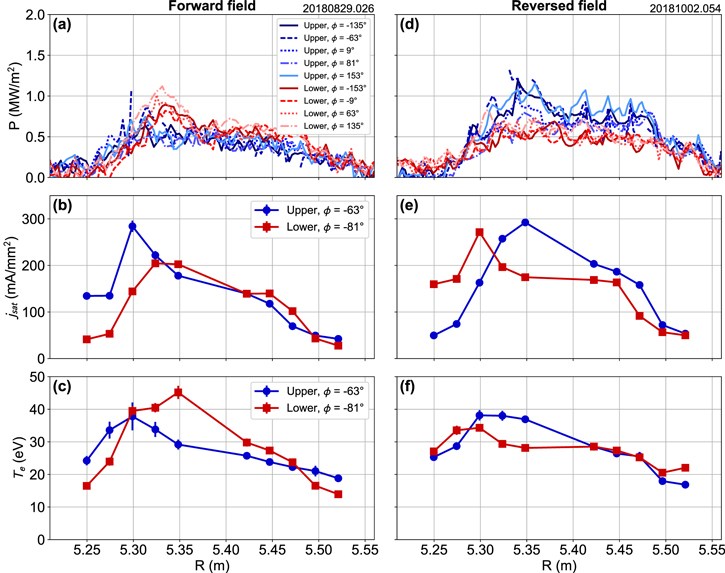
Figure 13. Similar to figure 10, but for a line-integrated density of 6.5 × 10¹⁹ m−2. Other control parameters remained approximately the same. As in figure 10, heat flux values derived from infrared emission from the Langmuir probes are ignored and appear as gaps in the curves for the upper divertor targets at ϕ = −63° in plots (a) and (d).
Download figure:
Standard image High-resolution imageThe first difference to note is that the profiles of power flux to the target (figures 13(a) and (d)) became more broad, with peak values three to six times lower than in the low-density case (figures 10(a) and (d)). In addition, the highest values in this case tended to be in regions that are shadowed in the vacuum topology (R < 5.40 m). Furthermore, the up-down asymmetries are less pronounced and more difficult to distinguish from the toroidal variations between different target modules. The most prominent field-direction-dependent asymmetry is a small, narrow peak appearing between R = 5.30 m and R = 5.35 m on the lower targets with a forward field and on the upper targets with a reversed field.
The ion flux profiles (figures 13(b) and (e)) also changed significantly in shape and magnitude relative to the low-density case. With high plasma density, the profiles have well-defined peaks between R = 5.30 m and R = 5.35 m. The location of this peak is offset on the upper target relative to the lower target, and this offset reverses along with the field reversal. Also in contrast to the low-density case, none of the profiles exhibit peaks where R > 5.45 m (the PF region in vacuum topology); rather, in all cases, the ion flux drops off steeply in this area.
The temperature profiles in the high-density discharges (figures 13(c) and (f)) did not exhibit the sharp peaking near R = 5.45 m as observed in the low density case. Instead, similarly to the ion and power fluxes, the maximum values were attained between R = 5.30 m and R = 5.35 m. The location of the peaks exhibited an up–down offset that reversed with the field direction, similarly to the ion flux profiles. The magnitudes of the temperatures near R = 5.45 m were factors of at least 5 lower than in the low-density case, but of comparable or greater values for R < 5.40 m. Since the temperature profiles in these discharges exhibit no peaks near the intersection of the island separatrix (in vacuum topology), the E × B flow patterns are not necessarily expected to match the pattern depicted in figure 4(b). On the other hand, the discrepancies in the peak locations of the ion flux (figures 13(b) and (e)) might be explained by radial drifts, depicted in figure 5, that would push particles radially outward near the lower targets and inward near the upper targets in a forward field (and oppositely in a reversed field).
In contrast to the results observed at low density, the particle and energy flux distributions observed at line-integrated densities of 6.5 × 10¹⁹ m−2 do not conform to the typical picture of a diverted plasma, in which particle and energy flux are both expected to be concentrated near the intersection of the separatrix with the target. However, some of this behavior has been observed previously in stellarator island divertors. In particular, the presence of particle-flux peaks in the shadowed region of the island whose locations shift in response to field reversal was also seen in high-density diverted plasmas in W7-AS [13]. The causes of these effects are not fully understood, although the dependence on field reversal indicates that particle drifts play a significant role. The lack of peaking in power and particle fluxes near the nominal intersection point of the island separatrix with the target at R ≈ 5.45 m could indicate that the edge topology has changed substantially in response to the increased plasma β. In addition, the flux distributions may be affected by increases in perpendicular transport in the edge due to the higher plasma density. More detailed modeling will be necessary determine the contributions of each of these effects to the observed flux patterns and is left as future work.
5.2. Non-ambipolar current flows
Interestingly, an additional asymmetric effect was observed in these higher-density discharges; namely, in profiles of the net parallel current flowing out of the divertor targets. This quantity was estimated by the Langmuir probes as the amount of current each probe drew when its voltage bias relative to the target was approximately zero. The absolute current measurements were scaled according to the probe geometry and local field orientation to give the current density parallel to the magnetic field.
Profiles of this quantity, jtarget, are shown in figure 14 for both the low- and higher-density discharges. In the lower-density cases (figures 14(a) and (c)), the target exhibited relatively little net current flow—at least in the vicinity of the Langmuir probes—and up-down asymmetries did not exceed the measurement uncertainty. On the other hand, for the higher-density discharges (figures 14(b) and (d)), notable currents were observed, concentrated between R = 5.25 m and R = 5.35 m. These peaks in current had opposite signs for the upper and lower target: in forward field, a net flow of ions was observed into the upper target, whereas a surplus of electrons was seen to flow into the lower target. At the peaks of these distributions, the up-down discrepancy was approximately 150 mA mm−2. Also of note, the signs of the distributions reversed along with the direction of the field.
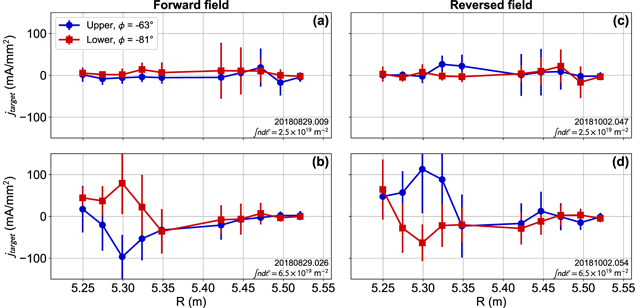
Figure 14. Profiles of parallel current density flowing out of the target as measured by the divertor Langmuir probes. Positive values indicate a net flow of electrons into the target. (a) forward field, low density; (b) forward field, higher density; (c) reversed field, low density; (d) reversed field, higher density.
Download figure:
Standard image High-resolution imageWhile the mechanism driving this discrepancy in target current flow is not fully understood, its strong dependency on the magnetic field direction is a clear indication that it is driven by particle drifts. Such current flows have been predicted as a result of poloidal E × B flows in tokamak SOLs [4, 40], although the W7-X island divertor topology may be too different to allow for a direct comparison. A contribution to this effect may also arise from curvature drift. This would tend to push ions toward upper targets and electrons toward lower targets in forward field, which agrees with the signs of the observed profiles.
6. Conclusions
In summary, a series of experiments has been carried out in W7-X to assess the impacts of edge drift flows on particle and heat fluxes to the divertor targets. The drift effects were isolated by comparing measurements from similar discharges with forward and reversed magnetic fields. Substantial asymmetries in flux distributions were observed between upper and lower divertor targets, violating the up-down symmetry of W7-X. Furthermore, the asymmetric features essentially switched places in response to field reversal. This strong dependence on field direction indicates that drifts are the dominant cause of asymmetries in the W7-X low-iota configuration.
In the lowest-density plasmas tested, the power flux formed sharply-peaked strike lines near the intersection of the island separatrix with the target, but the peaks exhibited a radial offset of 3 cm between upper and lower targets. The accompanying temperature and ion flux profiles, as well as measurements of upstream flow velocity, suggest that the asymmetry is driven by poloidal E × B flows arising from a radial electric field directed away from the LCFS and island separatrix. Observations of asymmetric heat fluxes in shadowed regions of the target are also consistent with the existence of such flow patterns. Consideration of the particular topographic regions in which asymmetric features were observed is essential to this interpretation.
While such drift flows are similar to E × B flows in tokamak edge plasmas, many of the effects observed in W7-X have no analog in axisymmetric devices. This is due to the nonaxisymmetric island divertor structure that consists of a helical island intersecting a set of discontinuous targets. This configuration gives rise to flux tubes in the SOL and PF regions that contact the targets in some places and run adjacent to shadowed flux tube segments in others. It is for this reason that existence of poloidal E × B flow in the edge can explain both the radial offset of the strike line and the observation of heat loads in shadowed regions: the asymmetric perpendicular flows from the SOL and PF regions are deposited partly onto the targets and partly into the shadowed regions.
At higher densities, the downstream fluxes were quite different. Power flux, ion flux, and temperature all exhibited wider distributions with peaks located radially inward from the peaks observed in the low-density discharges. Peak locations in ion flux and temperature still exhibited up–down asymmetries that reversed in response to field reversal. In addition, net current flows to the targets were observed for which the sign was different on upper and lower targets and which negated upon field reversal.
The experiments in these studies were carried out in the W7-X low-iota configuration, which has not been used for most W7-X experiments to date. The configuration was nevertheless advantageous for these studies for a number of reasons, including its relative insensitivity to resonant error fields that would otherwise deform the edge islands and convolute the contributions of drifts to the asymetric load patterns.
Nevertheless, the findings from these experiments may prove useful in interpreting asymmetries in edge fluxes in other W7-X configurations or in other stellarators with island divertor topology. Of course, no two configurations will have the same patterns of deposition on the divertor, and the locations of the asymmetric features caused by drifts will also not necessarily be the same. Still, any island divertor configuration may exhibit analogous topological features to those of the W7-X low-iota configuration, including a SOL, PF regions, and shadowed regions. While the spatial arrangement and target footprints of these regions will likely vary between configurations, the approach employed in this paper of assessing the relationship between the edge topology and drift flow patterns can, in principle, be applied to each configuration to explain or predict asymmetries in fluxes to the divertor targets. The fact that other devices with island divertors have reported up-down asymmetries that are qualitatively similar to those documented in this paper—for example, radial offsets in the peaks of particle flux distributions on upper and lower island divertor targets in W7-AS [13]—gives cause for optimism that the findings in this paper can be generalized.
Although we have proposed physical interpretations for some of the observed effects, a full understanding will require more detailed three-dimensional modeling of the edge plasma. This will be crucial for distinguishing the contributions of various effects—for example, edge drifts, transport channels, β effects, toroidal plasma currents, and coil misalignments—to the observations presented in this paper. The higher-density cases in particular call for further investigation, including MHD simulations to isolate the changes in edge magnetic topology due to increased plasma β. In addition, edge transport modeling will be crucial to distinguish the effects of drift flows from diffusive mechanisms, as well as to differentiate between the contributions of the different drift flows discussed here (poloidal E × B, radial E × B, and curvature drift). We hope that the striking asymmetric effects observed in these experiments will serve as motivation for further theoretical investigations and, in particular, the incorporation of drift effects into 3D edge modeling codes.
Acknowledgments
This work was carried out within the framework of the EUROfusion Consortium and has received funding from the Euratom Research and Training Programme 2014–2018 and 2019–2020 under Grant Agreement No. 633053. The views and opinions expressed herein do not necessarily reflect those of the European Commission.
: Appendix. Comparison of Langmuir probe and infrared measurements
To estimate the power flux density to the target using Langmuir probe measurements, we employ the following expression:

Here, Te is the electron temperature in eV, jsat is the ion saturation current density in A m−2 in the direction parallel to the magnetic field, and θ is the angle between the magnetic field and the target in the vicinity of the Langmuir probe as plotted in figure 7(c). δ is the dimensionless sheath transmission factor as defined in [41]. This factor, which is in general nonuniform across the target, depends on a number of quantities that are not presently measured in the W7-X downstream plasma, including the ratio of ion temperature to electron temperature, the effective ion charge, and secondary electron emission. For the purposes of this paper, we will not attempt to calculate δ directly; rather, we will assign to it a uniform value that that brings the peak values of Langmuir probe P profiles into agreement with the the peak values obtained by the IR camera measurements. Accordingly, for all data shown in this section, we have used δ = 4. This value is similar to values determined from first-principles modeling (6 < δ < 9) and within the range of empirically measured values in some tokamaks (2 < δ < 40) [42].
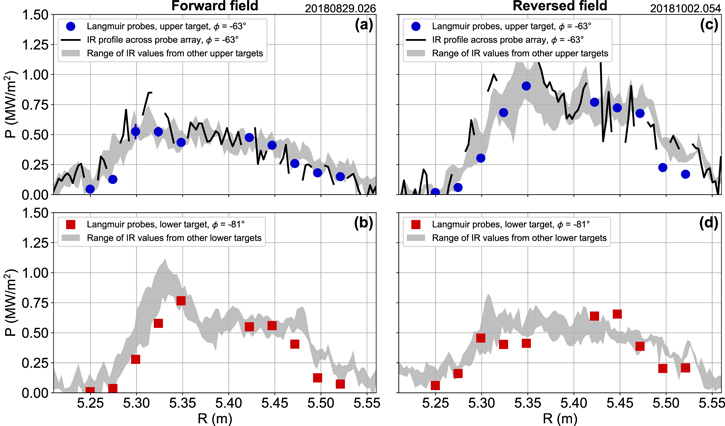
Profiles of the heat flux density P obtained from the Langmuir probes in low-density discharges in forward and reversed field are compared with measurements by the IR cameras at corresponding locations in figure A1. The data points for the Langmuir probe-derived estimates of P are based on the measurements of Te and jsat shown in figures 10(b), (c), (e) and (f), applied to equation (A.1) with δ = 4. For the upper-divertor targets (figures A1(a) and (c)), profiles of P as derived from measurements of IR emission from a line segment extending across the probe array are shown for a direct comparison. Regions of this segment coinciding with the probes themselves are ignored, as the IR emission from the probes cannot be used to calculate the heat flux to the target. Similar calculations from IR emission for a line segment across the lower-divertor probe array are not yet available. Also shown for comparison is a stripe representing the range of P values obtained from IR measurements along line segments at equivalent locations on the other upper targets (figures A1(a) and (c)) and lower targets (figures A1(b) and (d)). These represent the maximum and minimum values of the profiles that are plotted individually in figures 10(a) and (c), excluding the profiles for ϕ = −63° on the upper target.

Figure A1. Comparison of measurements of heat flux density to the targets by the infrared cameras and the divertor Langmuir probes. (a) P obtained from the upper-target Langmuir probes at toroidal angle ϕ = −63°, P obtained from IR emission along a line segment through the upper-target probe array (ignoring emission from the probes themselves), and the range of values obtained from IR emission along segments at equivalent locations on the other four upper targets; (b) P obtained from the lower-target Langmuir probes at ϕ = −81° and the range of values obtained from IR emission along segments at equivalent locations on the other four lower targets; (c)–(d) similar to (a) and (b), respectively, but with a reversed magnetic field.
Download figure:
Standard image High-resolution imageOverall, the agreement between estimates of P derived from the Langmuir probes and IR measurements is quite good and mostly within the respective uncertainty ranges. Perfect agreement is not to be expected, as the sheath transmission coefficient δ (equation (A.1)) is treated here as an arbitrary scaling factor with the same value (δ = 4) at all locations, which is not necessarily the case in reality. With that being said, δ is not expected to vary as sharply across the target as the variations in parallel particle flux density (correlated with jsat), energy per particle (correlated with Te), and strike angle θ, which are explicitly included in equation (A.1) and are the primary drivers of the variation in P.
While jsat sometimes exhibited prominent secondary peaks R ≈ 5.30 m (figures 10(b) and (e)), such peaks are not seen in the profiles of P derived from jsat and Te. This indicates that such peaks in jsat are not inconsistent with the IR-derived P profiles, which in fact agree well with the probe-derived P profiles at R ≈ 5.30. The prominence of the jsat peak at this location relative to near the SOL/PF boundary at R ≈ 5.45 does not translate to similar prominence in the P profile due to multiplication by sinθ and Te, whose values are relatively low at R ≈ 5.30 compared to R ≈ 5.45 (figures 7(c), 10(c) and (f)).
Importantly for the purposes of this paper, the up-down asymmetries seen in the IR-derived P profiles are corroborated by the probe-derived P profiles. The P profiles from both diagnostics show a radial offset of the peak location between upper and lower targets that reverses in response to field reversal. Both diagnostics also agree on the presence of a tail in the shadowed region (R ≲ 5.40 m) of the lower target in forward field and the upper target in reversed field.
Finally, a similar comparison between IR-derived and probe-derived measurements of P profiles for the higher-density plasmas are shown in figure A2. Similarly to the low-density case (figure A1), the agreement between the two diagnostics is quite good. In fact, if the uncertainty in the IR-derived measurements of ±0.2 MW is taken into account, there is no discernable disagreement. As with the low-density plasmas, the sheath transmission coefficient δ for the probe-derived P estimates was assumed to be 4 at all locations. Since good agreement was obtained in both cases with the same value of δ, this single, uniform value appears to be robust across multiple regimes of power flux, particle flux, electron temperature, and net current to the target. A more detailed study of the dependence of δ on different plasma conditions is ongoing.
Figure A2. Similar to figure A1, but for the case of the higher-density plasmas for which results are shown in figure 13.
Download figure:
Standard image High-resolution image