
Abstract
In order to develop a laser-driven spin-polarized 3He-ion beam source available for nuclear-physics experiments as well as for the investigation of polarized nuclear fusion, several challenges have to be overcome. Apart from the provision of a properly polarized 3He gas-jet target, one of the biggest milestones is the demonstration of the general feasibility of laser-induced ion acceleration out of gas-jet targets. Of particular importance is the knowledge about the main ion-emission angles as well as the achievable ion-energy spectra (dependent on the optimal set of laser and target parameters). We report on the results of such a feasibility study performed at PHELIX, GSI Darmstadt. Both 3He- and 4He-gas jets (ngas ∼ 1019 cm−3) were illuminated with high-intensity laser pulses,  . The main ion-emission angles could be identified (±90° with respect to the laser-propagation direction) and the ion-energy spectra for all ion species could be extracted: for the optimal laser and target parameters, the high-energy cut-offs for He
  ions were 4.65 MeV (with a normalized energy uncertainty of
  ) and 3.27 MeV (
 ), respectively.
Export citation and abstract BibTeX RIS

Original content from this work may be used under the terms of the Creative Commons Attribution 3.0 licence. Any further distribution of this work must maintain attribution to the author(s) and the title of the work, journal citation and DOI.
1. Introduction
Helium-3, especially in a nuclear-polarized state, is of particular importance for fundamental research. The nuclear spin is basically carried by the single neutron in the nucleus, since the proton spins are oriented anti-parallel. That is why polarized helium-3 can be used [1], for example, as a polarized neutron target for the investigation of the neutron structure by scattering with polarized electrons [2]. For particle physics the use of polarized 3He-ion beams in storage rings would be advantageous.
Helium-3 gas can be polarized with long lifetimes at ambient room temperature and low magnetic holding fields ( ). However, realizing an intense spin-polarized 3He-ion source with high polarization degrees is extremely challenging. Up to now, only a few approaches have been made [3–5], but the desired particle currents or an adequate beam polarization could not be realized so far. At Brookhaven National Lab's Relativistic Heavy Ion Collider (RHIC) attempts are now being made to develop a spin-polarized helium-3 ion-beam source [6].
Compared with conventional acceleration technology, laser-driven particle acceleration is an ever more promising field of research as the achievable laser intensities have been increased continuously during the past decades. Therefore, new applications for laser and also particle physics are opened. Regarding spin carriers such as protons, deuterons or helium-3 ions, for instance, an open question in this context is the influence of the strong laser and plasma fields on the spins of the accelerated particles. In general, two scenarios are possible: either the magnetic fields of the incoming laser beam or the formed plasma will manipulate the spin orientation of the particles, or, thanks to the short time scales of the laser-plasma interaction, the spins are sufficiently inert that the laser pulse has no influence on the spin alignment of a pre-polarized target. The first scenario (i.e. polarization creation by laser-particle interactions) has already been experimentally investigated for protons with conventional foil targets by spin-dependent hadronic proton scattering off silicon nuclei [7]. The second one, i.e. polarization conservation in plasma fields, is in the current focus of examination of the authors' collaboration.
A proof of polarization conservation in a (laser) plasma would open up the possibility of laser-induced inertial confinement fusion with spin-polarized fuel, in which the cross-sections for nuclear fusion reactions can be enhanced, leading to higher energy yields compared to the case of unpolarized fuel [8, 9]. The proof of nuclear spin-polarization conservation inside a (laser-induced) plasma is of high relevance for fusion science.
For a laser-acceleration experiment, a suitable polarizable target has to be chosen. While most of the polarizable materials either have to be handled at cryo temperatures of a few K or in high magnetic fields of several T, 3He gas can be handled easily regarding the pre-polarization procedure as well as the manageability in a realistic laser experiment (mT holding fields and no cryostatic technology). The spin-relaxation time of stored 3He gas within a vacuum chamber depends on several conditions, like the gas pressure in the vessel or magnetic field gradients within the magnetic storage field, e.g. due to conventional solenoid valves or magnetic materials at the surface [10]. Polarized 3He can be compressed to about 3 bar with moderate relaxation times—but such a gas-backing pressure is not sufficient for laser-induced ion acceleration out of gas-jet targets, so that the intrinsic pressure has to be increased. Hence, a proper layout of a polarized 3He target is required [11]: an adequate magnetic holding field that fits into the vacuum chamber as well as a non-magnetic fast-opening gas supply (i.e. a self-made fast piezo-driven valve) combined with a pressure enhancer and an ion polarimeter. The most important issue for preserving the polarization is the ionization process: when the time between singly and fully ionizing the nuclear polarized atoms is longer than the time for a hyperfine beat, the polarization is partially lost. For example, if the spin of the residual electron is oriented anti-parallel to the one of the 3He nucleon, this spin combination is not an eigenstate. Therefore, this spin will oscillate into a spin combination with both spins inversed within τHF ∼ 100 ps. Now, when the second electron is removed, the spin orientation of the 3He ion is still inversed and the nuclear polarization is lost. This results in a depolarization of the 3He ions. Thus, fully ionizing the pre-polarized helium-3 has to be accomplished in a few ps which can be achieved with the available laser intensities. Regarding the second scenario, there is no experimental data given which would lead to a scientifical estimation of the behavior of nuclear spins ( ) in laser-plasma fields (
 , temporal continuance of (102 ... 103) fs). Hence, it has to be experimentally studied if the spin-polarization can survive the harsh plasma environment during laser-target interaction.
Since the 1990s, ion-acceleration experiments employing gaseous targets, to be more precise 4He gas-jet targets, have been conducted for various laser and target parameters [12–18]. Here, the ion-acceleration mechanisms have been described regarding the specific regimes. The first experiments at the VULCAN laser facility (50 and 180 J on target, pulse durations between 0.5 and 0.9 ps,wavelength of 1.064 μm, focus intensities of ∼1 × 10²⁰ W cm−2, maximal plasma densities of 5 × 10¹⁹ to 1 × 1020 cm−3) yielded helium-ion energies from ∼4 MeV up to ∼13 MeV in the transverse direction (ion-emission angles between 90° and 100°). The ion-energy spectra have locally been obtained with the help of ion spectrometers which had been positioned at specific angles with respect to the laser-propagation direction. The ion-acceleration mechanism in the predominant direction could be explained with ponderomotive expulsion of plasma, charge separation and Coulomb explosion, which can be enhanced by collisionless shock acceleration. In 2006, for the first time Willingale et al discovered energetic helium ions (45 MeV) in forward direction. The experiments were also conducted at the Vulcan laser (PW class: 340 J on target, pulse duration of 1.0 ps, wavelength of 1.064 μm, focus intensities of ∼5 × 10²⁰ W cm−2, maximal plasma densities of 4 × 1019 cm−3). The main ion-acceleration mechanism for this set of laser and target parameters was explained to be TNSA-like (target normal sheath acceleration). More recently in 2019, Puyuelo-Valdes et al conducted experiments at the PICO2000 facility at LULI (pulse duration of 1 ps, wavelength of 1.053 μm, focus intensity of 4 × 10¹⁹ W cm−2, maximal near-critical plasma density of 1.6 × 1021 cm−3, i.e. 1000 bar gas pressure). With the help of ion spectrometers at specific angles (0°, 30°, 60°, 90° with respect to the laser axis) the ion-energy spectra could be extracted: fully ionized helium could be detected at 90° and 60° (both 16 MeV) and even at 0° (8 MeV).
The experimental studies for measuring the spin-polarization degree of laser-accelerated 3He2+ ions from a pre-polarized 3He gas-jet target are planned to be performed at the PHELIX laser facility at GSI Darmstadt. Up to now, there has no experimental data been obtained applying the PHELIX laser on helium-gas jets. Of course, the sine qua non of a polarization measurement of laser-accelerated 3He2+ ions at PHELIX is a successfully demonstrated laser-driven ion acceleration out of a helium gas-jet target: experimentally and computationally obtained data on helium-ion energies and the main ion-emission angles is needed for the optimization of the 3He polarimetry (preliminary results already presented at the PSTP conference [19]). With the experimental data presented in the framework of this publication, a polarization measurement of 3He2+ ions from a pre-polarized target can be conducted.
2. Experimental details
The measurements were carried out at the PHELIX laser facility at GSI Darmstadt. PHELIX is a flashlamp-pumped neodymium-doped glass (Nd:glass) laser system which delivers peak powers of up to 0.5 PW. During the beamtime, the laser pulse (beam energy after compression  J, pulse duration τL = (0. 3 ... 3.2) ps, wavelength λL = 1.053 μm) was focused using a 90° off-axis parabolic mirror (focal length of 1500 mm, f-number of 6.8). According to the PHELIX specs, the unfocused laser beam has an elliptical shape (axes: 180 and 250 mm) and by using an 1500 mm OAP typical focus dimensions of (π/4)15 × 20 μm2 can be adjusted. In the experimental beamtime, before each laser shot, the focus was aligned to a minimal spot size of about (π/4)11 × 15 μm2 (FWHM), leading to a focus intensity of the order of 1019 W cm−2. The a0 parameter can be calculated to
  .
.
Several ion diagnostics were aligned in order to gain information about the angular distribution of the laser-accelerated helium ions, their energies as well as their ionization stages. With the help of an RCF (radio chromic film) wrap-around detector close to the target, the EPOCH [20] predictions regarding the angular ion distribution were confirmed. In order to investigate the acceleration process quantitatively, three Thomson Parabola Spectrometers (TPS) were armed with image plate detectors (IPs). The TPSs were mounted at three specific angles relative to the laser axis. Thus, regarding the laser-propagation direction, the TPS battery covered the right side of the interaction zone (i.e. negative angles). On the other side as well as directly in forward direction, CR-39 SSNTDs (solid state nuclear track detectors) were positioned around the target in order to additionally detect the undeflected ion signal.
2.1. Gas-jet target
A fast-opening solenoid valve, of the Hannifin Series 9, was used as gas source for the laser-target interaction. The total valve-opening time of 7 ms was set with the IOTA ONE Pulse Driver controller box with a response time of  μm relative to the external laser-trigger signal. The shape of the gas jet, i.e. the particle-density distribution, is mainly determined by the geometry of the flanged nozzle, while the maximal initial neutral gas density is proportional to the applied backing pressure. In order to generate a broad plateau-like density distribution with sharp density gradients, supersonic de Laval nozzles have been used [21, 22]. This nozzle was made of brass (CuZn alloy Ms58/Ms63). Its minimal diameter, i.e. the nozzle throat, was 0.5 mm and the gas outlet, i.e. the exit diameter, was 1 mm which corresponds to an opening angle of 15.26° and leads to a Mach number of Msuper = 3.44. Since the particle density within the gas jet decreases with increasing height above the nozzle edge, it is important to align the nozzle as close as possible to the laser focus without clipping the beam or endangering the nozzle material (the position of the nozzle with respect to the laser pulse can be regarded in figure 2). For this purpose, cone-shaped cut-outs (pockets) were milled into the nozzle flange along the laser axis. A typical safety distance between the nozzle edge and the laser focus is ∼500 μm. During the experiments, it became obvious that the main parts of the attached equipment had not been chosen wisely for high-power laser interaction: the brass nozzle as well as the plugged valve's teflon poppet (to seal the valve when not operated) suffered from the arising plasma temperatures—especially, when applying laser energies in the range of (60 ... 120) J (after compression). Next to this obvious damage, in this case a parasitic proton signal could also be observed in the attached TPS. Therefore, the optimal laser energies for this beamtime were found to be in the range of (40 ... 60) J. For future experiments, de Laval nozzles made of titanium shall provide a better temperature resistance.
In order to gain knowledge about the temporal response of the valve (i.e. the opening and closure behavior) as well as about the particle-density distributions within the gas jet for different backing pressures, a time-resolved interferometrical characterization was conducted before the experimental beamtime (Mach–Zehnder interferometer [22, 23]: widened and cleaned He–Ne-laser beam with λHeNe = 632.8 nm, SpeedCam MegaVis CCD camera, spatial resolution of sres = 1.079 μm pixel−1, 50:50 non-polarizing beam-splitter cubes for generating two identical beamlets). The setup was aligned such that one laser beamlet propagated through vacuum (where the gas-jet source was placed) while the other one propagated through air. Afterwards, both beamlets superposed and were directed to the CCD camera. The camera recorded the magnified region around the de Laval nozzle within the horizontally aligned interference pattern, i.e. the fringes. The valve's opening time was set to 10 ms. If the valve is opened and a gas jet is built up, local changes in particle density, i.e. a varying refractive index, cause local fringe displacements which are due to a given phase shift. The CCD camera had a fix side view on the nozzle region. Therefore, only the projection of the accumulated phase shift along the laser-propagation direction could be recorded. Since the phase is proportional to the integral of the refractive index η along the optical propagation length [23] and assuming a cylindrically symmetrical gas jet, the particle-density distribution or, to be more precise, the radial refraction–index distribution within the gas jet can be deduced from the extracted 2D phase-shift data. Such an Abel inversion was performed with self-written Matlab codes. For each measurement, a movie was recorded which was split into single video frames (each 0.83 ms one frame). Together with a reference image (no gas flow, i.e. no fringe shift) the single frames (carrying the gas information, i.e. a given fringe shift) served as input for the data-analysis code. The particle-density distribution within the gas-jet region could be plotted as a 2D pseudo color plot out of which lineouts, e.g. for a desired height above the nozzle exit, could be extracted. Figure 1 exemplifies such a lineout at a height of 500 μm above the nozzle edge and for a backing pressure of p0 = 26 bar. The measured density profile can be described by a superposition of two 6th-order superGaussian fit functions: 
![$\exp \left[-{\left(x/502.03{\rm{\mu }}{\rm{m}}\right)}^{6}\right]$](https://content.cld.iop.org/journals/0741-3335/61/11/115012/revision2/ppcfab4613ieqn12.gif)

![$\exp \left[-{\left(x/800{\rm{\mu }}{\rm{m}}\right)}^{6}\right]$](https://content.cld.iop.org/journals/0741-3335/61/11/115012/revision2/ppcfab4613ieqn14.gif)
 . The symmetry axis at x = 0 μm is referred to as the central gas-jet axis. For such a pressure regime, the maximal neutral particle density around the gas-jet center
  is given with ∼5.5 × 1019 cm−3. During the PHELIX beamtime, different backing pressures were applied: in case of 4He gas, the pressures were 30 bar and 15 bar, and, in case of unpolarized 3He gas, a maximal backing pressure of 8 bar was available. The maximal particle densities for these pressure regimes in the focus height were 6 × 1019 cm−3 ≈ 0.06 nc, 3.25 × 1019 cm−3 ≈ 0.03 nc, and 1.67 × 1019 cm−3 ≈ 0.02 nc, respectively. Here, nc = 1.0 × 1021 cm−3 is the critical density for PHELIX.

Figure 1. Particle-density profile in a height of 500 μm above the nozzle exit (p0 = 26 bar): experimental data (blue dots) and 6th-order superGaussian fit function (red curve).
Download figure:
Standard image High-resolution image2.2. Angular ion distribution
2.2.1. Setup
An RCF wrap-around detector was used in order to cover a wide angular range around the plasma target. The self-made wrap-around holder, shown in figure 2, was built of aluminum. Rolled endwalls were welded on a ground plate with circular cross-section area (diameter of 104 mm). In order not to clip the focusing/diverging laser beam, an entrance/exit gap was given between the endwalls: sentr = 26.2 mm (entrance), and sexit = 20 mm (exit). Hence, at each side an angular range of 11.1–165.4° relative to the laser axis could be covered by the RCFs. The RCF wrap-around holder could be mounted directly on the valve holder without disassembling the setup. This is important since the previously defined nozzle position had not to be lost in any case. At the right side with respect to the laser axis, a bore hole in the well wall allowed to simultaneously operate the TPS at −90° during the wrap-around RCF measurements. Gafchromic HD-V2 RCF wrapped in 5 μm thick Al foil were used (dimensions of the RCFs: lrcf × hrcf = 140 × 40 mm2). These RCFs do not possess any protective layer on top of the active radiation-sensitive medium which would filter out incoming helium ions. The Al shielding is important in order to block side-scattered laser light and to protect the RCFs from arising plasma temperatures. According to Srim [24], 5.09 μm corresponds to the range of 1.6 MeV 4He2+ ions in aluminum. Thus, ions with an energy >1.6 MeV could reach the RCF's active layer. For the sake of convenience, the RCF detectors were fixed with paper-clips at the endwalls.
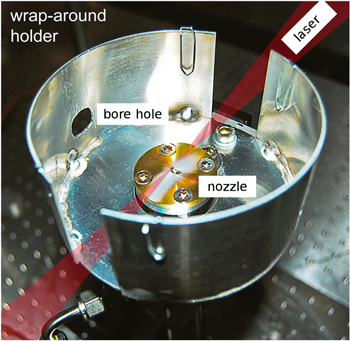
Figure 2. RCF wrap around holder for recording the angular ion distribution as well as for simultaneously measuring the ion-energy spectra at −90°.
Download figure:
Standard image High-resolution image2.2.2. Results
The RCF wrap-around measurements were conducted for the first laser shots in order to experimentally obtain the main ion-emission angles and to compare them to the EPOCH-simulation data being described in section 3 (laser-beam energy after compression 43.8 J, pulse duration 3.2 ps, which leads to a focus intensity of IL = 2. 65 × 1018 W cm−2). The original yellow RCF-dye color turns green when exposing the RCF to ionizing radiation. Due to the protective Al shielding, only x-rays and laser-accelerated He ions with energies >1.6 MeV could reach the active RCF layer, but no scattered laser light. Hence, the color change is due to ions and x-rays. It becomes obvious that a nearly homogeneous color change is present (exposure to x-rays, background (BG) signal) which is interspersed with more intense regions (laser-accelerated 4He1+,2+ ions). A 'horizontal' lineout at the height of the laser focus provides the angular ion distribution in the laser-target interaction plane: see figure 3. Here, the BG-corrected RCF data is plotted against the angle relative to the laser-propagation direction (the insert in the top right corner illustrates the RCF scan in pseudo colors from the left side with respect to the laser direction). A sharp peak in ion signal (both ion species) around ±90° with respect to the laser-propagation direction with a FWHM of 23° is given. This result is in line with the EPOCH-simulated data. Furthermore, both in forward and in backward direction intense ion signals could be detected in the angular ranges of  and
and  , respectively. In both cases, the helium ions got a vertical momentum component, i.e. ion signals could be detected above the focal plane. Moving from both RCF boundaries to the RCF center, the ion distribution narrows with increasing height. In order to investigate the ion distribution also in larger heights above the laser-target interaction region, a second RCF wrap-around measurement was conducted with Gafchromic HD-V2 RCFs with a height of 100 mm (same length as before). The basic shape of the angular distribution was comparable to the prior data. It became obvious, that with increasing height the narrowing in ion signal continues but peters out, i.e. the RCFs were exposed to less dose. Either the number of laser-accelerated
  ions decreases for these angular ranges, or the particle energies do (and since the 5 μm Al shielding filters low-energy ions, less dose will be absorbed by the RCF). The occurance of negative gray scale values is due to the BG subtraction.
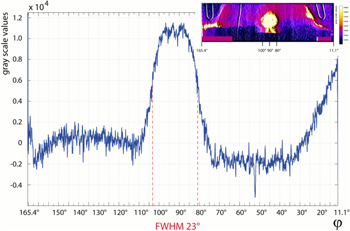
Figure 3. Angular ion distribution for the focal height (both 4He-ion species from the left side, BG-corrected data).
Download figure:
Standard image High-resolution imageDue to the fact that it is not possible to distinguish between singly and fully-ionized helium ions, this measurement served as qualitative investigation of the predominant ion-acceleration directions in the focal plane. The ion species as well as their energies cannot be extracted from the raw data. Therefore, attendant TPS measurements were conducted around −90° relative to the laser direction (see section 2.3). Here, the TPSs were aligned in the height of the laser focus.
2.3. Ion-energy spectra
2.3.1. Setup
Within the PHELIX experiment, a modified TPS was used which is based on a novel design [25, 26]. In contrast to the conventional concept, a wedge-shaped capacitor replaces the parallel electric plates. By applying HV to the modified capacitor, a gradient electric field is built up which results in an increased particle deflection. Furthermore, for the sake of a compact design, the wedge-shaped capacitor is inserted into the magnetic field.
Following the experimental results from the angular ion measurements, the three TPSs were mounted at −80°, −90°, and −100°. In the further course of this paper, the TPSs are denoted as follows: TPS-80, TPS-90, and TPS-100, respectively. The pinhole diameters (entrance into each TPS) were chosen according to the angular distribution of the accelerated ions: TPS-90 was equipped with a 200 μm pinhole (≃170 nsr), while TPS-80 and TPS-100 with less signal compared to the center TPS got a 350 μm one (≃356 nsr and ≃370 nsr, respectively). A HV of 3 kV was applied to the capacitor plates and a maximal magnetic field of 0.5 T was given.
The TPS measurements for extracting the energy spectra for both helium-ion species were performed with Agfa md4.0 IPs. These IPs are not equipped with any protective layer on top of the sensitive detector surface. Such a layer would block incoming helium ions. Due to the lack of a proper 3He-ion source as well as slitted CR-39 detector plates, the IPs could not be calibrated with  ions. Therefore, the obtained IP signals did not yield any credible quantitative information about the ion number, but the achieved ion energies could be determined for various laser-target parameters. The ion-energy spectra, i.e. the normalized signal intensity (per MeV and sr, log10-scale) against the ion energy (in MeV, lin.-scale), could be extracted from the IP scans. A TPS-analysis Matlab code was used for this purpose. Here, the zero order had to be defined manually (oversaturated single pixels), while the ion-species properties (charge, mass) as well as the field parameters (length, strength) had to be set. According to these input parameters, the code simulates the corresponding particle parabola along which the image data, i.e. the gray scale values, are extracted, and henceforward, related to the particle energies. Furthermore, the BG values are instantly subtracted. In addition, the obtained ion energies were also compared to CST(Particle Studio)-simulated data regarding the energy-deflection dependencies. For each TPS and each helium-ion species an energy-deflection fit function
  (a, b = const, a in keV m2, b in keV) could be extracted. In case of TPS-90, the parameters are a = 2.317 keV m2 and b = 24.57 keV. With the help of the CST-simulated energy-deflection fit parameters, any desired vertical deflection ytps (on the ion parabolas from the IP raw images) of a specific helium-ion species in a particular TPS directly could be transformed into the corresponding ion energy. The normalized uncertainty in energy
  , i.e. the energy resolution of a specific TPS, is determined by the size of the TPS pinhole dap at an adjusted distance l0 from the laser-target interaction region. Due to the ion 'imaging', a broadening in width of the TPs, δtp, on the detector is caused, which can be calculated via
  , where ltps is the distance between the pinhole and the detector plane inside the TPS [27, 28]. Now, the intrinsic spectrometer resolution is given by
  which leads to
  [29].
[29].
2.3.2. Results
Simultaneously to the RCF wrap-around measurement during the first laser shot ( J, τL = 3.2 ps, nmax = 0. 06 nc), TPS-90 was armed with an Agfa md4.0 IP detector. 23 min after exposure, the IP was scanned. Figure 4(c) illustrates the IP scan in pseudo colors (originally, the 16 bit .tif-files were saved in gray scale values). One pixel corresponds to 25 μm. The {x, y}tps-axes, i.e. the E–and B-deflection directions, were added to the plot. The right side of the image actually is the top side of the IP within the TPS. Two sharp TPs were recorded. Directly after having extracted the scanned data, the signals, i.e. the deflection parameters in xtps- and ytps-direction, were roughly analyzed and cross-checked with the CST-simulated data for
  ions in order to verify the experimental outcome regarding the accelerated ion species. Additional information: the BG level is increased for ytps ≳ 4.5 cm (top side of the IP) so that the low-energy branch of the ion TPs smears. The high BG signal was due to an insufficient lead shielding of the TPS housing at the beginning of the experimental beamtime. Therefore, the thickness of the attached lead sheath was doubled from 2 mm to 4 mm so that the disturbing BG signal could be suppressed. In figure 4(a) the corresponding
  ion-energy spectra are illustrated. The normalized gray scale values from the TPs are plotted against the ion energies. It has to be considered that in case of 4He1+ the minimal energies are not plotted due to the aforementioned BG issue. Therefore, energies between 0.24 and 0.5 MeV had to be cut. In case of fully-ionized He, the signal was much stronger, and thus, it was distinguishable from the BG signal. Taking into account that the gray scale values depend on the ion dose (particle number and ion energy), then roughly speaking a larger gray scale value corresponds to a larger particle number at a constant energy. The normalized energy uncertainties for a specific TP (Thomson parabola) broadening (in case of TPS-90:
  μm) are exemplified in figure 4(b). The high-energy cut-offs are given with
  MeV for 4He2+ (
 ) and
) and  MeV for 4He1+ (
 ).
).

Figure 4. (a) Ion-energy spectra, (b) normalized energy uncertainty  due to TP broadening δtp, exemplified for TPS-90, (c)
  TPs from TPS-90, recorded simultaneously to the RCF wrap-around measurements. Dashed curves: 4He1+, solid curves:4He2+.
Download figure:
Standard image High-resolution imageFor the subsequent laser shots, the RCF wrap-around holder was removed and the ion-energy spectra were obtained with TPS-80 to TPS-100. The highest signals regarding signal intensity and ion energy were recorded in TPS-90 which is in good agreement with the RCF measurements for the angular ion distribution. Both in TPS-80 and TPS-100, the signal intensities as well as the achieved ion energies were lower compared to the transversal acceleration direction. Furthermore, it could be measured that the signal intensity in TPS-80 was lower than in TPS-100 (which is in good agreement to the experimental data presented in [12]). In the further course of this paper, the focus is set on the main ion-emission angle.
During the PHELIX beamtime, laser energies between ∼40 and 120 J were available. Within the first laser shots, the optimal laser parameters for the whole experiment could be determined. Of course, the maximal laser energy was applied which led to a high ion dose on the TPS IPs (high signal intensity and an ion energy of ∼11 MeV). But, accelerating helium ions to maximal ion energies was not the goal in this feasibility study. Furthermore, laser energies between 60 and 120 J came along with a couple of disadvantages: on the one hand, the BG level regarding disturbing x-rays increased, followed by parasitic proton signals from impurities on the nozzle surface in the TPS spectra (the nozzle was cleaned with acetone beforehand—it is recommended to use isopropanol instead). On the other hand, the arising plasma temperatures caused dramatic material damage in the nozzle throat. It turned out that brass is not a suitable nozzle material for higher laser-energy shots. Instead of brass, titanium is a more temperature-resistant processible material. In the laser-energy range of 40–60 J, these problems did not occur. Instead, stable and clean IP signals could be extracted and the helium-ion energies were in the right range regarding future spin-polarization measurements of laser-accelerated 3He ions from a pre-polarized 3He gas-jet target. Thus, the further laser shots were conducted with these lower laser energies. Figure 5 illustrates  ion-energy spectra for the maximal available laser-energy (119 J) as well as for laser energies of about 40 J. The neutral particle density within the gas jet was constant (0.06 nc). In case of fully-ionized helium, the high-energy cut-off is 10.9 MeV, i.e. a factor of about 3 times (
 MeV for
  J) and 2.3 times (
 MeV for
  J) larger than in the lower laser-energy regime. For singly-ionized helium, the high-energy cut-offs are comparable to each other. Only the signal intensity is about one order of magnitude enlarged in case of the high-energy laser shot. It is obvious, that independently from the laser and density parameters (0.06 or 0.03 nc) the 4He1+ spectra were shaped in a similar vein: thermal spectrum with high-energy cut-offs of ∼2–3 MeV. In former publications, such a result (and even the presence of He1+ ions) was explained with the assumption that fully-ionized helium recombines during the propagation through the gas-jet regions, loses energy due to collisions and can pick up an electron from neutral helium atoms [12, 14]. Furthermore-regarding the high laser intensities—a nearly fully-ionized plasma would be expected. In a perfect environment this argument is true. But, regarding the ion energies as well as the gas-jet densities, the acceleration of singly-ionized atoms cannot be explained only with recombination processes. Additionally, also the contrast ratio of the attached laser pulse as well as its focusing into the gas-jet region has to be considered. Single ionization caused by the pre-pulse as well as taking place in the outer (lower-)intensity regions are a stronger explanation for the He1+-ion yield. The high-energy data are in good agreement to the experimental data in [14].
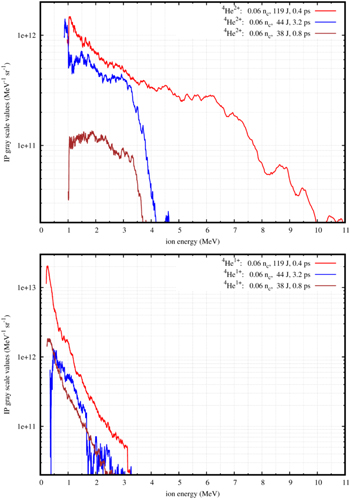
Figure 5. Ion-energy spectra for three different laser energies  , obtained in TPS-90 for
  : red curve 120 J, blue curve 44 J, and brown curve 38 J. (top) 4He2+, and (bottom) 4He1+.
Download figure:
Standard image High-resolution imageThe ion-energy spectra (fully-ionized 4,3He) for different maximal particle densities in the gas-jet target as well as different laser parameters are plotted in figure 6. In total, three different particle densities were applied: 0.06 nc and 0.03 nc for 4He, and 0.02 nc for 3He. The attached laser parameters vary for each shot ( J, τL = (0. 3 ... 3.2) ps). The largest high-energy cut-off and highest normalized signal intensity was achieved for the highest pulse duration of 3.2 ps in combination with the largest target density of 0.06 nc. On the other hand, the ion fluxes are drastically reduced at the lowest target density of 0.02 nc.

Figure 6. 4,3He2+ ion-energy spectra from TPS-90 for different maximal gas-jet densities: blue curve 0.06 nc, brown curve 0.06 nc, green curve 0.03 nc, orange curve 0.02 nc.
Download figure:
Standard image High-resolution imageWhen comparing the ion-energy spectra in figures 5 and 6 with regard to the applied laser and density parameters, diversities in the flux and high-energy cut-offs become obvious. To further discuss the experimentally obtained data and to systematically scan the target density-pulse duration parameter space, extensive EPOCH simulations were conducted (see section 3).
In order to get an impression about the ion numbers, TPS-80 was armed with a Tastrak CR-39 detector for one laser shot. In order not to run the risk of oversaturating the SSNTD, TPS-80 was chosen according to the EPOCH simulations as well as according to the RCF measurements. Furthermore, within this laser shot a decreased helium backing pressure was applied in order to ensure a decreased particle density within the gas-jet target. TPS–80 was equipped with a 350 μm pinhole which corresponds to a solid angle of 355.8 nsr. The laser-target parameters were set to:  ,
,  J, and τL = 0.3 ps leading to a focus intensity of IL = 2. 5 × 10⁻¹⁹ W cm−2. After the etching procedure, two sharp helium-ion TPs became visible on the CR-39 SSNTD. Furthermore, also the zero order which defines the origin of the TP-coordinate system was visible as a milky white spot. From the 4He ion-energy spectra the high-energy cut-offs could be determined to 3.28 MeV (
 ) for 4He2+ ions and 2.48 MeV (
 ). Within the covered 355.8 nsr, the total number of 4He2+ was 2.02 × 10⁴ and 4.92 × 10⁴ in case of 4He1+ ions. With this He2+-ion number (for 0.03 nc at 80°) a lower limit for the polarimetry reaction can be estimated. For the polarimetry, the fusion reaction D(3He,p)4He with a Q-value of 18 MeV can be used. In the polarized case (3He2+ is polarized and fuses with deuterium in a CD2 foil), a polarization transfer from the ions to the fusion protons is given which is measurable in the angular distribution of the fusion protons. Thus, an asymmetric distribution in the proton signal is expected (for instance, one receives a left-right or top-bottom asymmetry). The number of protons on each detector can be calculated by np = L × dσ(dΩ)−1 ΔΩ = N3He2+ × ρA,CD2 × dσ(dΩ)−1 ΔΩ, with the luminosity
  , the total number of 3He2+ ions N3He2+=17.84 × 10⁶ entering the polarimetry setup and hitting the CD2 foil with areal density of ρA,CD2 = 2. 7 × 1020 cm−2, the resonance value of the differential cross section of the fusion reaction of dσ (dΩ)−1 = 60 mb sr−1, and the covered solid angle inside the polarimetry (between CD2 and proton detector) ΔΩ = 6.25 sr. This leads to a proton number of 1800 per detector per laser shot which is a useful value for a polarization measurement. It has to be noted that this is the lower limit for the estimated proton yield: for the main ion-emission angle (±90°), a longer pulse duration (3.2 ps), and a higher gas-jet density (in case of polarized 3He gas: 30 bar which corresponds to 0.06 nc), this proton number will be enhanced.
Simultaneously to the TPS monitoring, CR-39 SSNTDs were mounted in different distances to the laser-target interaction region. After etching the additional CR-39 SSNTDs for data anlysis, a color change from translucent to milky/cloudy white became apparent on the target-facing surface. These colored CR-39 plates could not be analyzed with a microscope scanner since a clear transmission of light was not possible and no ion tracks were visible. The color change after etching was due to x-ray radiation from the laser-plasma interaction.
3. PIC-simulations
The laser interaction with the gas jet and ensuing ion-acceleration processes were simulated using the Particle-in-Cell (PIC) [30, 31] code EPOCH-2D [20] on the Jülich supercomputer Jureca, with which several 2D simulations were carried out. In each case the simulation box was filled with 50 000 × 6 250 grid points distributed over an area of 2000 μm in x times 250 μm in y, resulting in a spatial resolution of 40 nm. Compared to the 1 μm wavelength of the PHELIX system, a resolution of approximately 26 grid points per wavelength was given in both dimensions.
Within the simulation box, a neutral 3,4He-gas jet was initially represented by 2.3 × 10⁸ pseudoparticle atoms distributed over 37 000 × 6250 grid points (gas-jet region within the simulation box). Subsequent ionization by the focusing laser pulse (propagation direction in x, centered in y) was handled by a field ionization model to compute the relative He1+, He2+ and electron populations. In the first four simulations the laser parameters were defined according to the nominal PHELIX parameters: focal intensity IL ≈ 1. 4 × 10¹⁹ W cm−2, wavelength λL = 1.053 μm, pulse duration τL = 0.8 ps, focal diameter (FWHM) 25.7 μm, critical density nc = 1. 0 × 1021 cm−3 (relativistic correction of nc is included), giving a normalized vector potential of a0 ≈ 3.3. Two more simulations were carried out for τL = 1.6 ps and τL = 3.2 ps.
Four different effective target densities emulating the actual experimental gas jet were taken in order to study the influence of the target density on the channel properties and the He+2 acceleration. The target properties (particle-density distribution in the focus height above the nozzle edge, as well as the gas-jet width) were derived from an experimental interferometrical characterization of the real gas flow out of a supersonic de Laval nozzle (see figure 1 in section 2.1). Along the x-direction, the particle-density distribution was assumed to be super-Gaussian with maximum atomic density ∼5.6 × 1019 cm−3 (equation see p. (4), with the effective target length (FWHM) of 1 mm. In y-direction, a constant density was assumed. This approximation is reasonable since a variation in real particle density in height along a distance comparable to the laser-focus dimension is negligible. A further simulation was also made with the same simulation box, resolution and density profile, but larger pulse duration to check the effect of using a longer pulse.
Since laser-driven ion-acceleration mechanisms in underdense (helium) gas-jet targets have already been discussed for various laser and target properties [12–18] in detail, the current EPOCH simulations mainly served as a theoretical prediction of the ion emission angles for planning the ion diagnostics in the experiment.
Figure 7 summarizes the simulation results: in (a), the normalized He2+ ion-number densities are shown in pseudocolors for target densities of 0.02 nc, 0.03 nc, 0.06 nc, and 0.12 nc, respectively (from top to bottom), at t = 6.5 ps after the laser pulse entered the box at the left boundary. As expected from the previous work under similar conditions, a channel in ion density is generated via a combination of strong self-focusing and radial ponderomotive expulsion of electrons within the first 0.5 mm, followed by filamentation and hosing for larger times. We observe that, in general, a cleaner and longer channel is generated at lower densities; whereas the laser pulse is prone to filamentation and radial dispersion with increasing density. At 0.12 nc the pulse is almost completely absorbed before exiting the gas jet.

Figure 7. (a) Simulated normalized He2+ ion-number density in pseudocolors at t = 6.5 ps using the experimental PHELIX laser parameters with target density nHe = 0.02 nc, nHe = 0.03 nc, nHe = 0.06 nc, nHe = 0.12 nc from top to bottom, respectively; (b) angular He2+ ion-energy distribution at t = 6.5 ps; (c) the He2+ ion-energy spectra at ±(90° ± 5°).
Download figure:
Standard image High-resolution image
The corresponding angular ion-energy distribution in figure 7(b) for 0.06 nc at t = 6.5 ps (particle number indicated by pseudocolors) shows two peaks in ion energy  in transversal direction, i.e. around ±90° relative to the laser-propagation direction. Although the simulated data predicts maximal ion energies of about 12 MeV at −90° as well as an ion signal in forward direction, the density of the plotted pseudocolors, i.e. the lower flux at higher energies means that there may not be experimentally detectable signals at this energy and angular range.
Figure 7(c) shows the He2+ energy spectra at ±90° summed over an angular spread of ±5° for each of the six simulations. The distributions have been analyzed at t = 6.5 ps for τL = 0.8 ps, t = 8 ps for τL = 1.6 ps, and t = 11 ps for τL = 3.2 ps, respectively, i.e. at equal interaction times of the laser with the target. As it can be seen, higher densities lead to a higher maximum energy, in agreement with previous simulations of transverse ion emission at somewhat higher intensities [14, 15]. On the other hand, in our case the ion flux for the 2–6 MeV range appears to peak at 0.06 nc, consistent with the truncation of the channel seen in figure 7(a). At the highest density, 0.12 nc, the early onset of filamentation and dispersion of the laser pulse leads to a shorter channel, with a correspondingly reduced source layer for accelerated ions at the channel walls. In the simplest picture of ponderomotively driven charge separation and subsequent radial ion acceleration [12], their acquired energy is roughly given by  , resulting in energies of 1–2 MeV, while one would not expect a strong dependency of the energy on the target density. But, since the laser intensity used here (∼100 TW) is far above the threshold for laser pulse self-focusing, Pc = 17(nc/ne) GW
  GW, any increase in laser intensity due to this effect may be reflected in higher ion energies. As for the experimental data (see the blue and brown curves in figure 6), the highest He2+ flux in the energy range of 2–4 MeV (red and black dashed curves compared to the red solid curve in figure 7(c)) is observed for longer pulse durations of τL ≥ 1.6 ps. It has to be noted, that compared to the experimental conditions (regarding experimentally detectable ion doses, i.e. the lowest ion-detection limit) the particle–number estimation equal to or below 1013 can be neglected. Instead, ion-number estimations in the order of several 1013–1015 are sufficient for experimental ion detection.
4. Conclusions
The main ion-emission angle for laser-induced helium-ion acceleration from underdense gas jets from supersonic de Laval nozzles at PHELIX was determined to ±90° with respect to the laser-propagation direction. The RCF wraparound-obtained qualitative angular ion distribution showed a FWHM in ion signal of 23° between 80° and 100°. Attendant IP-armed TPS measurements at −80°, −90°, and −100° yielded ion-energy spectra for various laser and target parameters. For the best set of adjustet parameters, the high-energy cut-offs of fully and singly ionized 4He were 4.65 MeV (with a normalized energy uncertainty of  ) and 3.27 MeV (
 ), respectively. Full-energy laser shots caused several disadvantages like material damage of the nozzle and the main valve sealing as well as higher BG levels and parasitic proton signals on the TPS detectors. For a future spin-polarization measurement of laser-accelerated 3He2+ ions from a pre-polarized 3He gas-jet target the best parameters are: ion-emission angle for the 3He2+ polarimeter ±90°, maximal neutral particle density of
  (i.e. a gas-backing pressure of 30 bar), an optimal laser-energy range of
  J, and an optimal pulse-duration range of τL = (1. 6 ... 3.2) ps.
Acknowledgments
Sincere appreciation is expressed to the Institute for Nuclear Physics (IKP at FZJ) and to the Plasma Physics staff (PHELIX at GSI Darmstadt) for the great assistance and the strong support. The required computing time on the systems at the Jülich Supercomputing Centre (JSC at FZJ) was provided by the JARA HPC projects JZAM 04 and JPGI 06. Furthermore, the authors show their gratitude to the Central Institute for Engineering, Electronics and Analytics (ZEA at FZJ) for the technical support as well as to the Institute for Laser and Plasma Physics staff (ILPP at the HHU Düsseldorf) for fruitful discussions. Special thanks go to the research group Helium-3 (at the Johannes Gutenberg-University Mainz) for the emergency supply with helium-3 gas as well as for the training course regarding the 3He polarizer. The authors' experiments on spin-polarization built-up or conservation in laser-induced plasmas are granted by the ATHENA project (Accelerator Technology HElmholtz iNfrAstructure) in the ARD programme (Accelerator Research and Development) of the Helmholtz Association of German Research Centres. SF was financed by the BMBF (Bundesministerium für Bildung und Forschung, project ID 05P15RDFA1).