
Abstract
Increasing interest in measuring key components of the 24 h activity cycle (24-HAC) [sleep, sedentary behavior (SED), light physical activity (LPA), and moderate to vigorous physical activity (MVPA)] has led to a need for better methods. Single wrist-worn accelerometers and different self-report instruments can assess the 24-HAC but may not accurately classify time spent in the different components or be subject to recall errors. Objective. To overcome these limitations, the current study harmonized output from multiple complimentary research grade accelerometers and assessed the feasibility and logistical challenges of this approach. Approach. Participants (n = 108) wore an: (a) ActiGraph GT9X on the wrist, (b) activPAL3 on the thigh, and (c) ActiGraph GT3X+ on the hip for 7–10 d to capture the 24-HAC. Participant compliance with the measurement protocol was compared across devices and an algorithm was developed to harmonize data from the accelerometers. The resulting 24-HAC estimates were described within and across days. Main results. Usable data for each device was obtained from 94.3% to 96.7% of participants and 89.4% provided usable data from all three devices. Compliance with wear instructions ranged from 70.7% of days for the GT3X+ to 93.2% of days for the activPAL3. Harmonized estimates indicated that, on average, university students spent 34% of the 24 h day sleeping, 41% sedentary, 21% in LPA, and 4% in MVPA. These behaviors varied substantially by time of day and day of the week. Significance. It is feasible to use three accelerometers in combination to derive a harmonized estimate the 24-HAC. The use of multiple accelerometers can minimize gaps in 24-HAC data however, factors such as additional research costs, and higher participant and investigator burden, should also be considered.
Export citation and abstract BibTeX RIS

Original content from this work may be used under the terms of the Creative Commons Attribution 4.0 licence. Any further distribution of this work must maintain attribution to the author(s) and the title of the work, journal citation and DOI.
Introduction
Sleep, sedentary behavior (SED), light physical activity (LPA), and moderate to vigorous physical activity (MVPA) are four behaviors that can occur during a 24 h day. Integrating these behaviors into one model has been termed the 24 h activity cycle (24-HAC) (Rosenberger et al 2016, 2019). The 24-HAC behaviors are dynamic, especially among young adults, and can be influenced by individual, social and environmental factors (Rosenberger et al 2016, 2019).
The behaviors that make up the 24-HAC are independently associated with several important health outcomes (Chastin et al 2021). A large and growing body of evidence indicates that engaging in high SED time (>9.5 h d−1) or having a short sleep duration (<7 h d−1) is associated with negative health outcomes (e.g. obesity, diabetes, hypertension, and early mortality) independently of MVPA (Yin et al 2017, Jakicic et al 2019, Katzmarzyk et al 2019, Pescatello et al 2019, Ekelund et al 2020). In contrast, greater time spent in LPA and MVPA is moderately-to-strongly associated with many positive health outcomes including improved sleep quality and reduced risks of anxiety, depression, type 2 diabetes, and cardiovascular disease (Yin et al 2017, Jakicic et al 2019, Katzmarzyk et al 2019, Pescatello et al 2019).
Traditional approaches to measure the 24-HAC include self-report of the component behaviors (e.g. international physical activity questionnaire, Pittsburgh sleep quality index) and/or the use of a single wrist worn device (e.g. Actiwatch, GENEActiv, ActiGraph); however, two important limitations of these approaches should be considered. First, self-report measures of the 24-HAC components are subject to recall error or other biases that may lead to substantial measurement error (Haskell 2012). Second, a single wearable device is unlikely to capture the different 24-HAC components with equal precision. For example, while wrist-worn actigraphy is commonly used to assess free-living sleep behaviors, it may generate biased estimates of physical activity intensity and misclassify body postures compared to waist and/or thigh worn accelerometers (Lyden et al 2012, Ancoli-Israel et al 2015, Migueles et al 2017, Marcotte et al 2020). To overcome these challenges, integrating data from multiple wearable devices may generate more accurate estimates of the 24-HAC behaviors (Dooley et al 2023). Few studies have explored the advantages and disadvantages of using more than two accelerometers to estimate 24-HAC behaviors in free-living settings (De Craemer and Verbestel 2021, Micklesfield et al 2022, Dooley et al 2023, Pulsford et al 2023).
To address this gap, the present study aimed to: (a) evaluate the feasibility of using three research grade wearable monitors to measure key components of the 24-HAC, (b) develop a hierarchical algorithm to integrate data from the multiple measurements into minute-by-minute estimates of 24-HAC behavior and (c) use the resulting data to examine daily and weekly patterns of 24-HAC behaviors in a university student sample.
Methods
Participant recruitment and enrollment
Students enrolled at a large university were recruited via their university-provided email address during the spring and fall 2021 semesters. Email addresses were obtained from the Office of the Registrar. Prior to participation, prospective participants received an email that described the study's main purpose and an invitation to complete an online survey to assess their eligibility status. Prospective participants were classified as eligible if they met the following criteria: aged 18–24 years, full-time student status, and fluent in written English. Participants were excluded if they met one or more of the following criteria: enrolled as a student athlete, not owning a smartphone, having children or planning to become pregnant, having a diagnosed orthopedic injury in the past six months, or reporting a diagnosis of bipolar disorder. If a prospective participant was deemed eligible, research staff emailed them confirmation of eligibility and scheduled their first visit. All study procedures were reviewed and approved by the university's institutional review board and written informed consent was obtained during the participant's first in-person visit. The current study was conducted in accordance with the principles embodied in the declaration of Helsinki and in accordance with local statutory requirements.
Research design and procedures
This cross-sectional study consisted of two in-person visits over a seven to ten day period. During a participant's first visit, research staff briefly described the study procedures, answered any research-related inquiries, and obtained informed consent. Participants were then directed to a private quiet room and were instructed to complete several questionnaires, including those assessing demographic characteristics (sex assigned at birth, race, ethnicity, etc). Next, a research team member asked the participant if he or she was prescribed any daily medication and then took height (Hopkins Medical Products, Grand Rapids, MI, Model: Hopkins Road Rod Portable Stadiometer) and weight (Tanita Corporation of America Inc., Arlington Heights, Illinois, Model: WB100, TBF-305) measurements. Participants were then fitted with three different research grade monitors: (a) ActiGraph GT3X+ worn on the right hip, (b) ActiGraph GT9X Link worn on the non-dominant wrist, and (c) activPAL3 worn on the anterior aspect of the non-dominant thigh. Participants were provided verbal and written instructions on how to wear the monitors during the next seven to ten days. The second in-person visit occurred seven to ten days after the first in-person visit, during which participants removed all monitors and returned monitor wear and sleep logs.
24 h activity cycle measures
Physical activity
An ActiGraph GT3X+ (ActiGraph Corp, Pensacola, FL) was attached to an elastic belt and worn on the right hip during all waking hours to measure LPA and MVPA. Participants were instructed that the ActiGraph GT3X+ should not be worn during water-based activities or sleep. All devices were equipped with firmware version 3.2.1. ActiLife software version 6.13.4 was used to initalize and download data in 1 min epoch lengths to classify physical activity intensities. The low frequency extension was not used. LPA and MVPA were classified using the Sasaki et al (2011) algorithm which incorporated an additional SED cut-point (sedentary: 0–150 cpm, light: 151–2689 cpm, moderate: 2690–6166 cpm, vigorous: 6167–9642 cpm, very vigorous: ≥ 9643 cpm) (Sasaki et al 2011, Migueles et al 2017). The Sasaki et al (2011) algorithm was applied to classify the different physical activity intensites for two reasons. First, the algorithm relies on vector magnitude from all three axes rather than older algorithms (i.e. Freedson 1998, Troiano 2008) which were based on vertical axis counts from uniaxial accelerometers. Second, a sedentary behavior cut-point of <150 cpm was incorporated into the algorithm as suggested by Migueles et al (2017) to better discern sedentary behavior from LPA. Non-wear periods were identified as periods with 60 consecutive minutes of 0 counts using the Choi algorithm (Choi et al 2011). In addition, participants were provided with a wear and sleep log to document periods when a device was removed.
Sedentary behavior
The activPAL3 (PAL Technologies, Glasgow, UK), placed on the skin of the anterior thigh, was used to measure sedentary behavior. A customized 1 min epoch length was develped in the PAL analysis software to accurately classify the posture of different sedentary behaviors throughout the day. All activPAL data were processed using PAL analysis version 8.11.8.75 software with the CREA algorithm. The device provides valid estimates of sedentary behaviors (e.g. sitting time) during free living conditions in young adults compared to direct observation (Lyden et al 2012). SED behavior metrics provided by the software included time spent sitting, in seated transport, and in primary or secondary lying positions. ActivPAL3 estimates of times in and out of bed were derived from the primary lying times each day. As described by PAL technologies, time in bed (TIB) estimates are classifed by non-upright events (e.g not standing or walking) lasting at least one hour and then expanding each event to adjacent non-upright events lasting at least one hour (allowing for bathroom breaks and other sleep interruptions), resulting in a 'container' or 'bin' of predominantly non-upright events. The longest 'container' is classified as 'primary lying time' and the shorter 'containers' are classifed as 'secondary lying time 4 '.
Sleep
The ActiGraph GT9X Link was used as a measure of time spent in sleep. Participants were instructed to wear the accelerometer on their non-dominant wrist during all 24 h for a consecutive 7–10 d period, except for water-based activities (swimming or bathing). Devices were equipped with firmware version 1.7.2 and ActiLife software version 6.13.4 was used to initalize and download data in 1 min epoch lengths. Participants also were provided a daily sleep log to report their times in bed and out of bed.
Estimated times in bed TIB and times out of bed (time out of bed [TOB]) were derived by combining data from self-report sleep logs, primary lying times detected by the activPAL3, and the sleep bouts detected by the GT9X using the automated algorithm included in the ActiLife software. Lacking a gold standard criterion measure (e.g. polysomnography), self-reported times were used when they approximated (within 60 min) the time provided by one or both objective measures, and when there was little agreement between estimates from the available objective measures (no pair of estimates within 60 min). A 60 min threshold was derived by the observed differences in TIB/TOB estimates from the three sleep data sources and the desire to maximize the ability to identify instances where there was reasonable agreement between data sources so that this agreement could be factored into our sleep algorithm. However, activPAL3 estimates for TIB and TOB, respectively, were used in the following situations: (a) when the self-reported TIB was 1–60 min after the activPAL3 TIB, the activPAL3 TIB was used; and (b) when the self-reported TOB was 1–60 min after the activPAL3 TOB, the activPAL3 TOB was used. These exceptions were made to avoid coding non-lying time detected by the activPAL3 as TIB. For sleep bouts where the above conditions were not met, a hierarchical decision tree was used to derive a best estimate of TIB and TOB (see supplemental figure 1).
Data processing
For this analysis, all three data sources (ActiGraph GT3X+, activPAL3, and ActiGraph GT9X Link) were processed using the previously noted software packages and then combined in 1 min epochs. Single accelerometer studies have long used 1 min epochs for assessing physical activity, sedentary behavior, and sleep in healthy adults as reflected in many published algorithms (i.e. Freedson 1998, Troiano 2008, VANE, CREA Sadeh, Cole-Krepke). Each minute of monitored time was then classified as either sleep, SED, LPA, or MVPA using the approach detailed in figure 1. Briefly, non-sleep minutes were classified as (a) SED if the activPAL identified the participant as sitting for the entire minute or, absent activPAL data, the ActiGraph GT3X+ had a vector magnitude ≤150 counts per minute (cpm); (b) LPA if the activPAL registered upright posture for any portion of the minute or if the ActiGraph GT3X+ registered 151–2690 vector magnitude cpm; and (c) MVPA if the ActiGraph GT3X+ registered ≥2691 vector magnitude cpm. Supplemental figure 2 provides the SAS code used to operationalize the algorithm. Only days in which a behavior could be assigned for ≥1380 min using the combined data sources were retained for analysis as 'valid days'. Valid days with <1440 min of data, due to missing data or spring daylight savings, were standardized to a 1440 min day by multiplying each 24-HAC estimate by 1440/#valid minutes. Valid days with more than 1440 min of data, due to fall daylight savings, were standardized to a 1440 min day by multiplying each 24-HAC estimate by #valid minutes/1440.
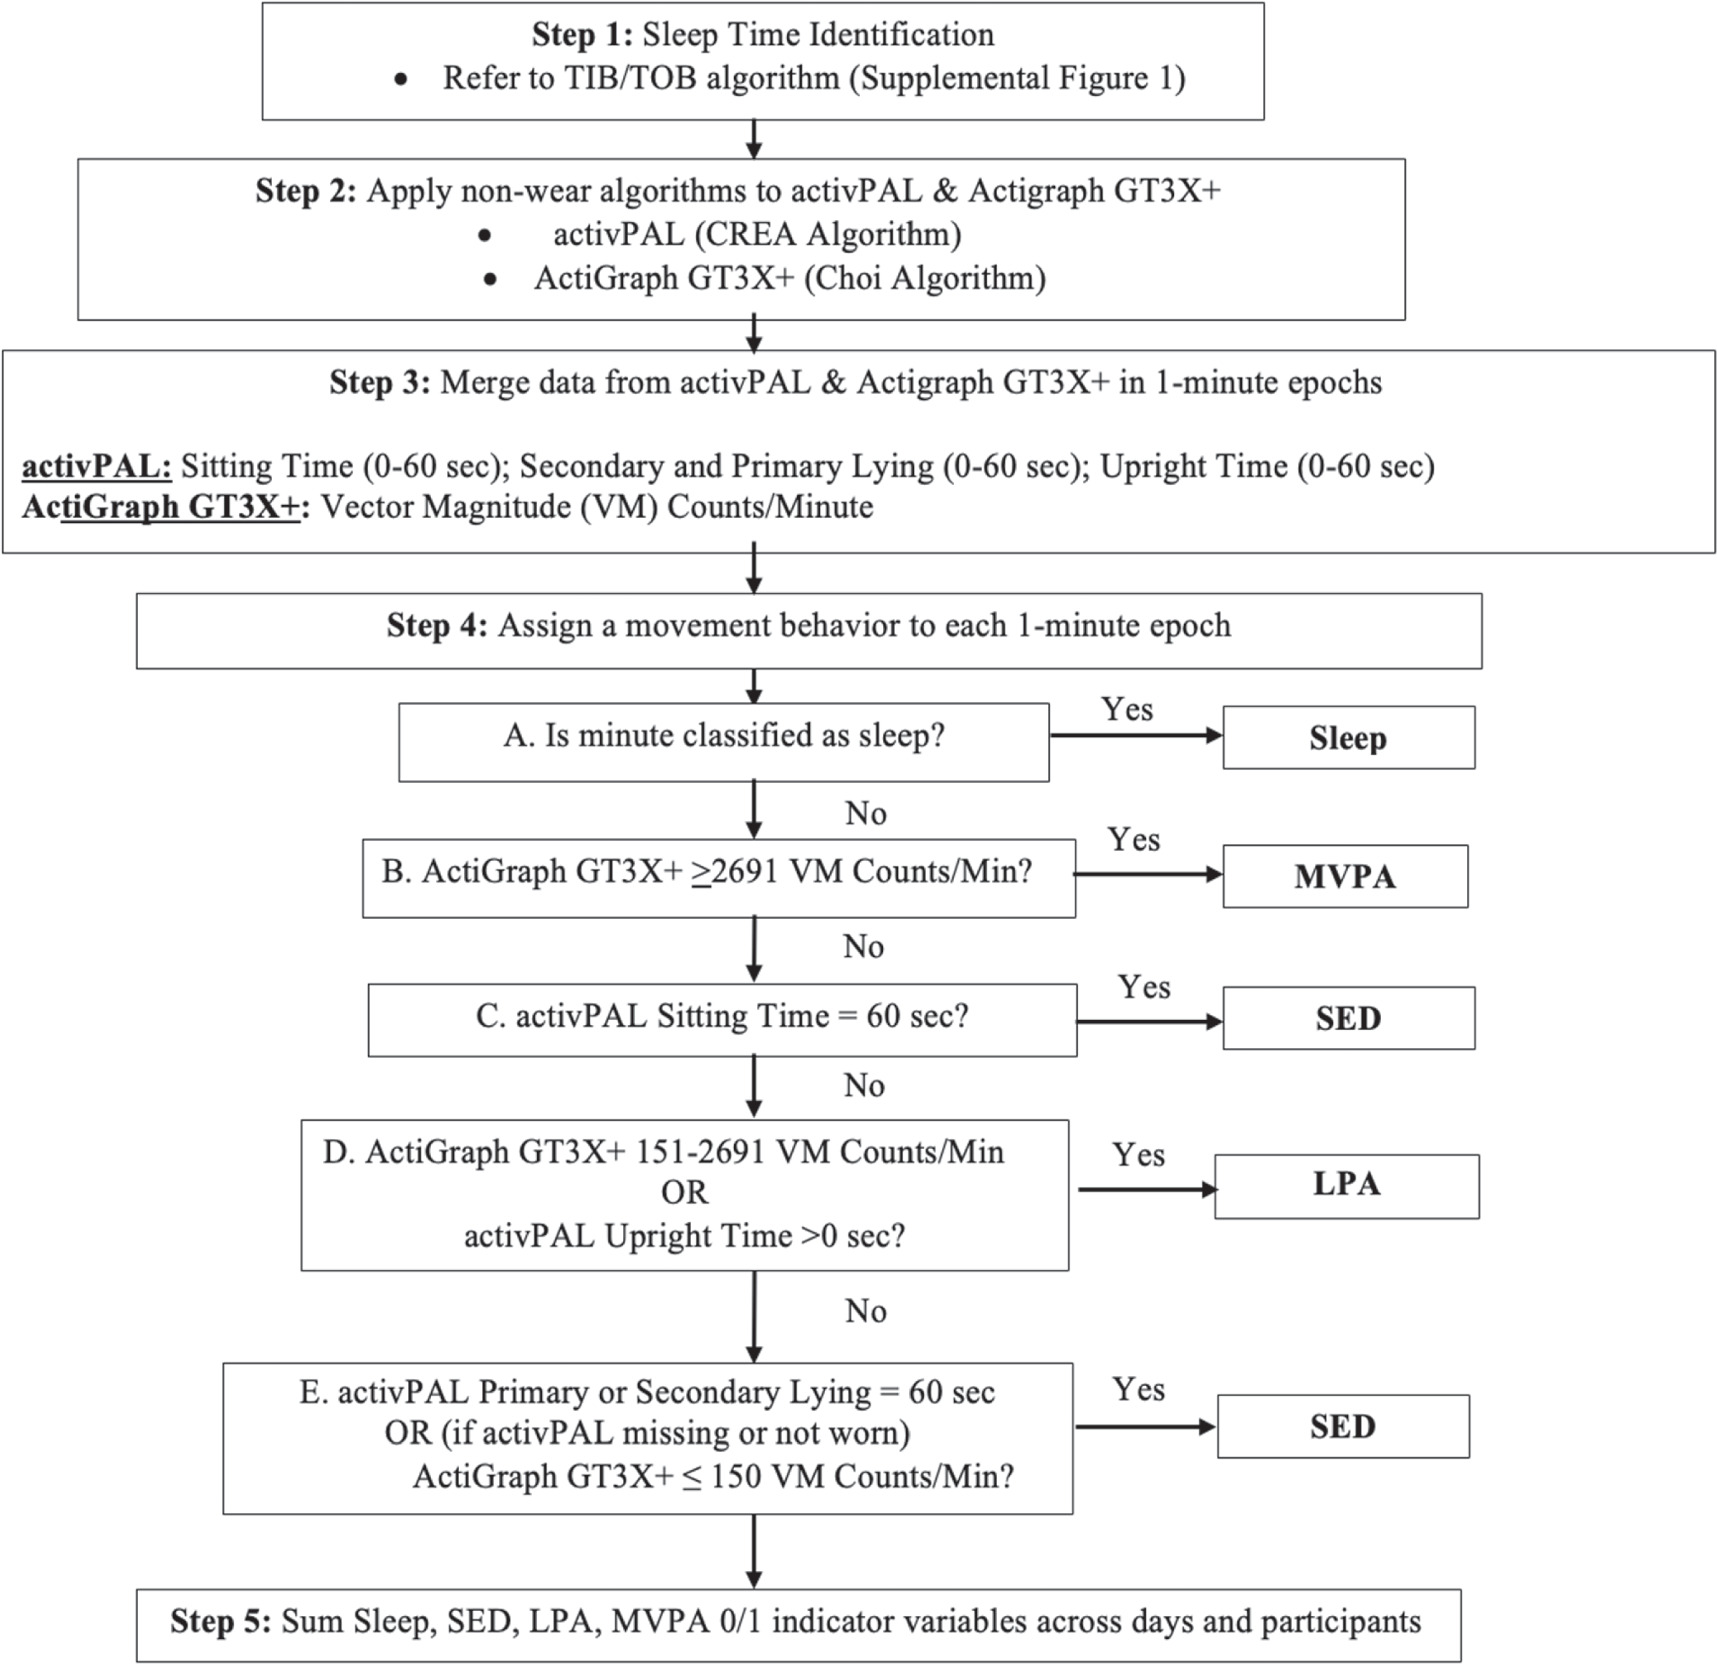
Figure 1. Flow diagram to assign a 24 h movement behavior to minute level data.
Download figure:
Standard image High-resolution imageStatistical analysis
Descriptive statistics and histograms were obtained for all continuous variables at both the day and participant level to assess normality and to screen for data anomalies. Estimates from the ActiGraph GT3X+, activPAL3, ActiGraph GT9X are reported as mean, standard deviation (SD) values unless otherwise noted. Univariate linear models were used to compare estimates of total sleep duration, SED, LPA, and MVPA across groups. An additional post-hoc analysis was used to examine where statisical group differences occurred between groups. Overall weekend versus weekday values of total sleep duration, SED, LPA, and MVPA were compared using paired t-tests. Statistical analyzes were completed using SPSS (version 26.0) and SAS (version 9.4).
Results
A total of 695 participants completed the study's inital elgibility survey, 123 participants consented to participate and attended the first study visit, after which three participants withdrew from the study due to skin irritation from device wear. The study's sample was 20.2 ± 1.6 yrs, primarily female (63.8%), primarily identified as white non-hispanic (64.8%), and primarily classifed as normal weight (23.5 ± 4.0 kg.m2, 60.1%).
Table 1 details data losses and wear time compliance for the 120 participants who completed the device wear protocol, restricted to the first 6 complete days of wear (i.e. the first partial day of wear was excluded along with data beyond the 7th wear day). Approximately 2%–4% of days were lost due to device/battery failure (5 GT9X, 3 activPAL, 2 GT3X+). Among days with available data, average wear times indicated good compliance with the study protocol, as average wear approximated 23 h d−1 for the GT9X and activPAL (which were to be worn continuously) and 16 h d−1 for the GT3X+ (which was to be worn during waking hours only). When examined according to the proportion of valid measurement days (defined as 23+ h d−1 for the GT9X and activPAL and 14+ h d−1 for the GT3X+), wear compliance was highest for the activPAL (93.2% of total days with 80.3% of participants compliant for all 6 days) and lowest for the GT3X+ (70.7% of total days with only 30.5% of participants compliant for all 6 days).
Table 1. Data completeness and participant wear compliance across device types and different device combinations.
| Device | Days N (%) | Wear time (h d−1) mean (SD) | Valid days (%) | Number of valid days % of participants a | ||
|---|---|---|---|---|---|---|
| 2+ | 4+ | 6 | ||||
| ActiGraph GT3X+ | 703 (97.6) | 15.7 (4.6) | 70.7 | 89.8 | 69.5 | 30.5 |
| ActiGraph GT9X | 690 (95.8) | 22.7 (3.7) | 84.3 | 93.9 | 88.7 | 57.4 |
| activPAL | 690 (95.8) | 23.1 (3.6) | 93.2 | 96.6 | 92.3 | 80.3 |
| Combined measures | ||||||
| GT3X+/GT9X | 679 (94.3) | 15.2 (4.9) | 67.3 | 86.8 | 64.9 | 27.2 |
| GT3X+/ activPAL | 673 (93.5) | 15.2 (4.8) | 67.2 | 87.0 | 62.6 | 22.6 |
| GT9X/ activPAL | 660 (91.7) | 22.1 (4.7) | 80.0 | 90.2 | 83.0 | 46.4 |
| All devices worn | 649 (90.1) | 14.8 (5.1) | 63.6 | 83.8 | 58.6 | 18.9 |
| Any device worn | 720 (100.0) | 23.7 (2.0) | 97.2 | 99.2 | 97.5 | 92.5 |
Wear time values based on days with non-missing data as noted in the days column. A valid day was defined as having 23+ h of wear for Actigraph GT9X, activPAL, GT9X/activPAL and any device worn categories and as 14+ h of wear for the Actigraph GT3X+, GT3X+/GT9X, GT3X+/activPAL, and all devices worn categories. a Reflects the percentage of participants with 2+, 4+, and 6 d of valid data. Restricted to the first 6 complete days of data collection.
To inform those considering the use of multiple measurement devices in future studies, table 1 also details the data losses and wear compliance that resulted when the analysis was restricted to different combinations of devices. As expected, data losses increased when non-missing data from multiple devices was required, with approximately 6%–8% of days lost for different two-device combinations and 10% of days lost when non-missing data from all three devices was required. In contrast, no days of data were lost when non-missing data from only 1 of 3 devices was required. Among the different two-device combinations, the GT9X/activPAL combination had the highest percentage of valid days (80%) with overlapping device wear, with 46.4% of participants compliant for all 6 d. As expected, requiring simultaneous wear of all three devices resulted in the lowest percentage of valid days (63.6%), with only 18.9% of participants compliant for all 6 d. When non-missing data from only 1 of 3 devices was required, less than 3% of days were invalid and 92.5% of participants had 6 valid days.
In order to make use of all available data and maximize the number of valid days, each minute during device wear was classified as sleep, SED, LPA, or MVPA using the previously described algorithm (figure 1). This resulted in a sample of 108 participants with at least 4 valid weekdays, and 2 valid weekend days, of 24 h movement behavior data.
On average, participants spent 75% of their day in either SED (41.6%, 599.2 min d−1) or sleep behavior (33.7%, 485.7 min d−1), less than a quarter of the day (21%, 299.2 min d−1) in LPA, and the least amount of time in MVPA (4%, 55.8 min d−1). As shown in table 2, weekdays were characterized by higher SED and MVPA, but lower LPA, compared to weekend days. Most estimates of weekday and weekend 24-HAC behaviors were similar across categories of sex, race/ethnicity, and BMI. Statistically significant exceptions were higher MVPA in males on both weekdays and weekends, lower LPA in males on weekends, and lower weekday MVPA in a sub-sample of 17 Asian students.
Table 2. Weekday and weekend mean (±SD) estimates of the 24 h activity cycle behaviors by demographic characteristics in university students.
| Characteristic | N | Sleep (min d−1) | SED (min d−1) | LPA (min d−1) | MVPA (min d−1) | ||||
|---|---|---|---|---|---|---|---|---|---|
| Weekday | Weekend | Weekday | Weekend | Weekday | Weekend | Weekday | Weekend | ||
| Overall sample | 108 | 482.5 ± 73.7 | 493.7 ± 95.8 | 611.4 ± 100.6 a | 568.8 ± 107.7 | 287.7 ± 79.0 | 328.1 ± 113.6 a | 58.4 ± 34.0 a | 49.3 ± 41.1 |
| Sex | |||||||||
| Females | 72 | 488.6 ± 67.8 | 488.4 ± 85.5 | 608.0 ± 103.0 | 563.3 ± 104.0 | 290.0 ± 78.2 | 346.0 ± 113.8 | 53.4 ± 30.9 | 42.3 ± 34.0 |
| Males | 36 | 470.4 ± 83.9 | 504.3 ± 114.2 | 618.1 ± 96.5 | 579.9 ± 115.4 | 282.9 ± 81.6 | 292.4 ± 105.8 | 68.6 ± 37.9 | 63.4 ± 50.1 |
| p = 0.22 | p = 0.41 | p = 0.62 | p = 0.45 | p = 0.66 | p = 0.02 | p = 0.02 | p = 0.01 | ||
| Race/ethnicity | |||||||||
| White-non-hispanic | 68 | 487.1 ± 77.3 | 492.8 ± 97.7 | 605.0 ± 91.5 | 559.2 ± 102.7 | 284.5 ± 75.5 | 333.3 ± 109.0 | 63.4 ± 33.9 | 54.7 ± 43.8 |
| Asian | 17 | 463.2 ± 70.4 | 526.6 ± 114.1 | 649.0 ± 116.0 | 575.4 ± 127.2 | 290.4 ± 96.6 | 311.6 ± 132.1 | 37.5 ± 20.0 | 26.4 ± 21.4 |
| Hispanic | 12 | 497.2 ± 58.5 | 490.7 ± 59.5 | 601.8 ± 95.7 | 606.7 ± 89.0 | 278.1 ± 49.2 | 289.1 ± 88.7 | 62.9 ± 30.9 | 53.6 ± 31.0 |
| Other | 11 | 468.1 ± 67.6 | 451.5 ± 75.1 | 602.9 ± 132.8 | 576.7 ± 128.1 | 313.8 ± 100.5 | 364.6 ± 133.6 | 55.4 ± 44.5 | 47.2 ± 47.8 |
| p = 0.50 | p = 0.22 | p = 0.41 | p = 0.53 | p = 0.67 | p = 0.37 | p = 0.03 | p = 0.08 | ||
| BMI classification | |||||||||
| Underweight | 10 | 461.9 ± 66.3 | 522.2 ± 84.3 | 653.6 ± 127.3 | 560.4 ± 93.8 | 276.3 ± 109.9 | 299.6 ± 86.7 | 48.2 ± 29.9 | 57.8 ± 41.8 |
| Normal weight | 67 | 488.0 ± 76.2 | 500.9 ± 88.9 | 616.3 ± 90.3 | 569.8 ± 100.5 | 277.1 ± 63.8 | 320.8 ± 108.6 | 58.7 ± 34.6 | 48.6 ± 40.8 |
| Overweight | 24 | 482.4 ± 70.5 | 480.3 ± 108.9 | 584.7 ± 109.2 | 568.7 ± 140.4 | 310.5 ± 99.9 | 338.9 ± 127.6 | 62.3 ± 34.3 | 52.1 ± 46.4 |
| Obese | 7 | 460.4 ± 75.2 | 430.5 ± 114.3 | 595.6 ± 119.3 | 572.1 ± 83.2 | 326.3 ± 70.6 | 402.9 ± 132.9 | 57.7 ± 35.5 | 34.5 ± 21.4 |
| p = 0.61 | p = 0.18 | p = 0.27 | p = 0.99 | p = 0.16 | p = 0.22 | p = 0.74 | p = 0.68 | ||
Sleep = total sleep duration, SED = total sedentary time, LPA = light physical activity, MVPA = moderate-to-vigorous physical activity. 'Other' Race/ethnicity is comprised of the students who reported being black non-hispanic (n = 8) or Other race (n = 3). The statistical significance of between group differences was assessed using univariate general linear models (bold). a Denotes that a statistically significant difference in overall mean weekday versus weekend values. Paired t-test p-values of overall weekday versus weekend estimates were sleep p = 0.32, SED p = 0.0003, LPA p = <.0001, MVPA p = .0022.
As depicted in figure 2, the amount of time spent in the different 24-HAC behaviors varied from day to day. Participants had the shortest total sleep duration on fridays (461.7 min) and the longest on sundays (511.6 min). SED time ranged from 544.7 min on saturdays to 635.8 min on tuesdays while LPA ranged from 278.1 min on thursdays to 361.2 min on saturdays. Finally, participants had the least amount of MVPA time on sundays (41.3 min) and the highest on wednesdays (63.7 min).
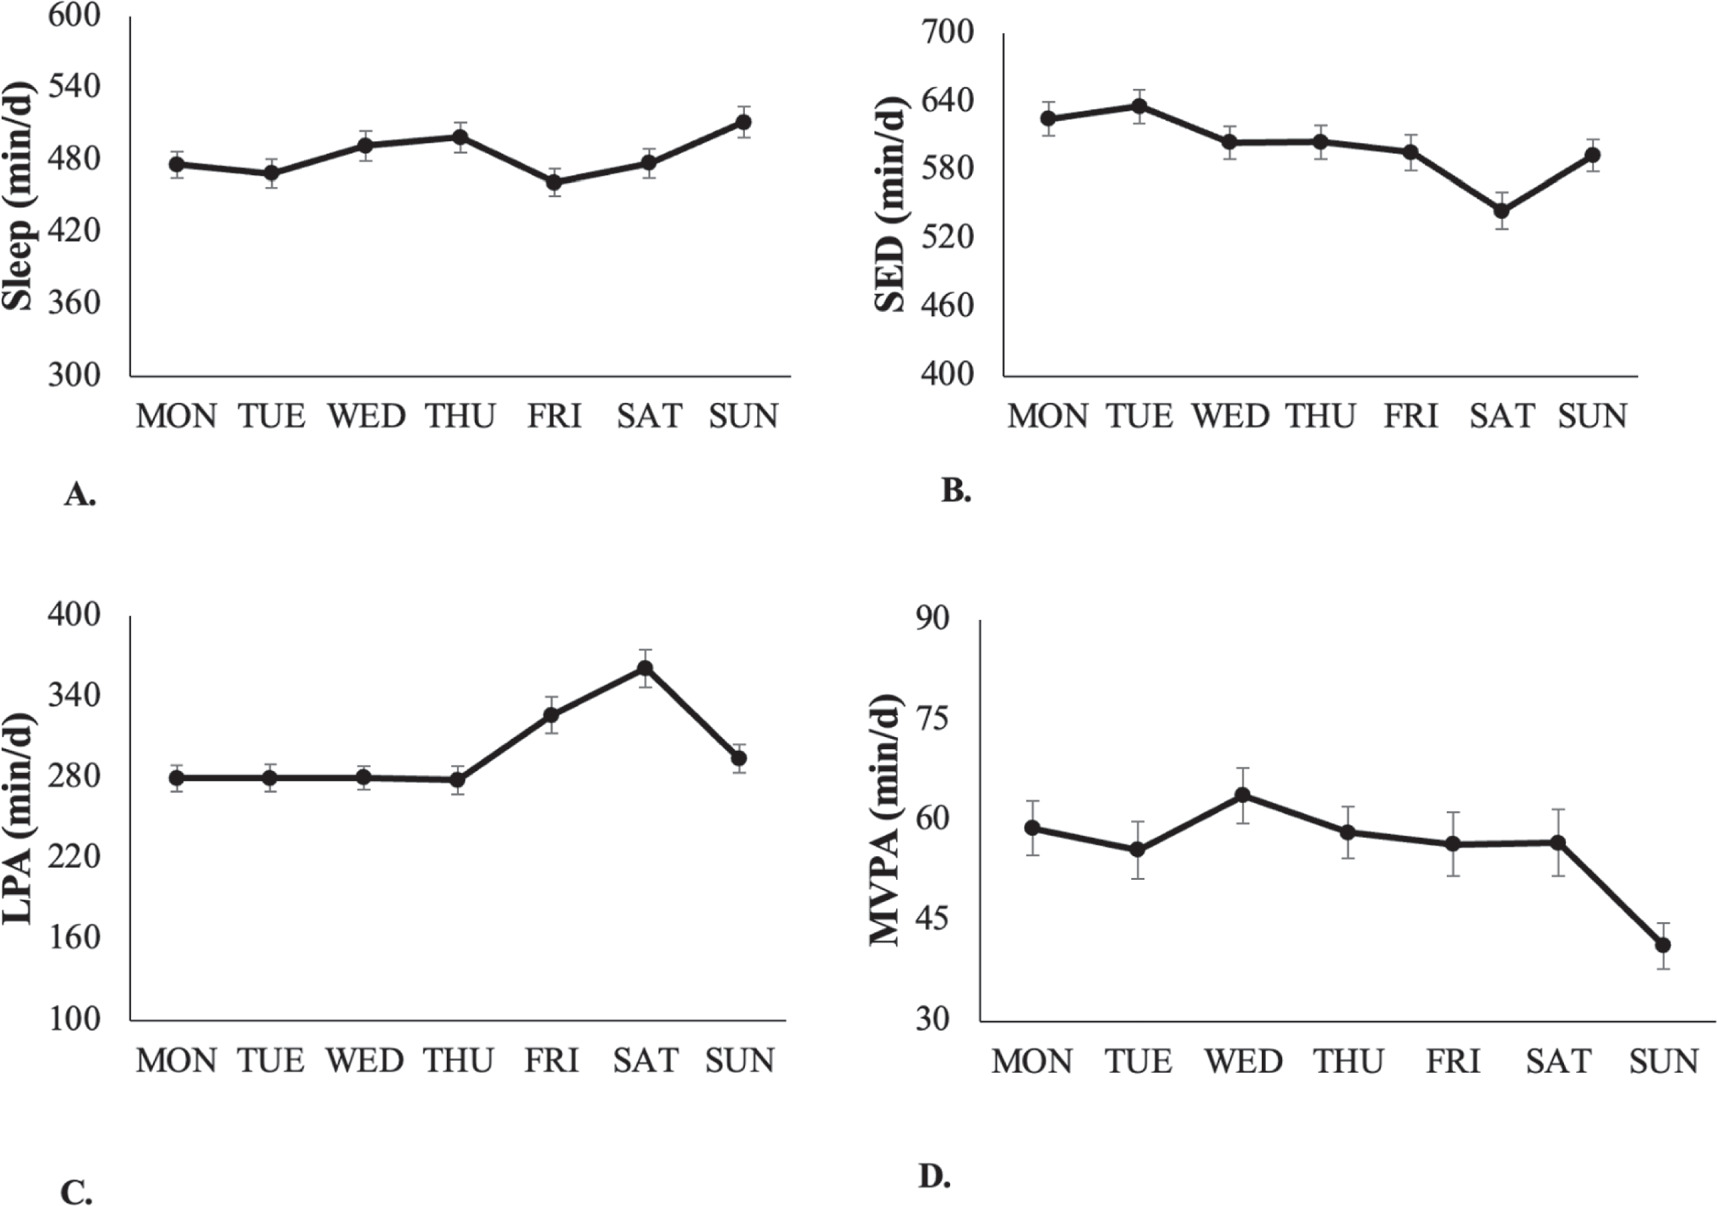
Figure 2. Time (M ± SE) spent in the components of the 24 h activity cycle in university students, by day of the week.
Download figure:
Standard image High-resolution imageFigure 3 shows the percentage of students engaged in each of the 24-HAC behaviors within an average weekday and weekend day. Sleep showed a clear nocturnal pattern with an approximate one hour delay in sleep initiation and a slightly longer delay in sleep cessation on weekends. A majority of students demonstrated a 'night owl' sleep pattern, with only half of students initiating sleep before 1 a.m. on weekdays and peak sleep engagement (over 90% of students) occurring from approximately 3–5 a.m. On weekdays, non-sleep behaviors between 10 a.m. and 5 p.m. exhibited a cyclic pattern, likely due to typical course schedules in an academic environment. During other times, non-sleep behaviors varied in an apparently random fashion across the day.

Figure 3. Changes in 24 h activity cycle behaviors in university students on weekdays (solid lines) and weekend days (dashed lines).
Download figure:
Standard image High-resolution image
Discussion
To our knowledge, this is the first study to evaluate the feasibility and utility of using three distinct research-grade accelerometers, worn at different body locations, to measure 24-HAC behaviors under free-living conditions. We observed a high rate of participant compliance with wear instructions for all three accelerometers, although compliance was lower for the waist worn GT3X+ that was to be removed during sleep bouts. Despite high compliance for individual devices, requiring concurrent wear of multiple devices was found to result in a substantially higher proportion of invalid wear days. To avoid these potential data losses, we developed a hiarchical algorithm to categorize each minute of a 24 h day into one of the four components of the 24-HAC using available data from the research-grade accelerometers and supplementary resources (i.e. sleep logs). This process allowed for the prioritization of the most appropriate data source for a given parameter (e.g. activPAL for SED) while accounting for variations in data availability during the measurement period. This approach resulted in plausible estimates of 24-HAC behaviors both within and between days over a one-week period with minimal data losses.
An abundance of evidence indicates that the behaviors comprising the 24-HAC are interelated, underlining the need for accurate simultaneous measurement of these behaviors to provide a comprehensive understanding of how the 24-HAC influences human health (Ekelund et al 2020, Chastin et al 2021). While best practice guidelines exist for the objective measurement of physical activity, sedentary behavior, and sleep (Lyden et al 2012, Rosenberger et al 2013, Ancoli-Israel et al 2015, Edwardson et al 2017, Marcotte et al 2020), there is no consensus on the best approaches for measuring all components of the 24-HAC simultaneously in free living environments. The most established method to objectively measure free-living physical activity intensity is via a hip-mounted triaxial accelerometer, which boasts superior validity and reliability compared to wrist worn accelerometers (Rosenberger et al 2013, Marcotte et al 2020). However, accelerometers worn on the hip cannot accurately differentiate between SED and LPA due to poor discernment between standing and sitting postures. Thigh worn accelerometers, such as the activPAL, address this limitation by measuring both movement and postural changes—offering insights into transitions from sitting to standing and a more nuanced understanding of prolonged sedentary bouts (Lyden et al 2012). While polysomnography is the gold standard for assessing sleep, wrist-worn actigraphy in conjunction with self-report sleep logs is an established method for assessing sleep duration and quality in non-clinical settings (Ancoli-Israel et al 2015). In the current study, an innovative strategy was developed to harmonize the data from these devices which aimed to reduce misclassification of the component behaviors while maximizing data completeness. In the current study, participant compliance for wearing one device was good but, as expected, compliance for wearing all all three devices was much lower. Based upon this observation, it is necessary to develop approaches that prioritize input from multiple devices when available (and reconcile differences) but to also incorporate estimates from single devices when required in order to maximize data completeness.
Two recent studies have examined alternative approaches for harmonizing data from two different device combinations to classify free-living 24-HAC (Micklesfield et al 2022, Dooley et al 2023). In a study by Dooley et al (2023), a cohort of 1285 community-dwelling older women concurrently wore the ActiGraph wGT3X+ on the waist during waking hours and the Actiwatch 2 continuously on the wrist for up to seven days as part of the Study Of Women's Health Across the Nation (SWAN). This study first developed a two-tier system to differentiate waking and non-waking intervals. The first tier utilized sleep data from the Actiwatch, while the second tier deployed a one-dimensional convolutional neural network when there was missing sleep data. Once wake intervals were determined, Evenson cut points (Evenson et al 2015) were used to classify SED, LPA, and MVPA from the ActiGraph wGT3X+ vector magnitude counts. In contrast, Micklesfield et al (2022) used a different approach to derive 24-HAC estimates from hip-worn Actigraph GT3X+ and thigh-worn activPAL data in 794 middle-age South-African men and women. They first identified sleep timing using a decision tree based on raw acceleration data signals from the activPAL combined with sleep log information. The remaining components of the 24-HAC were then identified based on different raw acceleration (Euclidean norm minus one) signal thresholds. While both studies are commendable for their unique strengths, their harmonization techniques are complex and might not be feasible for some investigators. The current study developed a novel harmonization process for three devices, including a decision tree to identify total sleep duration, and a five-step process for assigning each minute outside of sleep to a 24-HAC category. In addition to its relative simplicity, the proposed approach could be readily adapted to studies using different device combinations and has the advantage of miminizing data losses by leveraging information from all available devices during the assesment period.
Previous investigatons using two or more device combinations to examine the 24-HAC in university students are currently limited (Kahlhöfer et al 2016, Hargens et al 2021). To date, Kahlohfer et al (2016) is the sole study that used two research grade accelerometers in a sample of 132 German university students. Participants wore an Actiwatch on the wrist to assess total sleep duration without a sleep diary and an activPAL on the thigh to measure sedentary time, standing time, walking time, and daily steps. The study found that their university student sample slept approximately 400 min d−1, engaged in sedentary behaviors for 17.9 h d−1, spent about 5.8 h d−1 in different upright postures (combined standing and walking time), and took around 9610 steps d−1. Estimates of LPA and MVPA were not reported. A study by Hargens et al (2021) used a single device worn in two body locations to assess physical activity, SED and sleep in a sample of 81 U.S. university students. During waking hours participants were instructed to wear an ActiGraph GT3X on their hip to capture habitual physical activity and sedentary behaviors while, during periods of sleep, participants were instructed to move the device from the hip to the wrist with a provided wrist strap. The study reported that, on average, students slept 388.7 ± 59.9 min d−1 and engaged in 660.4 ± 11.4 min d−1 of SED and in 59.6 ± 25.7 min d−1 of MVPA. In general agreement with the current study, Hargens et al (2021) reported that students had a significantly longer sleep duration (404.1 ± 66.7 min d−1), higher total sedentary time (637.4 ± 130.9 min d−1), and lower MVPA (44.1 ± 30.3 min d−1) on weekend days compared to weekdays (sleep: 378.9 ± 60.4 min d−1; SED: 682.6 ± 90.3 min d−1; MVPA: 65.7 ± 28.0 min d−1). Estimates of LPA were not reported.
A primary strength of the present investigation was the simultaneous application of three research grade monitors to classify the 24-HAC behaviors. As highlighted by Rosenberger et al (2016) and subsequent investigations (Chastin et al 2015, Dumuid et al 2018, Janssen et al 2020), no single device can accurately classify the 24 h day in its entirety; thus, device selection should be informed by the research question and the primary outcome(s) of interest. Merging data from the ActiGraph GT9X worn on the wrist to measure sleep, an activPAL worn on the thigh to assess SED, and an ActiGraph GT3X+ worn on the hip to measure LPA and MVPA was used to leverage information from each device to classify 24-HAC behaviors for each minute of the day if one or two accelerometers were used which may misclassify time spent in an indiviaual component. For example, traditional waist-worn accelerometers are worn during waking hours and removed during water based activities or periods of sleep. Thus, non-wear periods may be misclassifed if a wrist-worn accelerometer is left being worn due to higher counts or if no other device is being worn. Because participants in our study were instructed to wear the activPAL continuously for 24 h, the algorithm developed was able to discern postural changes as a more confident approach to classify other components of the 24-HAC. A second strength of the study is the algorithm's ease of use. ActiGraph accelerometers were chosen in the current study because they are used in physical activity research and national surveillance work in the United States. Unlike previous algorithms using multiple complimentary research grade accelerometers used advanced machine learning skills or data processing skills (i.e. GGIR), the current study's algorithm may have the flexibility to collaborate with other accelerometers device brands, but additional processing steps could be required depending on the device's data output or algorithm used to harmonize and classify the 24-HAC. However, future investigations will be needed to support this concern.
Several caveats and limitations should also be considered when interpreting the results of this study. First, the accuracy and precision 24-HAC estimates generated using the proposed algorithm is unknown due to the lack of a criterion measure of these behaviors in the present study. Previous studies (Micklesfield et al 2022, Dooley et al 2023) using multiple research grade monitors to estimate the 24-HAC have also noted the same limitation. Absent a single validated criterion measure of free-living 24-HAC behaviors, using multiple complementary monitors logically be expected to improve estimates of these behaviors compared to single-measure estimates. However, this area of research could benefit from studies conducted in clinical settings which compare single versus multiple monitor estimates of 24-HAC behaviors using direct observation as the criterion. Finally, it is unclear whether the approach outlined here would generate similar results if different device combinations were used or in appreciably different samples.
In conclusion, this study presents a feasible approach to estimate 24-HAC behaviors using three complimentary research-grade accelerometers. Moreover, we present a hierarchical algorithm that harmonizes these assessments by prioritizing the most appropriate data source for a given 24-HAC behavior while accounting for variations in data availability during the measurement period. Given that the 24-HAC is a relatively new paradigm, future studies should aim to (a) assess the validity of various methodological approaches across different groups, (b) evaluate the trade-off between the increased accuracy of multi-device approaches and the additional investigator (e.g. increased data processing time and device costs) and participant burden (e.g. remembering what device to wear and when to wear it), and (c) identify the optimal combination of devices and wear locations to strike a balance between accuracy and feasibility. The findings and methodologies of this study can inform future efforts to measure and harmonize the composition of the 24-HAC, enhancing our understanding of human health.
Data availability statement
All data and supplemental data are included within the article itself. The data that support the findings of this study are available upon reasonable request from the authors.
Conflict of interest
There are no conflicts of interest to disclose.
Funding/support
No external funding was provided for this study.
Footnotes
- 4
Ltd PT. Algorithms-PALT documentation 2019. Available from: http://docs.palt.com/display/AL/CREA.
Supplementary data (0.3 MB PDF)