
Abstract
Continuous monitoring of mean intracranial pressure (ICP) has been an essential part of neurocritical care for more than half a century. Cerebrospinal pressure–volume compensation, i.e. the ability of the cerebrospinal system to buffer changes in volume without substantial increases in ICP, is considered an important factor in preventing adverse effects on the patient's condition that are associated with ICP elevation. However, existing assessment methods are poorly suited to the management of brain injured patients as they require external manipulation of intracranial volume. In the 1980s, studies suggested that spontaneous short-term variations in the ICP signal over a single cardiac cycle, called the ICP pulse waveform, may provide information on cerebrospinal compensatory reserve. In this review we discuss the approaches that have been proposed so far to derive this information, from pulse amplitude estimation and spectral techniques to most recent advances in morphological analysis based on artificial intelligence solutions. Each method is presented with focus on its clinical significance and the potential for application in standard clinical practice. Finally, we highlight the missing links that need to be addressed in future studies in order for ICP pulse waveform analysis to achieve widespread use in the neurocritical care setting.
Export citation and abstract BibTeX RIS

Original content from this work may be used under the terms of the Creative Commons Attribution 4.0 licence. Any further distribution of this work must maintain attribution to the author(s) and the title of the work, journal citation and DOI.
1. Introduction
Traumatic brain injury (TBI) is one of the major contributors to death and disability worldwide, with estimated incidence of approx. 69 million cases every year (Dewan et al 2018). Although only a small percentage of those patients (estimated at approx. 5.5 million, i.e. 8% (Iaccarino et al 2018)) are diagnosed with severe TBI that requires extensive neurocritical care, it still poses a significant medical and socioeconomic challenge. Management of severely brain injured patients in modern neurocritical care units (NCCUs) is often supported by multimodal monitoring of the brain (Carney et al 2017). Since Lundberg's seminal paper (Lundberg et al 1965) on continuous intracranial pressure (ICP) measurement, various attempts have been made to precisely characterize the volume–pressure relationships in the cerebrospinal space and predict impending deterioration of the patient's condition. Monitoring of mean ICP remains one of the cornerstones of neurocritical care. It has been suggested that information about the cerebrospinal system's ability to buffer changes in volume before substantial changes in mean ICP occur may complement current guidelines-supported management protocols. However, the majority of existing methods of assessing cerebrospinal compensatory reserve are not very well suited to the NCCU as they require external volume addition to the cerebrospinal space which may be harmful for the patient and does not allow for continuous monitoring. The morphology of the ICP pulse waveform, i.e. the shape of the signal over a single cardiac cycle, has been proposed as an alternative indicator of cerebrospinal compensatory reserve four decades ago (Cardoso et al 1983). Still, despite promising early reports, it has only started receiving more attention in recent years as the available processing methods improved. In this paper, we present a narrative review of the developments in the area of ICP pulse waveform analysis and its potential utility in the management of patients with intracranial pathologies, especially in terms of continuous monitoring of brain injured patients to identify states of diminished volume compensation capacity.
2. Volume–pressure relationships in the cerebrospinal space
In adult humans, the skull is viewed as a rigid, nondistensible box of fixed volume filled with three major components: brain tissue (approx. 80%), cerebrospinal fluid (CSF; approx. 10%), and cerebral blood (approx. 10%) (Greenberg 2016). The cerebrospinal compartment, enclosed by a boundary with severely limited ability to deform, presents unique biomechanical conditions with a high degree of coupling between different biological subsystems (Zamir et al 2018). Traditionally, ICP was defined as the pressure of CSF in the brain. Nowadays, with widespread use of intraparenchymal microtransducers, this definition had to be slightly modified. Hence, ICP is considered as the pressure in the intracranial compartment and includes the contribution (but not the mathematical sum) of different components such as cerebral blood, CSF, interstitial fluid, parenchymal cells, and in case of pathologies, additional space-occupying lesions (Gomes and Bhardwaj 2009). Depending on the location of the sensor, it could refer to pressure within the lateral ventricles, brain parenchyma, or the subdural or epidural spaces.
According to a theoretical description called the Monro–Kellie doctrine (first outlined in the works of Monro (1783) and Kellie (1824) and later refined by Cushing (1926)), in normal circumstances the volumes of the three major intracranial components exist in a state of equilibrium such that increases in the volume of one component are balanced by decreases in the volume of another. The 'static' Monro–Kellie doctrine gives equal weight to all three components. In reality, the equilibrium is not immediate as the changes in the volumes are dynamic, owing to different rates of changes in blood versus CSF circulation or edema growth, and the model tends to underappreciate the role of the venous system in causing the imbalance between arterial blood inflow and venous outflow (Wilson 2016, Wilson and Imray 2016). Nevertheless, the Monro–Kellie doctrine identifies the basis of the volume–pressure relationship in the intracranial space. As neither of the intracranial compartments is considered compressible, volume compensation mostly occurs through outflow of venous blood outside the intracranial space and displacement of CSF into the spinal subarachnoid space (SAS) (Germon 1988). In contrast to the cranial dura which is closely adherent to the cranial bone, the spinal dura is only partially attached to the spinal canal. Due to its elastic collagen structures, the spinal dura can be distended, particularly in perpendicular directions (Tunturi 1978), allowing spinal SAS volume to vary. These volume variations also depend on the transmural pressure gradient between CSF and epidural venous pressure. By allowing fast withdrawal of CSF from the cranial compartment to the spinal compartment, the spinal SAS participates in buffering cerebrospinal volume changes (Magnæs 1976, Gehlen et al 2017). Within the range permitted by the compensatory reserve, addition of volume into the intracranial space is accompanied by relatively small changes in mean ICP; but after the compensatory reserve is exhausted, further volume expansion results in ICP elevation. Consequently, at each time instant ICP depends on the mechanical balance between the intracranial compartments and the ability of each compartment to buffer variations in volume.
The dynamic relationship between volume and pressure in the intracranial space is mathematically expressed by a nonlinear model derived from observational studies called the pressure–volume (P–V) curve (Ryder et al 1953, Löfgren and Essen 1973). Although the range of volumes and pressures covered by the characteristic varies in individual patients, generally the model can be divided into three regions (figure 1(a)). At low intracranial volume (region A), with working compensatory mechanisms, increases in volume produce slight and proportional changes in pressure. In the steep exponential portion (region B), as intracranial volume increases and the compensatory reserve is gradually exhausted, even small volume increments result in progressively larger changes in pressure. The third part (region C) corresponds to a breakpoint in the P–V curve observed at critically elevated ICP where the volume–pressure relationship is disturbed by collapse of cerebral arterial blood vessels and derangement of cerebrovascular reactivity (Löfgren and Essen 1973).

Figure 1. Schematic representation of the relationship between (a) the pressure–volume (P–V) curve and (b) changes in cerebrospinal compliance (C). Region A: baseline intracranial volume with high compliance and good compensatory reserve. This region is considered flat, with little to no change in pressure for a given volume increment. Region B: gradual reduction in compliance accompanying the increase in intracranial volume and corresponding exponential increase in intracranial pressure. Region C: collapse of cerebral vasculature at critically high intracranial pressure. Secondary rise in cerebrospinal compliance. See also: Czosnyka (2021).
Download figure:
Standard image High-resolution imageCerebrospinal compliance (figure 1(b)) is a measure derived from the P–V curve, expressed as the inverse slope of the curve, or the ratio of change in volume ΔV to change in pressure ΔP (units: ml/mmHg) (Marmarou et al 1975):

Compliance describes quantitatively the ability of the craniospinal space to adapt to changes in volume. If the change in pressure produced by a given increase in volume is small, the system is characterized by high compliance. As the compensatory reserve decreases and the pressure response to a given volume increment becomes larger, a reduction in compliance is observed. Although often presented as a single parameter, brain compliance is in fact a combination of the compliances of the CSF compartment, subjected to the pressure of the CSF, and the compliance of the vascular system, subjected to blood pressure and CSF pressure on either side of the vascular walls. In this review the term 'compliance' is used to refer to cerebrospinal, and not arterial compliance, unless explicitly stated otherwise.
3. Clinical significance of monitoring the volume–pressure relationships
In the clinical setting, ICP is primarily characterized by its mean value averaged over a longer period of time (usually 5–30 min (Czosnyka et al 2007)). Based on a systematic review of studies on normal ICP values (Norager et al 2021), the reference range for intracranially measured ICP in the upright and supine positions is 6–8 mmHg and 1–16 mmHg, respectively. For lumbar measurements, which are exclusively performed with the patient's head at the level of the puncture site to avoid the influence of gravity, the reference range is 7–17 mmHg in the lateral position and 6–16 mmHg in the supine position. Certain variations in ICP are also associated with factors such as age, head elevation, respiration, and systemic blood pressure (Gomes and Bhardwaj 2009), and the criteria for raised ICP vary between specific disorders. For instance, in patients suspected of hydrocephalus, ICP over 15 mmHg may already be considered elevated (Czosnyka et al 2017). In TBI, current clinical guidelines recommend ICP-lowering treatment over 22 mmHg (Carney et al 2017). However, despite its widespread use, the utility of ICP monitoring, particularly with one general treatment threshold for the whole population, remains the subject of controversy (Czosnyka et al 2007, Lavinio and Menon 2011, Chesnut et al 2014, Hawthorne and Piper 2014, Heldt et al 2019), and some authors attribute the limitations of the current approach to the missing information on cerebrospinal buffering capacity.
As shown by the P–V curve, high ICP is by itself an indicator of decreased compliance (unless ICP exceeds the critical threshold associated with vessel collapse), and upon detection of elevated ICP appropriate ICP-lowering strategies should be introduced to reduce it to a safe level. However, normal ICP alone cannot be regarded as a sign of sufficient compensatory reserve. Within the margin of volume compensation, ICP may still be relatively low, but significant amounts of volume may have already been displaced and further increases may not be tolerated. Elevated mean ICP may signify that adverse effects on the brain have already occurred. In order to introduce therapeutic interventions at a sufficiently early point in time clinical protocols should include not only monitoring of mean ICP but also the state of cerebral compensatory reserve. Such a strategy would shift management from a reactive approach based on mitigating damage to preventing it from happening in the first place as it aims to identify in advance patients at risk of ICP elevation due to reduced buffering capacity.
TBI in particular is a multifactorial condition where the primary insult is often followed by complications leading to changes in intracranial volume, such as disturbances in CSF flow pathways, accumulation of cerebral blood, obstruction of venous outflow or brain swelling as well as evolving contusions (Stocchetti et al 2017). While in chronic conditions (e.g. nontraumatic hydrocephalus or tumor growth) the deterioration of the intracranial pressure–volume equilibrium is more gradual, in acute brain injury the intracranial volume changes may occur at a rapid rate, and the state of volume compensation needs to be monitored continuously in order to detect them in time.
4. Volume–pressure tests
Given the definition expressed by equation (1), direct assessment of compliance requires simultaneous measurement of changes in volume (i.e. the stimulus) and pressure (i.e. the system's response). A number of different approaches to this task have been proposed, mostly in the 1970s, and they are used to this day in chronic conditions such as hydrocephalus. Miller et al (Miller and Garibi 1972, Miller et al 1973) introduced a metric called the volume–pressure response (VPR), defined as the change in ICP induced by a 1ml addition or withdrawal of fluid from the CSF space, which expresses cerebrospinal elastance (the inverse of compliance). Marmarou et al (1975) proposed an approach where the pressure response is measured following the injection of a known volume into the CSF space, usually via bolus injection, producing a straight line whose slope is called the pressure–volume index (PVI); PVI expresses the volume necessary to increase the pressure tenfold. In the infusion test, first proposed by Katzman and Hussey (1970) and now usually performed in a modernized form called the computerized infusion test (Børgesen et al 1992), volumetric manipulation is performed in a slow, continuous manner by adding known volumes of fluid to the CSF space at a constant rate rather than through bolus injection. Based on a mathematical model of CSF dynamics (Marmarou 1973), the resulting ICP recording can be fitted to an analytical solution of the model to produce cerebral compensatory parameters, including cerebrospinal compliance. Interestingly, PVI estimated using slow infusion is generally lower than the value assessed using bolus injection. The explanation for this difference remains largely unknown. Some authors proposed that the slow infusion and bolus methods explore different components of compliance based on the different time constants of the injected volumes. The bolus method would be fast enough to prevent the effect of CSF and blood transfer, allowing to measure the 'physical' compliance of the system; on the contrary, the slow infusion may take long enough for the fluid transfer as well as cerebral autoregulation, influencing the total craniospinal volume and allowing to measure 'physiological' compliance (Anile et al 1987). Moreover, the viscoelastic behavior of brain tissue probably has a substantial impact on the dynamic pressure response, increasing with the speed of volume manipulation (Bottan et al 2013).
Compliance estimation based on addition of fluid to (or withdrawal from) the cerebrospinal space is the established 'gold standard' method and the only technique capable of measuring absolute values of compliance expressed in ml/mmHg. However, the requirement for external volume manipulation remains its major drawback and the likely reason for the limited use of compliance in clinical management, especially in critically unstable brain injury patients. In order to assess compliance using either of the methods described above, one has to obtain pressure readings at different volume levels. As a result, the measurement can only be performed intermittently, making it unsuitable for routine monitoring in settings such as the NCCU (Robertson et al 1989). The Spiegelberg brain compliance monitor (Piper et al 1999) was an attempt to translate this approach for continuous use with a periodically expanding intraventricular balloon acting as a means of manipulating intracranial volume, but it has not been introduced to standard practice, presumably due to unsatisfactory performance (Kiening et al 2003). Additionally, the changes in volume required by the 'gold standard' methods may result in unintentional, potentially dangerous increases in ICP, such as the plateau waves of ICP which are related to uncontrollable rise in arterial blood volume and may drive ICP well above 60 mmHg. This is of particular importance in acute brain injury patients already at risk of uncontrolled intracranial hypertension (IH); external volume manipulation also carries the risk of infection due to the invasive nature of the procedure (Chopp and Portnoy 1980, Robertson et al 1989).
5. Analysis of ICP pulse waveform
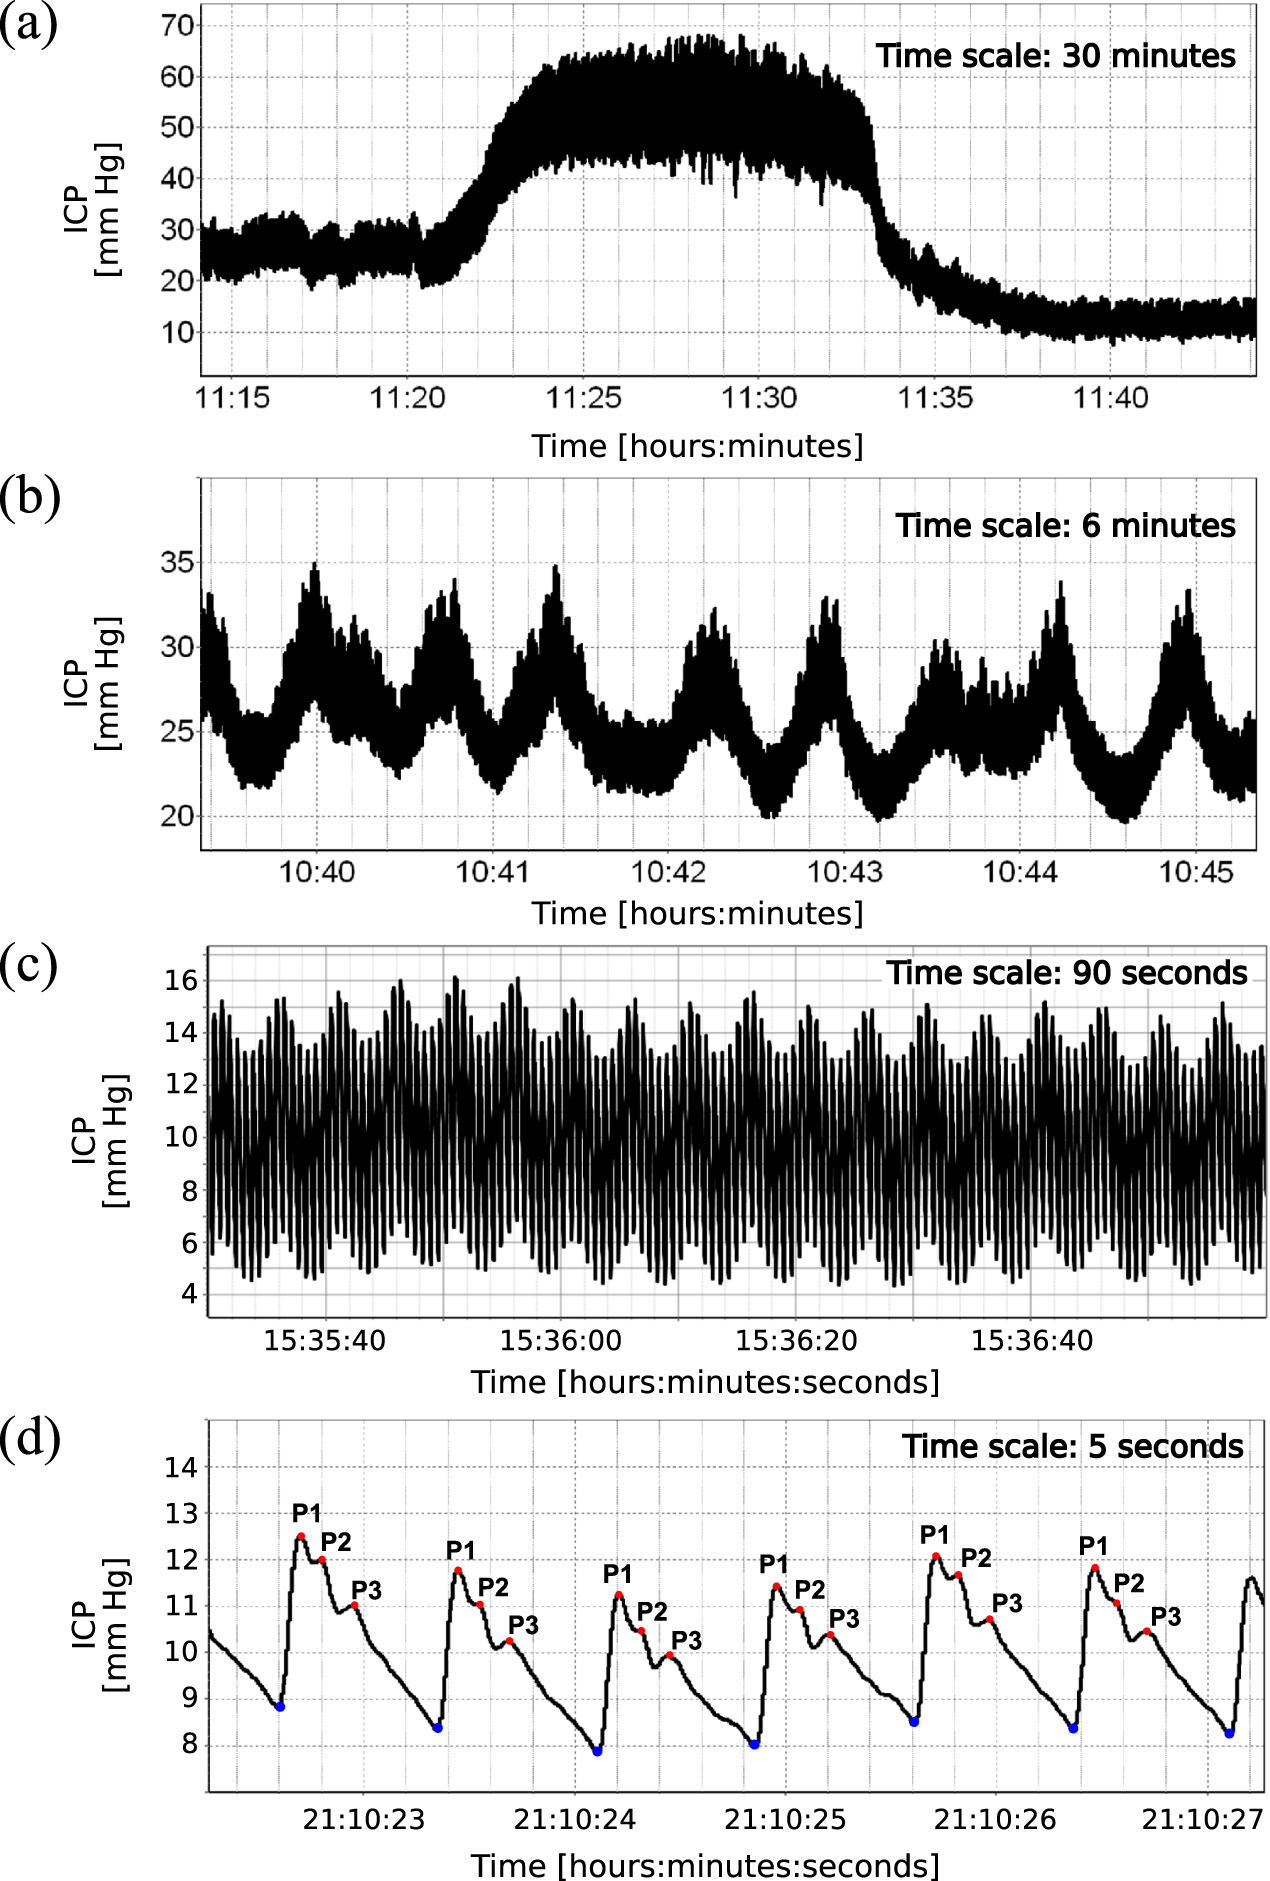
While the clinical applications of ICP monitoring focus primarily on its mean value, ICP is in fact 'more than a number', and detailed analysis of the signal can provide much more information than the simple average value (Kirkness et al 2000, Czosnyka et al 2007, Wagshul et al 2011); see figure 2. In the time domain, the signal consists of three overlapping components superimposed on the fluctuations in mean ICP level, which are separated in the frequency domain by different oscillation periods into slow waves (0.3–3 cycles min−1; figure 2(b)), respiratory waves (8–20 cycles min−1; figure 2(c)), and the cardiac waves (40–160 cycles min−1; figure 2(d)) (Kasprowicz et al 2016). Slow waves and respiratory waves (however the latter to a lesser extent) are considered useful in the assessment of cerebral autoregulation. The waveform of the cardiac waves (commonly called the pulse waveform) is in turn believed to contain meaningful information on cerebrospinal pressure–volume compensation.

Figure 2. Illustrative examples of different components of a high-resolution intracranial pressure (ICP) recording. (a) ICP plateau wave—a sudden, rapid elevation of ICP lasting usually from 5 to 20 min. (b) B-waves—slow oscillations with a frequency of 0.3–3 cycles min−1. (c) Respiration-related oscillations with a frequency of 8–20 cycles min−1. (d) ICP pulse waveform—cardiac-related oscillations with a frequency of 40–180 cycles min−1. Pulse onset points are marked by blue dots. Peaks P1, P2, and P3 are marked by red dots.
Download figure:
Standard image High-resolution imageIn general, the pulse waveform is associated with fluctuations in cerebral blood volume that occur naturally with each heartbeat. During each cardiac cycle, arterial blood inflow and subsequent asynchronous venous outflow produce short-term changes in intracranial blood volume, and consequently, rhythmic pulsatile changes in the ICP signal synchronized with heart rate (Ambarki et al 2007). The ICP pulse waveform usually exhibits three distinct local maxima, or peaks, denoted P1 ('percussion wave'), P2 ('tidal wave'), and P3 ('dicrotic wave'), with P2 and P3 separated by the dicrotic notch (Germon 1988) (figure 2). This observation was made in the late 1970s by Castel and Cohadon (1976) as well as Gega et al (1980) who identified the three peaks as components waves of the ventricular pulse and noted the relative increase in P2 and P3 during increase in mean ICP. To date, the precise origin of the peaks remains a subject of debate (Czosnyka and Czosnyka 2020), but the overall waveform shape has been linked for a long time to a combination of arterial and venous factors and intracranial volume–pressure relationships (Dardenne et al 1969). The earliest peak, P1, is synchronous with the systolic peak of the arterial blood pressure (ABP) pulse and associated with the propagation of the arterial pulse and immediate distention of the arterial walls (Fan et al 2008, Carrera et al 2010). Peaks P2 and P3 are related to the interaction between changes in cerebral blood volume and the volume compensation mechanisms, with P2 shown to be synchronous with the maximum of estimated cerebral arterial blood volume pulse (Carrera et al 2010).
In contrast to the volume–pressure tests based on controlled, externally induced changes in intracranial volume, ICP pulse waveform analysis assesses the pressure response to naturally occurring volume changes. Under normal conditions, specifically at low mean ICP, the ICP pulse waveform presents the three characteristic peaks arranged in a descending saw-tooth pattern, with P1 as the dominant peak (Castel and Cohadon 1976, Gega et al 1980, Portnoy and Chopp 1980). As mean ICP increases, the cardiac-related oscillations in cerebral blood volume produce progressively larger short-term changes in ICP, manifested as increased ICP pulsatility, and the peaks gradually become less defined, with the waveform eventually reaching a 'rounded' or 'monotonic' shape. Due to the unknown extent of volume change in each heartbeat, compliance estimators derived from the ICP pulse waveform cannot be translated into absolute measures obtained with the volume–pressure tests (Czosnyka and Citerio 2012). However, they present a strong advantage for acute brain injury management as they allow for continuous assessment of compliance and in this sense overcome the major disadvantage of the 'gold standard' approach which can only be performed intermittently through external and invasive intervention. Below we discuss the various methods of ICP pulse waveform analysis proposed so far, with a summary of the major approaches presented in table 1.
Table 1. Summary of the major approaches to compliance assessment by means of ICP pulse waveform analysis.
| Analysis method | Basis and interpretation | Major findings | Technical considerations and limitations |
|---|---|---|---|
| Pulse amplitude (AmpICP) (Szewczykowski et al 1977, Avezaat et al 1979) | AmpICP is treated as the pressure response to short-term cardiac-related changes in cerebral blood volume. Based on the P–V curve, AmpICP rises with increases in intracranial volume and mean ICP | AmpICP is elevated in TBI patients with more severe injuries (Howells et al 2012) and in those with poor outcome (Holm and Eide 2008), but the variability in AmpICP may be too high to enable reliable clinical applications (Wilkinson et al 1979) | • AmpICP may be calculated in the time domain (peak-to-nadir value) or in the frequency domain (amplitude of the fundamental component) |
| • AmpICP describes cerebrospinal elastance multiplied by unknown cerebral fraction of blood stroke volume | |||
| • AmpICP is highly dependent on vascular factors | |||
| RAP index (Czosnyka et al 1988) | RAP index is calculated as the moving correlation coefficient between mean ICP and AmpICP in 5 min windows with the following interpretation: | • RAP-weighted mean ICP is a better predictor of outcome after TBI than standard mean ICP (Calviello et al 2018, Zeiler et al 2019) | • RAP index describes the individual's 'working point' along the P–V curve rather than cerebrospinal compliance |
| • RAP close to 0—good compensatory reserve | • Elevated RAP is associated with the presence of pathologies in CT scans of TBI patients (Zeiler et al 2018b) | • RAP index may be influenced by spontaneous changes in mean ICP and differences between sensor locations (baseline errors) | |
| • RAP close to 1—diminished compensatory reserve | |||
| • RAP below 0—deranged cerebrovascular reactivity | |||
| Spectral centroids (Robertson et al 1989, Berdyga et al 1993) | HFC is calculated as the center of mass of the ICP amplitude spectrum in 4–15 Hz frequency range | • Elevated HFC is associated with worse outcome and higher mortality after TBI (Robertson et al 1989, Uryga et al 2022) | • Fourier analysis assumes that the signal is stationary which may not be correct in clinical conditions |
| HHC is calculated as the center of mass of ICP harmonics (multiples of the fundamental frequency) numbered from 2 to 10 | • Opposite pattern of changes in HFC differentiates transient from refractory IH (Contant et al 1995) while elevated HHC may be a predictor of IH (Uryga et al 2022) | • Spectral indices cannot be translated to units of compliance and may be difficult to interpret by clinicians | |
| HFC and HHC increase with reduced compliance | |||
| P1/P2 ratio (Cardoso et al 1983) | P1/P2 ratio is calculated as the height ratio of the first two peaks of a single ICP pulse waveform. In normal compliance conditions, P1/P2 exceeds 1. P1/P2 ratio decreases with reduced compliance | • P1/P2 ratio is closely correlated with 'gold standard' compliance estimates obtained using volumetric manipulation (Kazimierska et al 2021a) | • P1/P2 ratio cannot be expressed in units of compliance due to unknown cerebral fraction of stroke volume |
| Some studies use the inverse P2/P1 ratio | • P2/P1 ratio is elevated in patients with IH episodes but P2/P1 ratio over 0.8 is not a reliable predictor of impending IH (Fan et al 2008) | • Peak detection is difficult due to large variability of ICP pulse waveforms and no existing solution has been introduced to the clinical setting. The ratio cannot be calculated if one of the peaks is not visible | |
| ICP pulse classification (Li et al 1993, Nucci et al 2016) | ICP pulse waveforms are classified on a scale from normal (P1 as the dominant peak) to pathological (rounded waveform). The occurrence of pathologically altered waveforms increases with reduced compliance | Pathologically altered waveforms occur more frequently in TBI patients who died and may occur at relatively low mean ICP levels (Mataczyński et al 2022a, Uryga et al 2022) | • The classification approach is a generalization of the P1/P2 ratio. Low number of recognized classes may lead to loss of information on pulse shape variability |
| • Classification results depend on the accuracy of the underlying model (e.g. neural network) | |||
| Relationship with CBFV (Kim et al 2015) | The ICP pulse shape is compared to the CBFV waveform using spectral phase shift or the ratio of ascending pulse slopes. Shift between the signals increases with reduced compliance | Increasing shift between the signals reflects changes in compliance associated with increasing mean ICP in NPH (Kim et al 2015, Ziółkowski et al 2021) but studies in TBI patients have not been conducted | • This approach requires simultaneous monitoring of two signals. CBFV measurement requires a trained operator and is difficult to perform over long periods |
| • Shift between the signals may reflect changes in both ICP and CBFV, not just compliance-related effects on ICP | |||
| Model-based Ci (Kim et al 2009b) | Changes in CaBV are estimated from CBFV based on a model of cerebral circulation. Ci is calculated as the ratio of amplitudes of ICP and CBFV. Ci decreases with reduced compliance | Ci is closely correlated with 'gold standard' compliance estimates obtained using volumetric manipulation (Kazimierska et al 2021a) | • This approach requires simultaneous monitoring of two signals, as above |
| • Ci can be analyzed over time but not compared between individuals due to unknown diameter of insonated artery | |||
ICP—intracranial pressure, CBFV—cerebral blood flow velocity, CaBV—cerebral arterial blood volume CT—computed tomography; P–V—pressure–volume (curve); TBI—traumatic brain injury, NPH—normal pressure hydrocephalus.
5.1. ICP pulse amplitude and related indices
The earliest applications of pulse pressure analysis in compliance assessment were proposed in the late 1970s. Szewczykowski et al (1977) investigated the changes in pulse amplitude of ICP (AmpICP) associated with alterations in mean ICP to estimate cerebrospinal elastance. Based on the simplifying assumption that the cerebral fraction of cardiac stroke volume is constant in each heartbeat, and therefore AmpICP differs from elastance only by the constant factor 1/δ V (where δV denotes the intracranial volume increment in each cardiac cycle), the authors proposed to analyze elastance by calculating the slope of the amplitude–pressure (AMP–P) characteristic (figure 3(a)). The study showed that the AMP–P plot consists of two regions, representing the baseline state of nearly constant elastance and then a gradual increase in elastance, respectively. It has since been established that the AMP–P plot may contain one more region, matching the right-side deflection of the P–V curve at very high ICP, where AmpICP decreases again following the breakpoint associated with the collapse of cerebral blood vessels (Czosnyka et al 1996).

Figure 3. (a) Schematic representation of the relationship between the pressure–volume (P–V) curve (left) and the amplitude–pressure plot (middle). Region A: baseline intracranial volume, low intracranial pressure with pulse amplitude independent of mean pressure level. Region B: gradual increase in pulse amplitude accompanying the increase in intracranial volume and corresponding increase in pressure. Region C: decrease in pulse amplitude following the collapse of cerebral vessels and derangement of cerebrovascular reactivity at critically high mean intracranial pressure. (b) Interpretation of the RAP index. RAP index combines the information from the P–V and AMP–P curves and is calculated in a moving 5 min window as the Pearson correlation coefficient between the mean and pulse amplitude of intracranial pressure (averaged every 10 s). Values close to 0 indicate initial region of the P–V curve (green), values close to 1 suggest reduced compensatory reserve (yellow), and negative values correspond to deranged cerebrovascular reactivity (red). See also: Czosnyka et al (1996).
Download figure:
Standard image High-resolution imageAround the same time a study by Avezaat et al (1979) compared the changes in AmpICP and VPR at different mean ICP levels in dogs. The authors observed that AmpICP increases linearly with mean ICP up to the level of 60 mmHg, which led to the conclusion that the cerebral fraction of stroke volume can be assumed to be constant over a wide range of mean ICP and the AMP–P slope is an adequate measure of cerebrospinal elastance. Diverging trends in AmpICP and VPR over that threshold were attributed to a failure of cerebral autoregulation at highly elevated mean ICP. However, the authors noted that in order to use the AMP–P approach in clinical practice as an absolute measure of the volume–pressure relationship, the change in cerebral blood volume should be estimated for each patient at the beginning of the ICP recording. Moreover, the same group highlighted in a later study (Avezaat and Van Eijndhoven 1986) that the variability of pulsatile cerebral blood volume in humans is in fact quite high, meaning that the AMP–P slope cannot be taken as an absolute index of elastance without measuring the magnitude of change in cerebral blood volume in each cardiac cycle, a variable that is difficult to estimate and mostly ignored in studies on AmpICP.
Still, to date AmpICP is arguably the most frequently studied feature of the ICP pulse waveform (Wagshul et al 2011). Some authors propose to estimate AmpICP directly in the time domain, as the peak-to-nadir value of the pulsatile ICP signal (figure 4(a)) (Morgalla et al 1999, Eide 2006), while others employ spectral analysis to calculate AmpICP as the amplitude of the fundamental component of the signal's Fourier spectrum (figure 4(b)) (Czosnyka et al 1988). The two approaches have been said to produce strongly correlated results (Pearson correlation coefficient of 0.97) (Czosnyka et al 2007) and neither has been conclusively proven to offer more clinical benefit (Wagshul et al 2011), although some studies suggested that the frequency domain approach underestimates AmpICP when there is heart rate variability or waveform distortion (Holm and Eide 2008). It should also be noted that while in recent literature spectral AmpICP is almost exclusively calculated on 10 s fragments of the signal, the precise settings for the Fourier transform algorithm (e.g. window type and length) are not reported and there is no universal recommendation available.

Figure 4. (a) Intracranial pressure (ICP) recording with pulse amplitude of ICP estimated in the time domain (TD AmpICP) marked as the peak-to-nadir amplitude of a single pulse. (b) Amplitude spectrum of the ICP recording cropped to the range related to the cardiac cycle. Frequency domain AmpICP (FD AmpICP) is calculated as the amplitude of the fundamental (first) harmonic (marked by red dot) which is identified as the maximum of the spectrum in the range 0.6–3 Hz (corresponding to approx. 40–180 bpm). (c) Amplitude spectrum of the ICP recording cropped to the frequency range used to obtain the high frequency centroid (HFC). HFC is calculated as the weighted average from all samples contained within the range from 4 to 15 Hz (green rectangle) and can be considered the center of mass of the spectrum, where mass is represented by the amplitude of each frequency component. (d) Amplitude spectrum of the ICP recording cropped to the harmonic range used to obtain the higher harmonics centroid (HHC). HHC is calculated as the weighted average from the harmonics (i.e. multiples of the fundamental frequency) numbered from 2 to 10 (green dots). In contrast to HFC which is calculated in Hz, HHC is expressed in harmonic number. Adapted with permission from Uryga et al (2022). CC BY-NC-ND 4.0.
Download figure:
Standard image High-resolution imageOver the last few decades changes in AmpICP have been investigated both in chronic conditions (Eide and Brean 2006a, Czosnyka et al 2009, Eide 2016) and acute brain insult (Czosnyka et al 1996, Eide and Sorteberg 2006, Eide et al 2011, Holm and Eide 2008, Hall and O'Kane 2016). In TBI, studies indicated that increased AmpICP is associated with severity of injury (Howells et al 2012) and worse outcome (Holm and Eide 2008). However, the validity of using elevated AmpICP as an indicator of reduced compliance in the clinical setting has been called into question. A study by Wilkinson et al (1979) noted that while increased AmpICP generally correlated positively with increases in mean ICP and intracranial volume, the large variability of responses rendered the parameter of limited clinical utility. It has also been shown in animals that the change in AmpICP during hypercapnia is related to cerebral arterial vasodilation rather than the steepening of the P–V curve (Portnoy and Chopp 1981), and there is a significant correlation between the slope of AMP–P characteristic and mean arterial pressure (Kaczmarska et al 2021), which highlights the importance of considering vascular factors in interpreting changes in AmpICP.
A different approach, proposed by Czosnyka et al (1988), is based on combining the information contained in both the P–V and AMP–P characteristics (figure 3(b)). The RAP index (whose name was derived from the common symbol for the correlation coefficient, R, and the words 'amplitude' and 'pressure') is defined as the moving Pearson correlation coefficient between mean ICP and AmpICP (usually expressed as 10 s averages) calculated over longer periods, usually 5 min. Positive values of RAP close to 0 suggest good compensatory reserve as the changes in AmpICP are not driven by oscillations in mean ICP (i.e. there is little to no correlation). Values close to 1 represent decreased compensatory reserve, with changes in mean ICP producing corresponding changes in AmpICP as expected in the steep part of the P–V curve. Finally, negative values are associated with disturbed cerebrovascular reactivity following the upper breakpoint of the P–V curve. While not a direct estimate of cerebrospinal compliance, RAP index serves as an indicator of the patient's 'working point' on the P–V curve and can be calculated continuously, therefore allowing for identification of patients with exhausted capacity for volume compensation.
Since its introduction in the 1980s, RAP index has been studied mostly in dysfunctions of CSF circulation (Kim et al 2009a, Weerakkody et al 2011), but also in relation to brain injury (Czosnyka et al 1994, Balestreri et al 2004, Timofeev et al 2008, Zeiler et al 2018b). The superiority of RAP index over other measures, primarily AmpICP, in clinical assessment of brain injured patients has been disputed due to its susceptibility to baseline effect errors, i.e. shifts in mean ICP that are either spontaneous or related to sensor location (Eide et al 2014, Hall and O'Kane 2016). It was noted that while AmpICP was nearly identical in two measurement sites, mean ICP changed substantially, producing differences in the RAP index large enough that they may alter patient management (Eide et al 2014). Another study demonstrated worse performance of the RAP index in terms of differentiating patients before and after surgery or thiopental treatment when compared to AmpICP (Howells et al 2012). However, RAP-weighted mean ICP (defined as ICP * (1 – RAP)) and sometimes termed 'true ICP') has been shown to outperform standard mean ICP in prediction of outcome after TBI (Czosnyka et al 2005, Calviello et al 2018, Zeiler et al 2019). Moreover, a similar approach was continued in defining the RAC index, a correlation-based measure calculated from AmpICP and cerebral perfusion pressure which theoretically includes information on both cerebrospinal compensatory reserve and cerebrovascular pressure reactivity (Zeiler et al 2018a), and the respiratory amplitude quotient (RAQ), calculated as the ratio of the amplitude of the respiratory wave to the amplitude of the respiration-induced variation in AmpICP that—unlike RAP—selectively reflects effects caused by respiration rather than all changes in mean ICP (Spiegelberg et al 2020).
5.2. Spectral analysis
In addition to providing an alternative method of calculating AmpICP (figures 4(a)–(b)), spectral analysis based on the Fourier transform was used to obtain a more detailed description of the changes the ICP pulse waveform undergoes at different mean ICP levels. Chopp and Portnoy (1980) proposed a systems analysis approach to characterize the ICP pulse waveform in relation to the ABP pulse, with the latter treated as input and the former as output of the cerebrospinal system. The authors reported enhanced transfer from ABP to ICP at increased mean ICP levels, suggesting that cerebral vasodilation which accompanies ICP elevation diminishes the ability of the arterioles to attenuate the arterial pulse. Takizawa et al (1987) investigated the ICP signal's Fourier spectrum at higher mean ICP and showed that the higher harmonics of ICP are reduced compared to the fundamental wave, leading to increased similarity between the ICP waveform and the simple sine wave. This finding was in line with the rounding of the ICP pulse observed in the time domain. Subsequent animal studies led to characterization of the intracranial system in basal conditions as a 'notch filter' attenuating the cardiac frequency more than the higher frequency components (Wagshul et al 2009) to protect cerebral vasculature from the highly pulsatile arterial input (Kim et al 2012). Reduction in cerebrospinal compliance has been shown to remove the 'notch filter' characteristics (Zou et al 2008). In TBI patients, Piper et al (1990) identified different types of transfer function spectra between ICP and ABP. Most importantly, they obtained contrasting results in patients with relatively low ICP, those with relatively low ICP but likely reduced vascular tone, and those with elevated ICP associated with vascular mechanisms. Generally, however, methods based on the transfer function from ABP to ICP (or the 'notch filter' properties of the system), although scientifically interesting, did not find wider application in clinical practice. The reason for this may lie in the fact that the relationship between ABP and ICP in the higher frequency range containing heart rate and its harmonics is by nature highly nonlinear, making both analysis and interpretation of the results very challenging.
A different approach was explored in research on the high frequency centroid (HFC), defined as the frequency-presented center of mass of the ICP power spectrum in the arbitrary 4–15 Hz range (Robertson et al 1989) (figure 4(c)). Bray et al (1986) examined the changes in HFC in relation to PVI and showed that HFC around 7Hz is considered normal whereas an increase up to 9 Hz corresponds to exhausted compensatory reserve. Later studies using HFC as a tool for continuous monitoring in TBI patients demonstrated that increased HFC correlates with higher mortality and occurrence of IH (Robertson et al 1989), and opposite direction of changes in HFC can differentiate transient from refractory hypertension episodes (Contant et al 1995). A different spectral centroid, called the higher harmonics centroid (HHC), was proposed to obtain a measure theoretically less dependent on heart rate than HFC (Berdyga et al 1993) (figure 4(d)). In contrast to HFC, which is calculated in the same frequency range regardless of the fundamental cardiac frequency, HHC attempts to take into account variations in heart rate by defining the analysis range in harmonic numbers (i.e. multiples of the fundamental frequency) rather than Hz. An increase in HHC can therefore be interpreted as an increase in the distortion of the waveform irrespective of heart rate. HHC calculated from the 2nd through 10th harmonic was shown to be positively correlated with mean ICP in TBI patients and to decrease significantly during ICP plateau waves (Zakrzewska et al 2021). Recently, assessment of both centroid metrics in the same database of TBI patients demonstrated that while elevated HFC is associated with mortality and poor outcome, HHC may potentially serve as an early warning sign of IH due to the occurrence of a breakpoint in the relationship between HHC and mean ICP at a level of approximately 25 mmHg (Uryga et al 2022).
However, it should be noted that the use of the Fourier transform requires that the signal in question satisfies the stationarity condition, meaning roughly that its spectral content remains unchanged over time. During continuous ICP monitoring, with frequent alterations in heart rate and rapid changes in the patient's condition, especially during the first days following acute brain insult, this requirement may not always be fulfilled, potentially making this approach imprecise for ICP analysis. Furthermore, spectral indices cannot be translated directly to a description of the waveform shape in the time domain, which presents a challenge for the clinician interpreting the results.
5.3. Slope of the ICP pulse waveform
In the 1980s, Foltz and Aine (1981) proposed to analyze the upslope of the ICP pulse waveform defined as the pulse amplitude divided by latency of the initial ascending part of the pulse (i.e. from onset to the maximum). The authors noted that the difference in venous outflow between the inspiration (I) and expiration (E) phase of the respiratory cycle allows for the estimation of intracranial compliance related to venous volume. The I/E ratio was shown to differentiate hydrocephalic from nonhydrocephalic patients as well as specific types of hydrocephalus (Foltz et al 1990). In TBI patients, a positive correlation between the ICP slope and mean ICP was observed (Morgalla et al 1999, Westhout et al 2008). The slope (defined here as only the initial uptick of the waveform) was also demonstrated to decrease following decompressive surgery/evacuation and thiopental treatment (Howells et al 2012). However, despite its encouraging simplicity, this approach has not met wider application beyond the few cited studies.
5.4. Height ratio of peaks P1 and P2
As described earlier, under normal conditions the ICP pulse exhibits three distinct local maxima, called peaks P1, P2, and P3, whereas at elevated ICP the waveform becomes progressively more 'rounded' or 'monotonic', with the peaks gradually disappearing (Germon 1988). In 1983, Cardoso et al (1983) investigated the changes in the configuration of the characteristic peaks during alterations in mean ICP caused by different maneuvers. The authors noted that in addition to the previously known influence on AmpICP, hyperventilation-induced ICP reduction has a profound effect on the ICP pulse contour in the form of decreasing prominence of peak P2. It was suggested that since hyperventilation influences cerebral bulk volume (and with it, cerebrospinal compliance) through vasoconstriction of arterioles, the relative height of the first two characteristic peaks may provide an indirect measure of compliance (figure 5). Based on those observations, a study in normal pressure hydrocephalus (NPH) patients undergoing constant rate infusion studies compared changes in the P1/P2 ratio to the 'gold standard' method using a mathematical model of CSF dynamics (Kazimierska et al 2021a). It was demonstrated that all three approaches differentiate 'high' and 'low' compliance conditions associated with the baseline (low mean ICP) and plateau (high mean ICP) phase of the infusion test, respectively. Furthermore, resulting time trends of compliance estimators for individual patients were strongly correlated with each other, confirming the possibility of monitoring cerebrospinal volume compensation through analysis of the shape of the ICP pulse waveform.
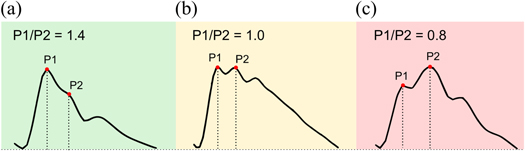
Figure 5. Illustrative examples of intracranial pressure pulse waveform shapes with different height ratio of peaks P1 and P2: (a) normal compliance (P1/P2 ratio >1), (b) slightly reduced compliance (P1/P2 ratio close to 1), (c) substantially reduced compliance (P1/P2 ratio <1).
Download figure:
Standard image High-resolution imageMeanwhile, the inverse P2/P1 ratio was proposed as a potential tool for prediction of impending ICP elevation. Studies in TBI patients demonstrated that the P2/P1 ratio is higher in patients who exhibit IH compared to those who do not (Fan et al 2008) and P2 elevation may be predictive of increased frequency of IH episodes (Mitchell et al 1997). Yet when used with a prediction threshold of 0.8, this approach showed low specificity, leading to the conclusion that elevated P2/P1 ratio alone is not a reliable indicator of increases in mean ICP as it was also present in the comparison data (Fan et al 2008). It should be noted, however, that the proposed threshold appears to have been chosen arbitrarily and possibly inappropriately. A P2/P1 ratio of 0.8 (equivalent to P1/P2 of 1.2) corresponds to a waveform with dominating peak P1 and slightly lower P2, which in turn corresponds to normal ICP; P2 can only be clearly said to dominate when the P2/P1 ratio exceeds 1. Accordingly, in the more recent studies on the P1/P2 ratio in NPH (Kazimierska et al 2021a, Ziółkowski et al 2021) almost all patients exhibited P1/P2 ratio < 1.2 (i.e P2/P1 > 0.8) at baseline and a reduction down to approx. 0.5 in the plateau phase. On the one hand, NPH and TBI are different clinical entities and patients in both groups may exhibit different pattern of changes in cerebrospinal compliance due to different underlying pathologies. On the other hand, one could argue that the apparent failure of the peak ratio method as a tool for IH prediction could be rectified by a more in-depth investigation of what constitutes an appropriate prediction threshold.
Nevertheless, while it has been confirmed that the ICP pulse waveform contains information about cerebrospinal compliance encoded in the height ratio of local maxima, accurate peak detection is a complex task due to the variety of pulse shapes observed in the clinical setting both in different patients and in the same patient over time (including also distorted waveforms that should be considered as artefacts but are not easily distinguished from valid pulses). A number of studies aimed to refine morphological analysis techniques in order to replace visual assessment of the waveform with reliable, repetitive automated tools. Hu et al (Hu et al 2009, but also Scalzo et al (2009, 2010), Asgari et al (2009)) developed an algorithm called Morphological Clustering and Analysis of Continuous Intracranial Pressure (MOCAIP) capable of assessing different pulse shape metrics, including peak height, latency, and curvature. Proposed as a generalized method of ICP pulse waveform analysis, MOCAIP-derived metrics have been used in a variety of scenarios, including prediction of ICP elevation (Hamilton et al 2009, Hu et al 2010) and identification of artefactual pulses (Megjhani et al 2019). In a small group of patients with slit ventricle syndrome, MOCAIP-based P2/P1 ratio was shown to correlate with enlargement of the lateral ventricles (Hu et al 2008). Various other attempts to solve the task of peak designation have also been reported (Calisto et al 2013, Elixmann et al 2012, Scalzo et al 2012, Lee et al 2016). Still, analysis of ICP peak configuration is yet to transition beyond the realm of research into the NCCU. The ICP signal is intricate and highly variable, and the computational algorithms proposed to date demonstrate varying levels of accuracy. Moreover, their technical complexity leads to limited understanding and acceptance in the medical community.
5.5. ICP pulse classification
In order to mitigate the drawbacks of the peak detection method, a different approach based on machine learning was presented where peak identification is substituted with easy to interpret visual criteria for overall pulse waveform morphology. The concept has been presented in 1993 by Li et al (1993) who described 11 distinct types of ICP pulses in various pathological states and noted that changing configuration of characteristic peaks is associated with the progressive increase in mean ICP. In 2016, Nucci et al (2016) revived this concept by isolating four classes of ICP pulse shapes in NPH patients and proposing an artificial neural network capable of classifying the waveforms. The categories ranged from normal waveforms with three peaks arranged in a descending saw-tooth pattern to fully rounded pathological waveforms with only one defined maximum. Using the proposed classification method, the authors compared the dominant ICP pulse waveform class with other parameters describing CSF circulation during constant rate infusion of fluid. The results showed that pathologically altered pulse waveform morphology at baseline is indicative of disturbances in intracranial elastance revealed by the infusion test.
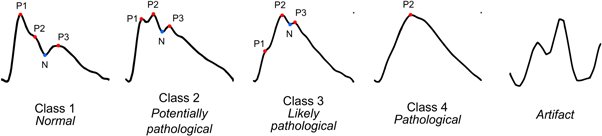
Recently, this method was adapted for application in continuous monitoring in brain injured patients using deep neural networks to classify ICP pulse shapes (Mataczyński et al 2022a). In this approach, the full long-term (i.e. spanning several days) high-resolution ICP recording is presented to the algorithm which first identifies individual pulse waveforms and then assigns each of them to one of the four classes proposed by Nucci et al (2016) or marks the pulse as an artifact and excludes it from further analyses (figure 6). The incorporation of pulse detection and artifact removal steps allows for the raw ICP recording to be processed in near real-time without manual inspection, potentially enabling continuous assessment of cerebrospinal compensatory reserve that could complement ICP measurement. Results of initial studies showed that TBI patients with unfavorable outcome present pathologically altered pulse shapes more often than those with good outcome (Kazimierska et al 2021b, Mataczyński et al 2022a) and taking into account the combination of increased mean ICP and pathologically altered ICP pulse shape enables more accurate mortality prediction in TBI patients than just elevated mean ICP (Mataczyński et al 2022b).
Figure 6. Illustrative examples of four characteristic types of intracranial pressure pulse waveform shapes representing progressive reduction of compliance identified by Nucci et al (2016) and the additional artifact class introduced in Mataczyński et al (2022a). Peaks P1, P2, and P3 are marked by red dots and the dicrotic notch (N) is marked by blue dots. Class 1: P1 dominating over P2 and P3, class 2: increased prominence of P2 with P1 exceeding or equal to P3, class 3: P2 dominating over P1 and P3 with P3 exceeding P1, class 4: rounded or triangular waveform with only one identifiable peak.
Download figure:
Standard image High-resolution image
However, straightforward use of the classification results at single pulse level requires simultaneous tracking of the occurrence of each of the four valid waveform types. Therefore, it is not easy to interpret by clinicians and leads to a loss of information on pulse shape variability over time. In order to present a simple, continuous index of compliance, a summary measure called pulse shape index (PSI) was proposed. PSI is calculated as the weighted average of class numbers and the percentage of pulses assigned to given class in a moving 5 min window. It is presented on a linear scale from 1 (only waveforms of class 1, indicating normal compliance) to 4 (only pathologically altered waveforms of class 4 associated with reduced compliance), and the removal of artifacts prior to analysis potentially improves the reliability of the calculations. Studies in a large, multi-center cohort of patients from the CENTER-TBI project showed that PSI is significantly elevated in patients who died after TBI even at relatively low mean ICP levels (below 15 mmHg) (Uryga et al 2022) while in patients who survived increases in PSI are only observed as mean ICP rises, in accordance with the P–V curve (unpublished data). Furthermore, elevated PSI was observed in patients with midline shift >5 mm and mass lesions >25 cm3 visible in computed tomography scans, indicating that this index reflects the volume imbalance in the intracranial space.
5.6. Relationship with other pulsatile signals
As described in the systems analysis approach (Chopp and Portnoy 1980, Takizawa et al 1987), pulsatile changes in ICP are believed to originate in arterial pulsations transmitted throughout cerebral vasculature. Due to the constraints of the skull boundary enclosing the intracranial space, direct measurement of ABP at the level of the brain is not routinely performed in humans for practical and ethical reasons, and ABP monitored peripherally differs significantly from the pressure registered centrally (O'Rourke 2009). However, transcranial Doppler (TCD) ultrasonography allows for noninvasive measurement of cerebral blood flow velocity (CBFV) in large cerebral arteries, primarily the middle cerebral artery, i.e. relatively close to the site of the ICP sensor, and therefore allows for the ICP signal to be investigated in relation to a different pulsatile component of the system.
A study by Kim et al (2015) in NPH patients analyzed spectral phase shift between CBFV and ICP recorded during the infusion test. The authors noted that at baseline, phase shift between the pulses was negative, with ICP trailing behind CBFV. Phase shift decreased further as mean ICP increased, indicating an increase in the time delay between the signals which may be attributed to progressive rounding of the ICP waveform. In the time domain, the relationship between the pulses was investigated using the ratio of pulse slopes (RPS), defined as the ratio of the inclinations from pulse onset to pulse maximum of CBFV and ICP (Ziółkowski et al 2021). It was shown that RPS decreases with increasing mean ICP, which corresponds to relatively small changes in the position of the systolic peak of CBFV but a substantial right-shift in the position of the maximum of the ICP pulse. Furthermore, both spectral phase shift and RPS at baseline exhibited significant negative correlation with elasticity revealed through analysis of the entire infusion test recording (Kim et al 2015, Ziółkowski et al 2021). This approach could therefore constitute a screening tool for reduced compliance that eliminates the need for volume manipulation. However, although TCD measurements are relatively widespread in the clinical setting, also in the NCCU, they require a trained operator and are difficult to perform over long periods, which limits the applicability of these indices in monitoring of acute brain injury patients in whom continuous compliance assessment would be of most benefit.
The CBFV signal has also been used to study relative changes in cerebral compartmental compliances: compliance of the cerebrospinal space (Ci ) and compliance of the cerebral arterial bed (Ca ) (Kim et al 2009b, 2012). Ci is calculated as the ratio of pulse amplitudes of changes in cerebral arterial blood bolume (CaBV) to ICP and Ca as the ratio of pulse amplitudes of CaBV to ABP, where CaBV is estimated from CBFV with a model of cerebral circulation (Avezaat and van Eijndhoven 1984, Kim et al 2009b). Due to the unknown cross-sectional area of the artery insonated to obtain CBFV, neither parameter can be calibrated to enable comparison between patients, and the observations are limited to relative changes over time. Nevertheless, it has been shown that this method accurately identifies the trend of decreasing Ci and increasing Ca during ICP plateau waves in brain injury patients (Kim et al 2009b, 2012) and decrease in both Ci and Ca during refractory IH (Kim et al 2012). Furthermore, changes in Ci during infusion test in NPH patients were strongly correlated with the 'gold standard' compliance estimated using the Marmarou model of CSF circulation (Kazimierska et al 2021a).
5.7. Noninvasive ICP pulse waveform estimation
In the NCCU, invasive measurement of ICP using ventricular catheters or intraparenchymal microsensors remains the current standard (Evensen and Eide 2020). Nevertheless, the requirement for surgical intervention to place the sensor intracranially and the risk of complications such as infection or hemorrhage limit the use of ICP measurements to severe conditions. Over the years there have been numerous attempts to introduce noninvasive ICP (nICP) estimates to clinical practice and therefore make this modality applicable to a wider population of patients. Some of those methods, such as magnetic resonance or computed tomography imaging and measurements of optic nerve sheath diameter, have the inherent disadvantage of only being suited to one-off assessment, making them a tool for triage rather than continuous monitoring. Various pulsatile signals that can be recorded continuously and noninvasively have been considered as potential sources of nICP: ABP, TCD-based CBFV recordings, diffusion correlation spectroscopy (DCS) measures of cerebral blood flow, near-infrared spectroscopy measures of hemoglobin concentration and oxygentation, and tympanic membrane displacement. TCD-derived pulsatility index was among the early measures correlated with ICP (Bellner et al 2004), but later studies did not confirm its utility (Behrens et al 2010, Figaji et al 2009). More recently, DCS has been proposed as a valid alternative to TCD in estimation of critical closing pressure, a parameter directly related to ICP (Farzam et al 2017, Wu et al 2021). Detailed description of all of those approaches is beyond the scope of this review as most of them produce only steady-state values rather than reflect the dynamic cardiac-induced changes; we refer the reader to existing reviews on the subject of ICP measurement (e.g. Robba et al 2016, Evensen and Eide 2020) and will focus only on the methods that allow for continuous estimation of nICP pulse waveform.
Among the modeling approaches, there have been attempts to estimate nICP from a combination of pulse ABP and TCD characteristics with a 'black box' model (i.e. a model using a set of mathematical transfer functions rather than a description of underlying physiology) (Schmidt et al 2000), a physiological model of cerebrovascular dynamics (Kashif et al 2012), and a simplified model using only estimated central aortic pressure waveform as input (Evensen et al 2018a). However, while the first two studies (as well as a different investigation comparing the two approaches (Cardim et al 2016)) asserted that the model generates full nICP waveforms, only beat-averaged results were presented, leaving the question of the accuracy of nICP pulse-derived indices unanswered. In the model using central aortic pressure without additional TCD-based metrics both the nICP waveform and derived parameters were shown to be too inaccurate to aid patient management (Evensen et al 2018a). Studies on nICP estimation from a model of ultrasound pulse wave propagation through the human head (Petkus et al 2002, Ragauskas et al 2003) showed good agreement between invasive and noninvasive traces of ICP waveforms, but did not attempt to derive quantitative metrics.
Using a different approach that estimates pulse nICP from the measurement of tympanic membrane (TM) pressure, based on the assumption that ICP is transmitted to the membrane through the inner ear via infrasonic waves, Lang et al (2003) observed that noninvasive HFC is equivalent to that obtained by invasive intraparenchymal monitoring. However, a later study by Evensen et al (2018b) reported that the cochlear aqueduct appears to act as a low-pass filter, resulting in substantial differences in time domain metrics. Similarly, Dhar et al (2021) showed a substantial discrepancy between the TM pulsation and expected ICP pulse shape in illustrative examples.
Of the most recent studies, two approaches deserve particular attention. Monitoring of nICP via a mechanical sensor placed in contact with cranial skin that detects beat-to-beat micrometric deformations of the skull has been shown to produce pulse morphology metrics (specifically, peak height ratio and peak latency) in good agreement with the 'gold standard' ventricular sensors (Brasil et al 2021b, de Moraes et al 2022, Brasil et al 2023). This novel approach was studied in various pathological conditions; in acute brain injury, the authors demonstrated that noninvasively obtained P2/P1 ratio over 1.2 is predictive of IH in patients with preserved skull integrity (Brasil et al 2021b). Furthermore, they showed that patients after decompressive craniectomy present significantly higher nICP P2/P1 ratio (i.e. more impaired cerebrospinal compensatory reserve) than those with intact skull (Brasil et al 2021a), suggesting that their method is capable of detecting disturbed intracranial volume–pressure relationships. On the other hand, a different group reported that nICP features obtained with this technique do not reliably predict IH in TBI patients (Ballestero et al 2023), pointing to the need for more detailed investigations.
Concurrently, Spiegelberg et al (2023) developed a device for noninvasive capacitive measurement of the head's dielectric properties from electrodes placed on the scalp. A modeling study confirmed that changes in the dielectric properties of the head correlate to the cardiac and respiratory cycles associated with changes in the volumes of cerebral blood and CSF (Karimi et al 2023). The signal provided by the device, denoted W, was shown through experimental hyperventilation studies to be, at least partially, of intracranial origin (Spiegelberg et al 2023) and the amplitude of its cardiac-related oscillations was demonstrated to change during head-up and head-down tilt testing in a way that reflects the alterations in blood and CSF volume induced by changes in body position (Boraschi et al 2023). The authors concluded that W may therefore contain meaningful information on craniospinal compliance; however, they have not yet reported comparative analyses between invasive and noninvasive methods of compliance assessment. Due to the limited signal-to-noise ratio and the undetermined influence of extracranial factors they have also not attempted to describe the waveform shape quantitatively (e.g. through the P1/P2 ratio).
Nevertheless, the techniques that enable noninvasive ICP pulse waveform monitoring are a relatively recent development and larger prospective studies proving their reliability are likely still forthcoming.
6. Missing links and future directions
Continuous monitoring of mean ICP has been an essential part of neurocritical care for more than half a century, and the advent of novel signal processing methods and machine learning techniques allowed for the concept of ICP pulse morphology as a measure of cerebrospinal compliance to be revisited in recent years. However, despite renewed interest in the ICP pulse waveform, a number of questions remain unanswered. Some earlier literature, notably (Czosnyka and Citerio 2012), expressed the view that compliance is strictly dependent on mean ICP and its estimation adds little information beyond the measured mean value. While that is true at elevated mean ICP, where the compensatory reserve may be considered diminished on account of high ICP alone, more recent works (Mataczyński et al 2022a, Uryga et al 2022) demonstrated that pathologically altered ICP pulse waveforms may appear in the absence of substantial ICP elevation. This suggests the possibility of identifying in advance patients with reduced volume compensation. Still, further investigation of the temporal evolution of ICP pulse morphology in relation to mean ICP has to be conducted to assess if the former can be reliably used as an indicator of imminent IH episodes. A well-performing model for early prediction of ICP elevation remains one of the missing, and potentially crucial, elements of neurocritical care in acute injury. In order for ICP pulse waveform analysis to become a valuable clinical tool, its utility for improving patients' management needs to be conclusively proven in prospective trials as the investigations so far were nearly exclusively retrospective. Another important factor to consider is the inclusion of artifact removal in the analysis pipelines. During the course of continuous monitoring, often spanning several days or more, the ICP recording is subject to various disturbances related to e.g. administration of medicine, additional diagnostic tests, or nursing care. Invalid waveforms have to be carefully marked and removed from the signal prior to derivation of secondary indices in order to reduce the number of false positive alarms. Clinical adoption of any automated ICP pulse waveform analysis tool would therefore depend heavily on the artifact management solutions employed to reduce the burden on clinicians who already need to follow numerous different sources of information on the patient's condition.
Furthermore, the precise origin of the ICP pulse waveform and its relationship with changes in blood pressure and cerebral blood volume are largely unexplored. The cerebrospinal system can be—to a certain extent—regarded as a system converting blood pressure pulsations to pulsatile blood flow and further to fluctuations in ICP. While evidence exists from spectral analysis that pulse transmission from ABP to ICP is altered by increases in mean ICP (Chopp and Portnoy 1980, Takizawa et al 1987), the association between the morphology of pulsatile ABP, short-term oscillations in cerebral blood volume, and the ICP pulse waveform has not been investigated in detail; one study in NPH patients reported that ICP more closely resembles estimated central aortic pressure than radial ABP (Kim et al 2016).
Moreover, while intracranial and lumbar measurement of pressure in the cerebrospinal compartment are both widely used in clinical practice, there is considerable doubt as to how similar the two pulse waveforms are. In order to avoid the influence of gravity on a lumbar/spinal measurement, the patient has to be placed on their side in a recumbent position with the head leveled with the puncture site. This limits the applicability of lumbar measurements as a tool for routine continuous ICP monitoring. Existing studies on pulse shape in hydrocephalus were based on intracranial recordings obtained via shunt pre-chamber rather than lumbar puncture. To the best of our knowledge, there are no papers comparing ICP pulse morphology between measurement sites. Although it has been demonstrated that the mean value and pulse amplitude are well correlated (Eide and Brean 2006b), translation of findings from morphological analysis to a different source of the ICP signal requires that the similarity of the signals is verified.
Finally, it remains to be studied whether the progressive changes in peak configuration and visibility that are associated with decreasing capacity for volume compensation follow the same pattern in patients with different intracranial pathologies. The study by Nucci et al (2016) identified four classes of ICP pulse waveforms that were characterized by progressive increase in the prominence of both P2 and P3. As the deterioration of CSF circulation in NPH develops gradually over years, it is plausible that the shapes observed in acute injury do not strictly correspond to those exhibited in chronic conditions. Our preliminary investigations in TBI patients (unpublished data) indicate the existence of ICP pulse classes that are not represented in the classification from (Nucci et al 2016, Mataczyński et al 2022a). Specifically, the relative changes in the second and third peak appear less correlated, as we have observed, for instance, waveforms with P3 dominating over P2 but not P1 (perhaps suggesting normal compliance, as the P1/P2 ratio exceeds 1, but a larger degree of disturbance in the vascular system with which P3 is sometimes linked). We hypothesize that the different nature of these conditions requires careful consideration of the morphological types described as normal versus pathologically altered.
7. Conclusions
The interest in using the features of the ICP pulse waveform as a source of additional information on the condition of patients with intracranial pathologies, particularly the cerebrospinal pressure–volume compensation, began not long after the first introduction of continuous ICP monitoring to the clinical setting. In the last half a century a number of different techniques have been proposed. Some, like AmpICP or spectral centroids HFC and HHC, are not difficult to obtain but rely on numerous assumptions and their interpretation presents various challenges for the clinician. Others, such as description of peak configuration or the overall waveform shape, potentially offer more benefit in terms of ease of interpretation, but existing calculation and feature detection methods have not proven efficient enough to allow for routine use in patient management. In recent years, ICP pulse waveform analysis started receiving more attention from the scientific and medical community. This may eventually lead to a solution to the known but so far unresolved task of accurate continuous monitoring of cerebrospinal compliance in brain injured patients, which could only be adopted in clinical practice if an assessment approach that is reliable, easy to use and easy to interpret for clinicians becomes available.
Acknowledgments
This work was supported by the National Science Centre, Poland (Grant No UMO-2019/35/B/ST7/00500 and Grant No UMO-2022/45/N/ST7/01980).
Data availability statement
No new data were created or analysed in this study.