
Abstract
Objective. Most current algorithms for detecting atrial fibrillation (AF) rely on heart rate variability (HRV), and only a few studies analyse the variability of photopletysmography (PPG) waveform. This study aimed to compare morphological features of the PPG curve in patients with AF to those presenting a normal sinus rhythm (NSR) and evaluate their usefulness in AF detection. Approach. 10 min PPG signals were obtained from patients with persistent/paroxysmal AF and NSR. Nine morphological parameters (1/ΔT), Pulse Width [PW], augmentation index [AI], b/a, e/a, [b-e]/a, crest time [CT], inflection point area [IPA], Area and five HRV parameters (heart rate [HR], Shannon entropy [ShE], root mean square of the successive differences [RMSSD], number of pairs of consecutive systolic peaks [R–R] that differ by more than 50 ms [NN50], standard deviation of the R–R intervals [SDNN]) were calculated. Main results. Eighty subjects, including 33 with AF and 47 with NSR were recruited. In univariate analysis five morphological features (1/ΔT, p < 0.001; b/a, p < 0.001; [b-e]/a, p < 0.001; CT, p = 0.011 and Area, p < 0.001) and all HRV parameters (p = 0.01 for HR and p < 0.001 for others) were significantly different between the study groups. In the stepwise multivariate model (Area under the curve [AUC] = 0.988 [0.974–1.000]), three morphological parameters (PW, p < 0.001; e/a, p = 0.011; (b-e)/a, p < 0.001) and three of HRV parameters (ShE, p = 0.01; NN50, p < 0.001, HR, p = 0.01) were significant. Significance. There are significant differences between AF and NSR, PPG waveform, which are useful in AF detection algorithm. Moreover adding those features to HRV-based algorithms may improve their specificity and sensitivity.
Export citation and abstract BibTeX RIS

Original content from this work may be used under the terms of the Creative Commons Attribution 4.0 licence. Any further distribution of this work must maintain attribution to the author(s) and the title of the work, journal citation and DOI.
Introduction
Atrial fibrillation's (AF) global estimated prevalence is 2%–4% affecting every third citizen of developed countries during a lifetime (Hindricks et al 2021). Moreover, many AF episodes are asymptomatic, and the lion's share of patients are not diagnosed. Hence, they are at risk of lethal complications such as stroke, left ventricle dysfunction, cognitive decline, depression and significant life quality impairment (Boriani et al 2015, Bakhai et al 2016, Hindricks et al 2021). Regarding this global burden, the European society of cardiology (ESC) stresses AF screening in populations over 65 years old and points out mobile technologies that can help in this process (Hindricks et al 2021). Most of these technologies are based on electrocardiographic (ECG) or photoplethysmography (PPG) signals. However, in the differentiation of the blood flow changes, there are other measurement technologies, such as impedance cardiography (ICG), which proved the effectiveness of differentiating hemodynamic parameters between AF and sinus rhythm (Vessela et al 2012, Sitarek et al 2017, Nakatani et al 2018). It is worth mentioning that the ICG technology, despite being an accurate non-invasive measurement method, requires specialized equipment with the use of glued electrodes and is also less popular than the PPG measurement technology used widely in wearables and smartwatches. Although the gold standard in AF screening remains ECG (with at least 1-lead, 30 s ECG recording), PPG seems to be a more accessible and inexpensive technology. PPG demonstrates graphically blood flow in superficial capillary vessels, and it is measured by the devices called pulse oximeters (in the fingertip, handheld, tabletop, and other versions). The measurement is often taken with infrared and red light emitted by the LEDs and penetrating soft tissues. The radiation is backscattered, which reflects changes in blood volume in the tissues and is registered by the photodiode. Signal distortion reflected in the curve's morphology is caused by physiological functions such as heartbeat, blood circulation, and blood vessel condition. It has been shown that certain points on the PPG curve reflect cardiac cycle stages (Elgendi 2012). Several types of PPG were observed and correlated to the patient's age and cardiovascular diseases (Imanaga et al 1998, Takazawa et al 1998, Baek et al 2007, Elgendi 2012, Elgendi et al 2019). Parameters correlated with arteriosclerosis and the ageing process were considered to have high potential in assessing cardiac pathologies. However, it is not determined which of them are most useful (Castaneda et al 2018). Pathophysiologically, AF is defined as a supraventricular tachyarrhythmia with uncoordinated atrial electrical activation and ineffective atrial contraction. Irregular, fast or slow heart rhythm and loss of optimal ventricular filling lead to hemodynamic changes in diastolic arterial pressure, left ventricular end-diastolic pressure and stroke volume, which may influence PPG wave morphology (Rodman et al 1966, Alboni et al 1995, Raymond et al 1998). Most of the algorithms for detecting AF are based on the analysis of the changes in time between consecutive heartbeats by calculating the heart rate variability (HRV) parameters in time and frequency as well as the nonlinear ones, using a variety of classification methods (from simple threshold methods to much complex machine learning approaches) (Lee et al 2013, Conroy et al 2017, Tang et al 2017, Pereira et al 2020). Some of the algorithms were used in large-scale screening programs, including Apple Heart Study (about 420 000 individuals) (Perez et al 2019) and the Huawei Heart Health Research study (about 188 000 individuals) (Guo et al 2019). Only a few studies explored the usefulness of morphological features in their work (Fan et al 2019, Väliaho et al 2021, Liao et al 2022). The analysis of the differences in the morphological parameters, previously described in the literature, may improve the detection of this arrhythmia, as well as other cardiovascular arrhythmias. In this study, the main objective is to compare the features of PPG obtained from the signals with the registration of AF and normal sinus rhythm (NSR) and determine the clinically useful parameters for classification algorithms. Most current algorithms used for the detection of AF from PPG signal rely on HRV. In this study, we pointed out other useful morphological features for AF detection, and we showed that extending the HRV-based AF detection model of PPG morphology variability significantly improves its sensitivity and specificity. Results of this study suggest that PPG waveform morphology may be a valuable source of quantitive information about hemodynamic changes in AF and may be a valuable contribution to AF detection algorithms. Additionally our results showed complex relationship between hemodynamic changes in AF and heart failure patients, therefore this work may be valuable for future study designs addressing this research area.
Methods
This was an investigator initiated, observational, non-invasive, non-randomized controlled study. The study conforms to the ethical guidelines of the 1975 Declaration of Helsinki and was acknowledged by the Institutional Board Review Committee on Human Research of our Institution (registration number: akki/111/2021). All patients were instructed on the objectives and course of the study and gave informed consent for their participation.
Equipment
PPG signals were collected using a portable, medical-grade (class IIa), spirometer, equipped with a reflectance pulse oximeter sensor. This device allows full spirometry measurements as well as the heart rate (HR) and saturation level (SpO2). The pulse oximetry sensor is placed on top of the device. The device system is indicated for both home and in-hospital use, and all data are digitalised and readily available for analysis by the attending physician.
Participants
Measurements of PPG wave and medical history were taken from patients admitted to the cardiology ward of a tertiary cardiovascular care centre (Medical University of Warsaw) between september 2021 and march 2022. Patient assessment was based on previous medical history, ECGs taken during hospitalization, cardiac activity monitors, by experienced physicians and confirmed by simultaneous pulse measurement during the PPG reading. The experimental group consisted of patients formerly diagnosed with persistent AF or paroxysmal AF during the reading. The control group consisted of patients with NSR. We collected demographic data, information on AF and the results of other additional tests usually performed during the patient's hospitalization. All patients were instructed on the objectives and course of the study and gave informed consent for their participation.
Measurement protocol
Each measurement was taken by trained personnel after at least 15 min of rest at room temperature. The patient was asked to sit comfortably and put the left thumb or index finger (depending on the visually assessed signal quality) on the sensor. The measurement lasted ten minutes. Throughout this time, the patient had to remain still and quiet. Trained personnel remained with the patients throughout the course of the examination.
Data preparation
PPG signals obtained from the study and control groups were split into 120 s length frames (with no overlap) and checked for quality. Each frame was preprocessed by a bandpass type II Chebyshev filter. The bandwidth ranges depended on the extracted morphological feature of PPG and were based on the TERMA algorithm (Elgendi 2018). Subsequently, signals were oversampled from the standard frequency of 100 to 500 Hz to increase the resolution of obtained feature values. Each signal was prepared in three forms: basic PPG, first PPG derivative—Velocity Plethysmograph (VPG) and second PPG derivative—Acceleration Photoplethysmogram (APG).
Features extraction
The following characteristic points were extracted from PPG, VPG and APG signals using the method described in the TERMA algorithm (Elgendi 2018):
- Systolic peak and its onset point.
- A diastolic peak is detected as a point where VPG signal changes signs from positive to negative. If there is no such point, the diastolic peak is a local minimum of the APG signal.
- Dicrotic notch, which is a local maximum of APG signal. It is equivalent to the point e (figure 1) on the APG signal.
- The inflection point is a local maximum of VPG signal between the dicrotic notch and diastolic peak. If there is no such point, it is a midpoint between the dicrotic notch and diastolic peak.
- Point a and b (figure 1), which are the maximum and following minimum of APG signal.
These points were shown in figure 1. The characteristic points were used for calculating morphological features of the PPG signal. The differences between consecutive systolic peaks (called RR intervals) were also used for calculating HRV parameters. The list of the features was presented in table 1.
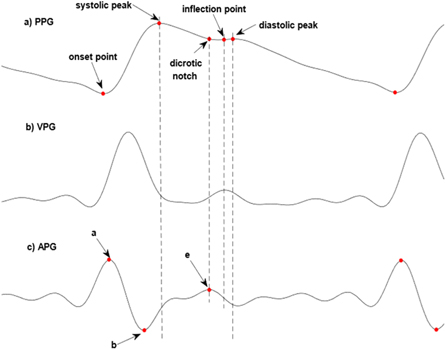
Figure 1. Typical PPG signal (a), its first derivative—VPG (b) and second derivative—APG (c) signals with characteristic points.
Download figure:
Standard image High-resolution imageTable 1. List of the morphological features of PPG signal and the HRV features.
| Feature | Definition |
|---|---|
| morphological features: | |
| 1/ΔT | ΔT is a time between the systolic peak and the diastolic peak |
| PW | distance between slopes at the half height of the systolic peak |
| AI | ratio of amplitudes in diastolic and systolic peak |
| b/a ratio | a and b points are taken from APG signal |
| e/a ratio | a and e points are taken from APG signal |
| (b-e)/a | a, b and e points are taken from APG signal |
| CT | a time between the onset point and the systolic peak |
| IPA | ratio between A2 and A1 areas. A2 is the area under the PPG curve between the inflection point and the onset point of the next systolic wave. A1 is the area between the onset point and the inflection point |
| Area | total area under the PPG signal. Sum of A1 and A2 areas (see the definitions of A1 and A2 areas in the description of IPA parameter) |
| HRV features: | |
| HR | mean heart rate (in beats per minutes) |
| ShE | entropy analyzed the 'amount of information' of the RR interval time series (Kurths et al 1995) |
| RMSSD | the square root of the mean squared difference of successive RR intervals between adjacent intervals |
| NN50 | the number of pairs of successive RR intervals that differ by more than 50 ms |
| SDNN | the standard deviation of RR intervals |
Abbreviations: AI—Augmentation Index, CT—Crest Time, HRV—Heart Rate Variability, IPA—Inflection Point Area, NN50—the number of pairs of successive RR intervals that differ by more than 50 ms, PW—Pulse Width, RMSSD—root mean square of the successive differences, SDNN—standard deviation of R–R intervals, ShE—Shannon Entropy.
Statistical analysis
The results of the descriptive analysis were presented as X(Y), where X is a mean value, and Y is a standard deviation or as a number and percentage proportion. Comparison between the study and control groups for baseline parameters was performed using t Student tests or the Mann–Whitney test (when the hypothesis about the normal distribution of the variables in the groups, evaluated using the Shapiro–Wilk test, was rejected). The level of significance for the p-value was set to 0.05. The analysis for morphological and HRV features was performed using univariate logistic regression. The features with a p-value less than 0.25 were considered in the multivariate, stepwise logistic regression analysis. Three multivariate models have been compared: the model considered either morphological and HRV parameters, the model contained only HRV parameters, and the model included only morphological parameters. The models estimate a logit function z as a linear function of the independent variables which is used for calculating probability of dependent variable state (AF or SNR) using logistic function f(z). If the probability is larger than 0.5, the model indicates to AF (otherwise to SNR). The output of the models is compared with a reference, binary variable. Akaike information criterion (AIC) (Cavanaugh and Neath 2019) and area under the curve (AUC) with 95% confidence intervals were calculated for all models. The first measure was used for comparison between analyzed models as well as in finding final models in stepwise methedology. The absolute value of AIC does not provide significant information; however, comparison of these values between models allows to evaluate which one is characterized by the lowest uncertainity level (the lower AIC value, the less uncertainity). On the contrary, the higher the AUC value, the better the dependent variable is explained. The likelihood ratio test (LR test) were used to verify the hypothesis if the model considering morphological parameters better fit the data than the model with only HRV features. The correlation between all selected variables was analysed using Pearson correlation coefficients.
Results
In the study, 80 patients, including 33 with AF (59.5% males; mean age: 76.8(9.4)) and 47 with NSR (59.6% males; mean age 57(20) years) were recruited. The baseline characteristics of the groups are presented in table 2. The significant differences between study and control groups were observed for age (p < 0.001), CHF (p < 0.001) and BB (p = 0.004).
Table 2. Study and control group characteristics.
| AF (n=33) | NSR (n=47) | p-value | |
|---|---|---|---|
| Age (years) | 76.8 (9.4) | 57 (20) | <0.001 |
| Sex (male) | 14 (59.5%) | 19 (59.6%) | 0.717 |
| CAD | 22 (66.6%) | 28 (59.6%) | 0.519 |
| Vascular disease | 23 (69.7%) | 30 (63.8%) | 0.585 |
| HTN | 21 (63.6%) | 29 (61.7%) | 0.860 |
| DM2 | 13 (39.4%) | 10 (21.3%) | 0.082 |
| CHF | 28 (84.8%) | 12 (25.5%) | <0.001 |
| Smoker | 5 (16.7%)* | 12 (26.1%)* | 0.339 |
| Regular medications | |||
| CCB | 4 (12,1%) | 16 (29,8%) | 0.032 |
| ARB | 6 (18.2%) | 8 (17.0%) | 0.893 |
| ACEI | 16 (48.5%) | 18 (38.3%) | 0.365 |
| BB | 29 (87.9%) | 26 (55.3%) | 0.004 |
Data presented as X(Y), where X is a mean value, and Y is a standard deviation or as a number and percentage proportion. CAD—coronary artery disease, HTN—hypertension, DM2—diabetes mellitus type 2, CHF—congestive heart failure, CCB—Calcium channel blockers, ARB—Angiotensin receptor blockers, ACEI—Angiotensin-converting enzyme inhibitors, BB—Beta-blockers *no data for 4 patients.
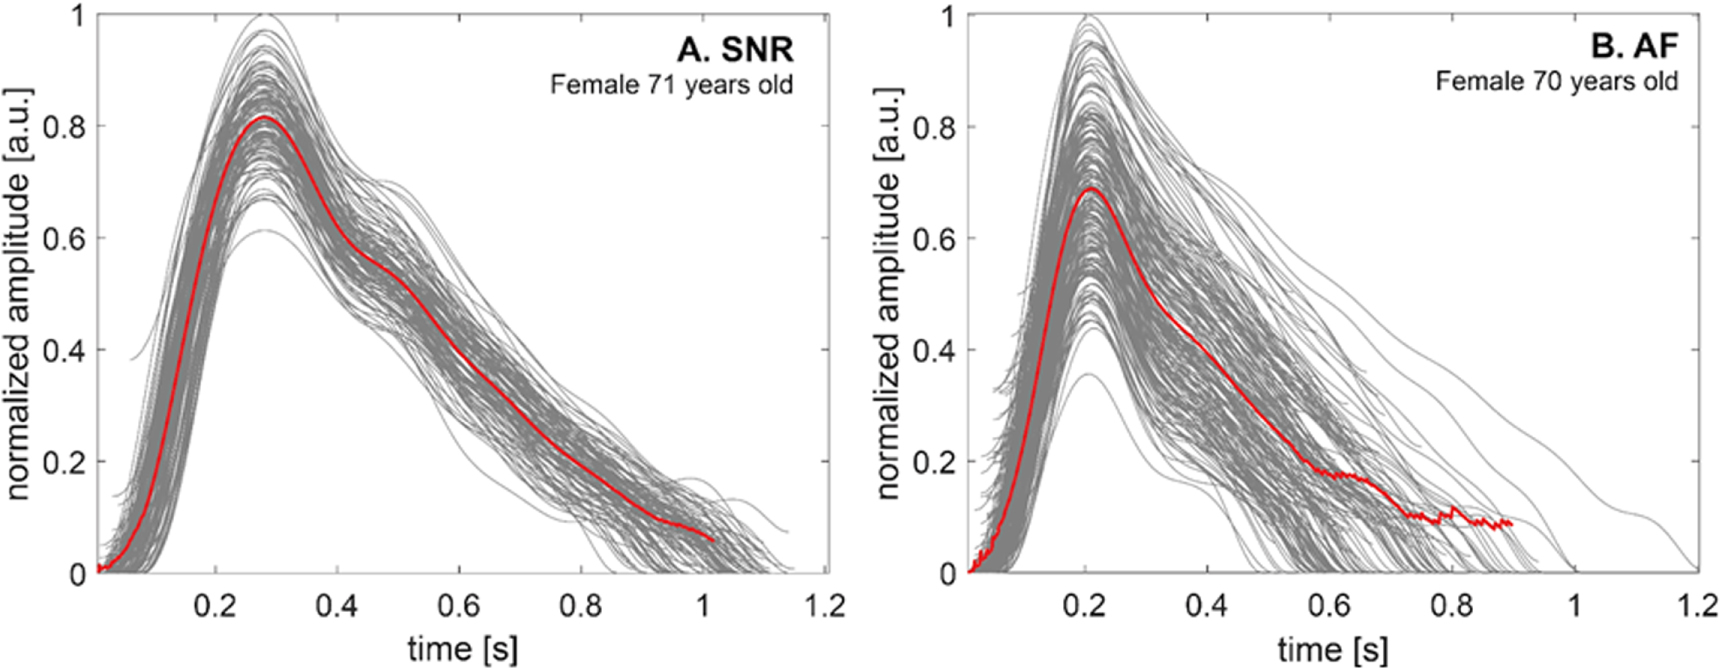
The total number for the 120 s frames extracted from the measured signals was 99 for AF and 152 for NSR; the median value of the number of the frames equalled 4 (min: 1, max: 8) per participant. The median value of the number of detected beats per one frame was 157 (min: 107, max: 271); per patient: 532.5 (min: 116, max: 1110) beats. Figure 2 presents two excerpts of the PPG signal, extracted from the frames related to AF (a) and SNR (b), where the fiducial points were marked. Figure 3 shows examples of the single and averaged PPG waveforms at SNR and AF obtained from two females of a similar age.

Figure 2. Two excerpts of PPG signals, extracted from the frames related to the patient with AF (a) and NSR (b) with marked fiducial points. Red: systolic peak, purple: dicrotic notch, black: inflection point, green: diastolic peak, blue: onset point.
Download figure:
Standard image High-resolution image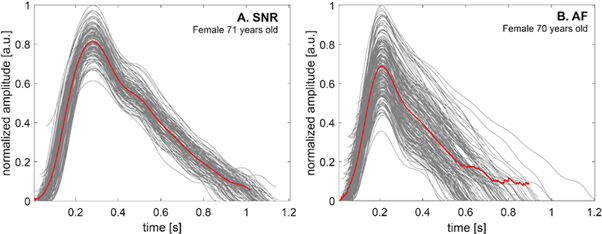
Figure 3. The examples of the single (grey lines) and averaged (red lines) photoplethysmography (PPG) waveforms at normal sinus rhythm (SNR) (A) and atrial fibrillation (AF) (B) were obtained from two females of a similar age.
Download figure:
Standard image High-resolution imageWe observed higher variability in the PPG waveforms' morphology during AF. The results of univariate analysis for morphological and HRV features of the PPG signal are shown in table 3.
Table 3. Mean values (with standard deviation) of the morphological and heart rate variability parameters, calculated for the frames in AF and NSR groups with p-value were obtained from the univariate analysis.
| AF | NSR | p-value | |
|---|---|---|---|
| morphological parameters: | |||
| 1/ΔT [1/s] | 5.56 (0.54) | 5.11 (0.60) | <0.001 |
| PW [ms] | 379 (86) | 395 (95) | 0.164 |
| AI | 0.62 (0.12) | 0.64 (0.12) | 0.478 |
| b/a | −0.45 (0.23) | −0.57 (0.20) | <0.001 |
| e/a | 0.153 (0.082) | 0.17 (0.13) | 0.079 |
| (b-e)/a | −0.60 (0.28) | −0.75 (0,21) | <0.001 |
| CT [ms] | 218 (35) | 206 (37) | 0.011 |
| IPA | 0.64 (0.22) | 0.65 (0,20) | 0.765 |
| Area | 8.1 (5,7) | 11.7 (6,8) | <0.001 |
| HRV parameters: | |||
| HR [bpm] | 82.3 (14.3) | 77.6 (13.4) | 0.010 |
| ShE | 0.69 (0.11) | 0.43 (0.13) | <0.001 |
| RMSSD [ms] | 227 (65) | 98 (62) | <0.001 |
| NN50 | 118 (29) | 45 (27) | <0.001 |
| SDNN [ms] | 164 (42) | 92 (45) | <0.001 |
Abbreviations: see table 1.
Five morphological features (1/ΔT, p < 0.001; b/a, p < 0.001; [b-e]/a, p < 0.001; crest time [CT], p = 0.011 and area, p < 0.001) and all five HRV (heart rate [HR], p = 0.01, Shannon entropy [ShE], p < 0.001, root mean square of the successive differences [RMSSD], p < 0.001, standard deviation of R–R intervals [SDNN], p < 0.001, the number of pairs of successive RR intervals that differ by more than 50 ms [NN50], p < 0.001) parameters significantly differentiated the study and control group. We found that the mean values of 1/ΔT, b/a and (b-e)/a were significantly higher in patients with AF, while in the case of pulse width (PW), Area and e/a parameters, the mean values were significantly lower for this group in comparison to the NSR group. Correlation coefficient values between the features and age were presented in figure 4.
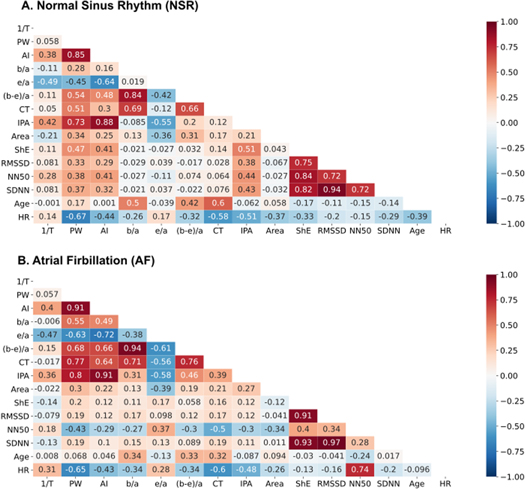
Figure 4. Correlation plot between morphological and heart rate variability and the age for the signals contained normal sinus rhythm (NSR; A) and atrial fibrillation (AF; B). Abbreviations: see table 1
Download figure:
Standard image High-resolution image
Spearman correlation coefficients between PPG features and age were calculated separately for the NSR and AF groups. We found a low to moderate correlation between analysed features and age; the largest coefficient values for patients with NSR were between age versus CT (r = 0.60), age versus b/a (r = 0.50) and age versus (b-e)/a (r = 0.42). Correlation coefficients associated with b/a and (b-e)/a versus age are similar probably due to large mutual correlation (r = 0.84). Due to the large correlation coefficient value between SDNN and RMSSD parameters (r = 0.94), the second parameter was excluded from multivariate analysis. For patients with AF the same coefficients are largest, but the correlations are weaker than for NSR data, e.g. age versus CT (r = 0.32), age versus b/a (r = 0.34) and age versus (b-e)/a (r = 0.33). Results of multivariate stepwise logistic regression (regression coefficients and odds ratio) are shown in table 4.
Table 4. Results of the multivariate logistic regression analysis using backward propagation algorithm for classification between SNR and AF.
| Model 1: morphological + HRV parameters | |||
|---|---|---|---|
| AIC: 80 AUC: 0.988 (0.972–1.000) | b (95% CI) | OR (95% CI) | p-value |
| Intercept | −1.55 (−2.45–−0.81) | 0.213 (0.086–0.447) | <0.001 |
| PW | −4.19 (−6.50–−2.52) | 0.015 (0.002–0.081) | <0.001 |
| e/a | −1.81 (−3.46–−0.60) | 0.163 (0.031–0.551) | 0.011 |
| (b-e)/a | 2.60 (1.35–4.16) | 13.4 (3.8–64.3) | <0.001 |
| CT | 0.84 (−0.11–1.89) | 2.32 (0.90–6.60) | 0.093 |
| ShE | 4.53 (1.31–8.29) | 92.8 (3.7–3982.5) | 0.010 |
| SDNN | −2.152 (−4.513–−0.025) | 0.116 (0.011–0.975) | 0.055 |
| NN50 | 3.32 (1.59–5.39) | 27.6 (4.9–218.9) | <0.001 |
| HR | −1.81 (−3.28–−0.52) | 0.163 (0.038–0.595) | 0.010 |
| Model 2: Only HRV parameters | |||
| AIC: 139 AUC: 0.958 (0.935–0.980) | b (95% CI) | OR (95% CI) | p-value |
| Intercept | −1.03 (−1.57–−0.55) | 0.36 (0.21–0.58) | <0.001 |
| ShE | 2.20 (0.19–4.32) | 9.06 (1.21–75.4) | 0.036 |
| NN50 | 2.28 (1.40–3.32) | 9.79 (4.04–27.75) | <0.001 |
| SDNN | −1.33 (−2.91–0.15) | 0.263 (0.055–1.159) | 0.085 |
| Model 3: Only morphological parameters | |||
| AIC: 265 AUC: 0.829 (0.779–0.878) | b (95% CI) | OR (95% CI) | p-value |
| Intercept | −0.63 (−0.96–−0.31) | 0.53 (0.38–0.73) | <0.001 |
| 1/ΔT | 0.63 (0.26–1.02) | 1.88 (1.29–2.77) | 0.0012 |
| PW | −1.23 (−1.87–−0.64) | 0.29 (0.15–0.53) | <0.001 |
| b/a | 3.61 (0.10–7.21) | 37.0 (1.1–1348.4) | 0.047 |
| e/a | −2.04 (−3.76–−0.41) | 0.130 (0.023–0.664) | 0.017 |
| (b-e)/a | −2.96 (−6.79–0.83) | 0.052 (0.001–2.283) | 0.13 |
| CT | 0.62 (0.10–1.18) | 1.87 (1.10–3.26) | 0.024 |
| Area | −0.61 (−1.04––0.21) | 0.54 (0.35–0.81) | 0.0037 |
Abbreviations: see table 1, AIC—Akaike Information Criteria, AUC—area under the curve.
Three models were calculated: (1) full model with morphological and HRV parameters, (2) model with only HRV parameters and (3) model with only morphological parameters. In the model 1, the following features were included: PW (p < 0.001), e/a (p = 0.011), (b-e)/a (p < 0.001), CT (p = 0.093), ShE (p = 0.010), SDNN (p = 0.055), NN50 (p < 0.001) and HR (p = 0.010). The model 2 with only HRV parameters contains three variables that were significant (HR was rejected during stepwise reduction): ShE (p = 0.036), SDNN (p = 0.085) and NN50 (p < 0.001). Model (3) contains the following morphological features: 1/ΔT (p = 0.0012), PW (p < 0.001), b/a (p = 0.047), e/a (p = 0.017), (b–e)/a (p = 0.13), CT (p = 0.024), Area (p = 0.0037). The AIC values for compared models 1–3 were: 80, 139 and 265, respectively, indicating that model 1 has the lowest level of uncertainty. The results of LR test suggest that the model including both morphological and HRV parameters is a better fit to the data than the model with only HRV parameters (p < 0.001). Model 1 also has a larger AUC value than model 2 (0.988 (95% CI: 0.974–0.999) versus 0.958 (95% CI: 0.935–0.980)). The performance parameters for model 3 (including only morphological variables) were significantly lower than the mixed model (p < 0.001). Additionally, we created a model based on the morphological parameters but with a dependent variable associated with CHF. The model included three parameters (after stepwise reduction of variables): PW (p = 0.0093), (b-e)/a (p = 0.052) and CT (p = 0.15); the AUC value for this model equalled 0.73 (95% CI: 0.68–0.80).
Discussion
In this study, we focused on PPG wave morphology and its derivatives characteristics using features previously described in the literature. We showed that many parameters were significantly different between patients presenting AF to those with NSR. In our study, we constructed three multivariate logistic regression models. We showed that the HRV model with additional morphological features better fits the data than the HRV model itself, which shows the importance of curve morphology analysis and its potential for improving the performance of AF detection. The third model based only on morphological parameters was inferior to the previous ones. The results from an additional model, considering CHF as a dependent value, suggest that this factor may also contribute to the modulation of the PPG waveform, however, its influence seems to be smaller in comparison to AF (p-value under the level of significance was observed only for PW parameter). Most features used in the analysis have been previously described and discussed in terms of general changes in the cardiovascular system and, due to our knowledge, have never been considered as additional features regarding AF hemodynamic consequences. Many current studies rely on a qualitative approach to AF using PPG-based HRV parameters analysis, based on simple threshold methods and machine learning techniques (Pereira et al 2020). Only few studies explored usefulness of morphological features in their work. Fan et al validated a particular algorithm using morphology and HRV features on different devices with an accuracy of over 94% for smartphone camera and wristband (Fan et al 2019). Liao et al achieved higher results (AUC = 0,97) by extracting temporal, spectral and basic morphological features variability (mainly peak height) on 25 pulse-to-pulse intervals, however, the study focused on the impact of recording length and other arrhythmias on AF detection accuracy and not included control group (Liao et al 2022). Väliaho et al combined morphological and HRV features and achieved similar results (AUC = 0,99) (Väliaho et al 2021). Nevertheless, similarly to Liao et al morphological features included mainly variability of amplitude when our manuscript explored several different morphological features described previously in the literature. Moreover, in those two studies, only 13% and 27% of those patients had heart failure, respectively, compared to 84% in our study population, which, as we showed in real-life settings, may significantly influence signal morphology. There are also models based on deep learning techniques, taking to an input sample of signal (without extracting features) (Poh et al 2018, Aschbacher et al 2020); they provide considerable accuracy, however, do not provide explanations of what part of PPG signal morphology was deformed due to AF (which was the main aim of our study). Our study also showed similar HRV analysis results to those found in the literature (Lee et al 2013, Conroy et al 2017, Tang et al 2017), with all analysed HRV features significantly different between groups. Our model based on HRV parameters achieved AUC = 0.958 (0.935–0.980) compared to AUC = 0.949 shown by Tang et al (Tang et al 2017). Both models were based on stepwise logistic regression and 2 min signal frames as an input. Extending the HRV model by the morphological features significantly increased the AUC value to 0.988 (0.974–1.000) (p < 0.001). It is difficult to find an objective hemodynamic context, so it is hard to understand the relationship of the PPG signal morphology with the cardiac cycle. It was shown in the literature that b/a and (b-e)/a reflect increased arterial stiffness and increase with age, which was confirmed in our study (Imanaga et al 1998, Takazawa et al 1998, Baek et al 2007). Takazawa et al and independently Baek et al showed that the e/a parameter decreases with age, which also finds confirmation in our results. (Takazawa et al 1998, Baek et al 2007). Additionally, we observed that the direction of correlation between coefficients and age was the same in both groups. However, correlations in the AF group were weaker, which may be related to more irregular morphology of PPG waveform and more inadequate extraction of characteristic points, as shown in figure 3. Further studies should include an investigation of the correlation between echocardiography as a gold standard and PPG wave morphology for a better understanding of complex physiology and pathophysiology of PPG waveform, potentially including new digital biomarkers. Further analysis can also include the usage of morphological parameters' variance as additional features.
This study has potential limitations. Despite the fact that division into rhythm groups was made based on an experienced physician and confirmed by pulse palpation during the reading, the research team might not recognized overlapping and changing heart rhythms during measurement and differentiation between AF and multiple supraventricular or ventricular extrasystoles. Secondly, the impact of certain drugs on PPG wave morphology features has been shown in the literature (Takazawa et al 1998). However, a such detailed analysis was not included in this study. Still, there were no significant differences between groups in terms of calcium channel blockers (CCB), angiotensin-converting-enzyme inhibitors (ACEI), angiotensin receptor blockers (ARB) and beta-blockers (BB). Another limitation of this study was the significant difference in the age and CHF prevalence between groups. AF prevalence in HF ranges between 13%–27%, and with disease progression, AF prevalence may reach up to 50% in severe HF (Anter et al 2009). Moreover, with disease severity, there is a growing possibility of a past implantable device intervention in those patient groups, which hinders the recruitment process and data analysis. Although the relationship between AF and HF is not fully determined, it is known that both groups have similar cardiovascular risk factors, including age as one of the most important. Regarding this, significant differences in age and CHF resulted from patients' population distribution in a cardiovascular ward and should be considered in future study designs. Aware of those differences, we decided to show the results as valuable because we included all available patients in this analysis, making it more of a real-world data registry. It is also worth highlighting that the main aim of this study was not to create a classification model itself but rather an explanatory analysis of PPG signal morphology using the outputs parameters from logistic regression models. Therefore, we did not split the dataset into training and test subsets which is common for classification problem-solving. Additionally, it may be hard to directly apply results of this study for signal collected in less controlled settings. In terms of the use of our method in ambulatory conditions, it is worth mentioning that many factors affect the ppg measurement, such as the type of device, its adherence to the skin, and motion artefacts. PPG measurements would depend on the accuracy of the PPG signal obtained in such conditions. In order to detect AF accurately, the PPG signal must be of sufficient quality to measure the morphological features of the PPG curve accurately. If the signal quality is not sufficient, the accuracy of the AF detection algorithm may be compromised. feasibility of using this approach in less controlled settings needs to be exlpored in the future.
Conclusions
PPG may be a valuable source of additional, quantitative information about cardiovascular diseases. Our study showed that the morphology of PPG waveforms, considering selected features, significantly differs between the patients with AF and SNR at different levels of complexity: from univariate to multivariate analysis, even in a model considering HRV parameters. However, more research is needed to understand better the complex physiology and pathophysiology of the PPG curve and its relationship to hemodynamic consequences of AF and impact of HF.
Data availability statement
The data cannot be made publicly available upon publication because they contain sensitive personal information. The data that support the findings of this study are available upon reasonable request from the authors.
Conflict of interest
Mikolaj Basza, Wojciech Bojanowicz, Damian Waląg, and Mateusz Soliński were the employees of Healthup (AioCare spirometer), Łukasz Kołtowski is CEO of Healthup and inventor of AioCare spirometer.