
Abstract
Objective. Craniospinal compliance (CC) is an important metric for the characterization of space-occupying neurological pathologies. CC is obtained using invasive procedures that carry risks for the patients. Therefore, noninvasive methods for acquiring surrogates of CC have been proposed, most recently based on changes in the head's dielectric properties during the cardiac cycle. Here, we have tested whether changes in body position, which are known to influence CC, are reflected in a capacitively acquired signal (hereinafter referred to as W) originating from dynamic changes of the head's dielectric properties. Approach. eighteen young healthy volunteers were included in the study. After 10 min in supine position, subjects were tilted head-up (HUT), back to 0° (horizontal, control), and then head-down (HDT). Metrics related to cardiovascular action were extracted from W, including AMP, the peak-to-valley amplitude of the cardiac modulation of W. Computational electromagnetic simulations were performed to probe the association between intracranial volume change and W. Main results. AMP decreased during HUT (0°: 2869 ± 597 arbitrary units (au); +75°: 2307 ± 490 au, P = 0.002) and increased during HDT (−30°: 4403 ± 1428 au, P < 0.0001). The same behavior was predicted by the electromagnetic model. Significance. tilting affects the distribution of CC between cranial and spinal compartments. Cardiovascular action induces compliance-dependent oscillatory changes in the intracranial fluid composition, which causes corresponding variations in the head's dielectric properties. These manifest as increasing AMP with decreasing intracranial compliance, which suggests that W may contain information related to CC, and that it might be possible to derive CC surrogates therefrom.
Export citation and abstract BibTeX RIS

Original content from this work may be used under the terms of the Creative Commons Attribution 4.0 licence. Any further distribution of this work must maintain attribution to the author(s) and the title of the work, journal citation and DOI.
Introduction
Patients suffering from space-occupying neurological pathologies such as hydrocephalus or cerebral edema following traumatic brain injury or stroke benefit from intracranial pressure (ICP) monitoring and craniospinal compliance (CC) assessment for diagnostic and clinical management purposes (Relkin et al 2005, Spiegelberg and Moskopp 2015, Carney et al 2017). The term ICP refers to the pressure within the craniospinal compartment (Gomes and Bhardwaj 2009), i.e. the space delimited by the skull and the meninges containing the central nervous system, blood and cerebrospinal fluid (CSF). Given the rigidity of the skull and the limited distensibility of the meninges, ICP is tightly linked to changes in the volumes of the craniospinal components. ICP monitoring requires the opening of the skull through a burr hole, the penetration of the dura mater and either the introduction of a fluid-filled catheter into a lateral ventricle, or the placement of a dedicated ICP sensor in the epidural space, the subdural space, or the brain parenchyma (Evensen and Eide 2020). Alternatively, spinal CSF pressure, which is considered a good surrogate of ICP in patients with communicating CSF compartments (Lenfeldt et al 2007, Behrens et al 2013), can be acquired less invasively through lumbar puncture. The exponential craniospinal pressure–volume curve relates ICP to CC (Marmarou et al 1975), with CC being the inverse of the slope of the curve. CC represents the body's ability to accommodate increase in craniospinal contents without substantial rise in ICP. It is a function of intracranial compliance and spinal compliance, with its distribution between cranial and spinal compartments depending on body position (Magnæs 1989), among other factors. The assessment of CC requires craniospinal volume manipulations, performed either through drainage of CSF during a tap test or via infusion of fluid into the CSF space. In contrast to ICP, continuous monitoring of CC is currently not possible (Evensen and Eide 2020).
The degree of invasiveness and the higher risk of infection associated with volume manipulation methods compared to ICP monitoring alone led to the search for alternative approaches to derive CC surrogates based on ICP waveform analysis. Several features of the ICP signal were proposed as descriptors of the craniospinal pressure–volume curve: the amplitude of ICP pulsation induced by cardiovascular action was shown to increase linearly with rising mean ICP (Avezaat and Eijndhoven 1986), and suggested as an indicator of deteriorating compliance at values >4 mmHg under resting conditions (Eide and Brean 2010). Two metrics describing the linear relationship between the cardiac modulation of ICP and mean ICP have been introduced, the RAP index (Price et al 1993, Czosnyka et al 2007, Kim et al 2009) and the relative pulse pressure coefficient (Lenfeldt et al 2004). Both are considered markers of the craniospinal compensatory reserve and, therefore, indirectly of CC. At mean ICP values <10 mmHg, the craniospinal compartment offers high compensatory reserve (CC ≥0.8 ml mmHg−1(Yau et al 2002)), with volume variations translating into small ICP changes; conversely, with rising mean ICP, compensatory reserve decreases, eventually leading to the exhaustion of the craniospinal volume-buffering capacity.
Respiration also modulates ICP, causing transient change along the craniospinal pressure–volume curve (Foltz et al 2016). Based on the assumption that respiratory changes of ICP do not alter the shape of the craniospinal pressure–volume curve, the relative amplitude quotient (RAQ), defined as the ratio between the ICP respiratory amplitude and the amplitude of the respiration-induced variation of the ICP cardiac pulsation, was introduced (Spiegelberg et al 2020). It was shown that during periods of B-waves (Spiegelberg et al 2016), RAQ differed significantly between two groups of hydrocephalus patients that were, respectively, responsive and not responsive to CSF diversion (Spiegelberg et al 2020). Therefore, RAQ was proposed as a surrogate for the craniospinal pressure–volume relationship, with higher RAQ indicating larger cerebral compensatory reserve.
The clinical value of ICP waveform analysis must be balanced against the risk of complications associated with invasive ICP monitoring. For cases where the risks outweigh benefits, where patients refuse invasive assessment, or where measurements cannot be carried out for other reasons, noninvasive approaches for deriving ICP or CC surrogates come into play. While a large number of such approaches has been proposed and tested (Reid et al 1989, Schmidt and Klingelhöfer 2002, Bodo et al 2005, Shimbles et al 2005, Zhao et al 2005, Kashif et al 2008, Tain and Alperin 2009, Behrens et al 2010, Mascarenhas et al 2012, Ragauskas et al 2012), so far only the evaluation of the optic nerve sheath diameter in the diagnostics of spontaneous intracranial hypotension (Fichtner et al 2019) and idiopathic intracranial hypertension (Shofty et al 2012, Kishk et al 2018) has found entry into routine clinical practice. However, innovation in the field continues (Levinsky et al 2016, Koskinen et al 2017, Evensen 2018a, Evensen 2018b, Tsai et al 2018, Fanelli et al 2019, Heldt et al 2019, Andrade et al 2021) and includes approaches such as rheoencephalography that rely on signals dependent on the electric properties of the head (Bodo et al 2015, Hawthorne et al 2018).
Recently, we developed a method for noninvasive acquisition of intracranial pulse waves. It relies on capacitive measurements of the head's dielectric properties with electrically isolated electrodes on the scalp and is based on the idea that the head's dielectric properties change during cardiac and respiratory cycles as a result of periodic changes in intracranial blood and CSF volumes (Russegger and Ennemoser 1990). The acquired electric signal (hereinafter referred to as W) shows characteristic modulations induced by cardiac and respiratory activity. Using hyperventilation testing on healthy volunteers, the W signal was shown to be, in part, of intracranial origin (Spiegelberg et al 2022). Since this noninvasively acquired signal includes information on intracranial volume changes, it is conceivable that surrogate metrics of CC could be derived therefrom.
The aim of this study was to assess whether metrics linked to variations in CC can be extracted from W. To this end, we performed tilt table tests on a cohort of young healthy volunteers to alter the distribution of CC between the cranial and spinal compartments. We then isolated features of the capacitively measured signal W such as amplitudes of cardiac and respiratory modulation and tested for associations between tilt angle and changes in these features. Finally, we employed finite element electromagnetics simulations to confirm that fluid shifts introduced by positional change, which alter CC distribution, produce the experimentally observed changes in W signal features.
Methods
Subjects
Eighteen young subjects (9 women) were included (age: 25 ± 2 years, weight: 68 ± 12 kg, height: 170 ± 10 cm). Brachial ABP and arterial pulse wave velocity were acquired by, respectively, oscillometry (Finapres® Nova, Finapres Medical Systems B.V., Amsterdam, The Netherlands) and measuring pulse wave transit times between the right index finger and the ipsilateral second toe (pOpmètre 300s, Axelife SAS, Saint-Nicolas-de-Redon, France). The subjects were normotensive (systolic blood pressure: 123 ± 9 mmHg, diastolic: 72 ± 6 mmHg) and had arterial pulse wave velocities of 5 ± 1 m s−1, which is indicative of physiological arterial stiffness for this age group (Díaz et al 2014, Alivon et al 2015). Exclusion criteria were: craniospinal, neurological and neuromuscular pathologies; cardiovascular and pulmonary pathologies; prior intracranial or spinal surgical interventions; implants and any non-removable foreign object on head or neck. Participants were instructed to not ingest food or caffeinated and alcoholic beverages in the three hours prior to the experimental session. This study was approved by the Ethics Committee of the Canton of Zurich (BASEC-Nr. 2018–02078), and was conducted in accordance with the principles of the Declaration of Helsinki. All subjects provided written informed consent.
Noninvasive capacitive acquisition of the head's dielectric properties
The device for measuring the head's dielectric properties (figure 1, PEM1, Cephalotec, Horgen, Switzerland) contains an inductor that is connected to the subject's head through two electrically isolated electrodes (PEM2, Cephalotec), forming a tuned resonator circuit. A carrier wave of constant frequency (∼1 MHz) and constant current amplitude produced by a direct digital synthesis frequency generator within the device excites this circuit. The variations of the head's dielectric properties due to cardiac and respiratory action modulate the oscillator voltage amplitude. By amplitude demodulation through an envelope detector, high-pass and low-pass filtering to preserve the frequency range of interest (0.1 to 4.9 Hz), amplification and A/D conversion, a signal showing characteristic cardiac and respiratory oscillations (W signal, figure 2(c)) is obtained. The device outputs W via a USB interface. For further details on the working principle of the device, we refer the reader to Spiegelberg et al (2022).

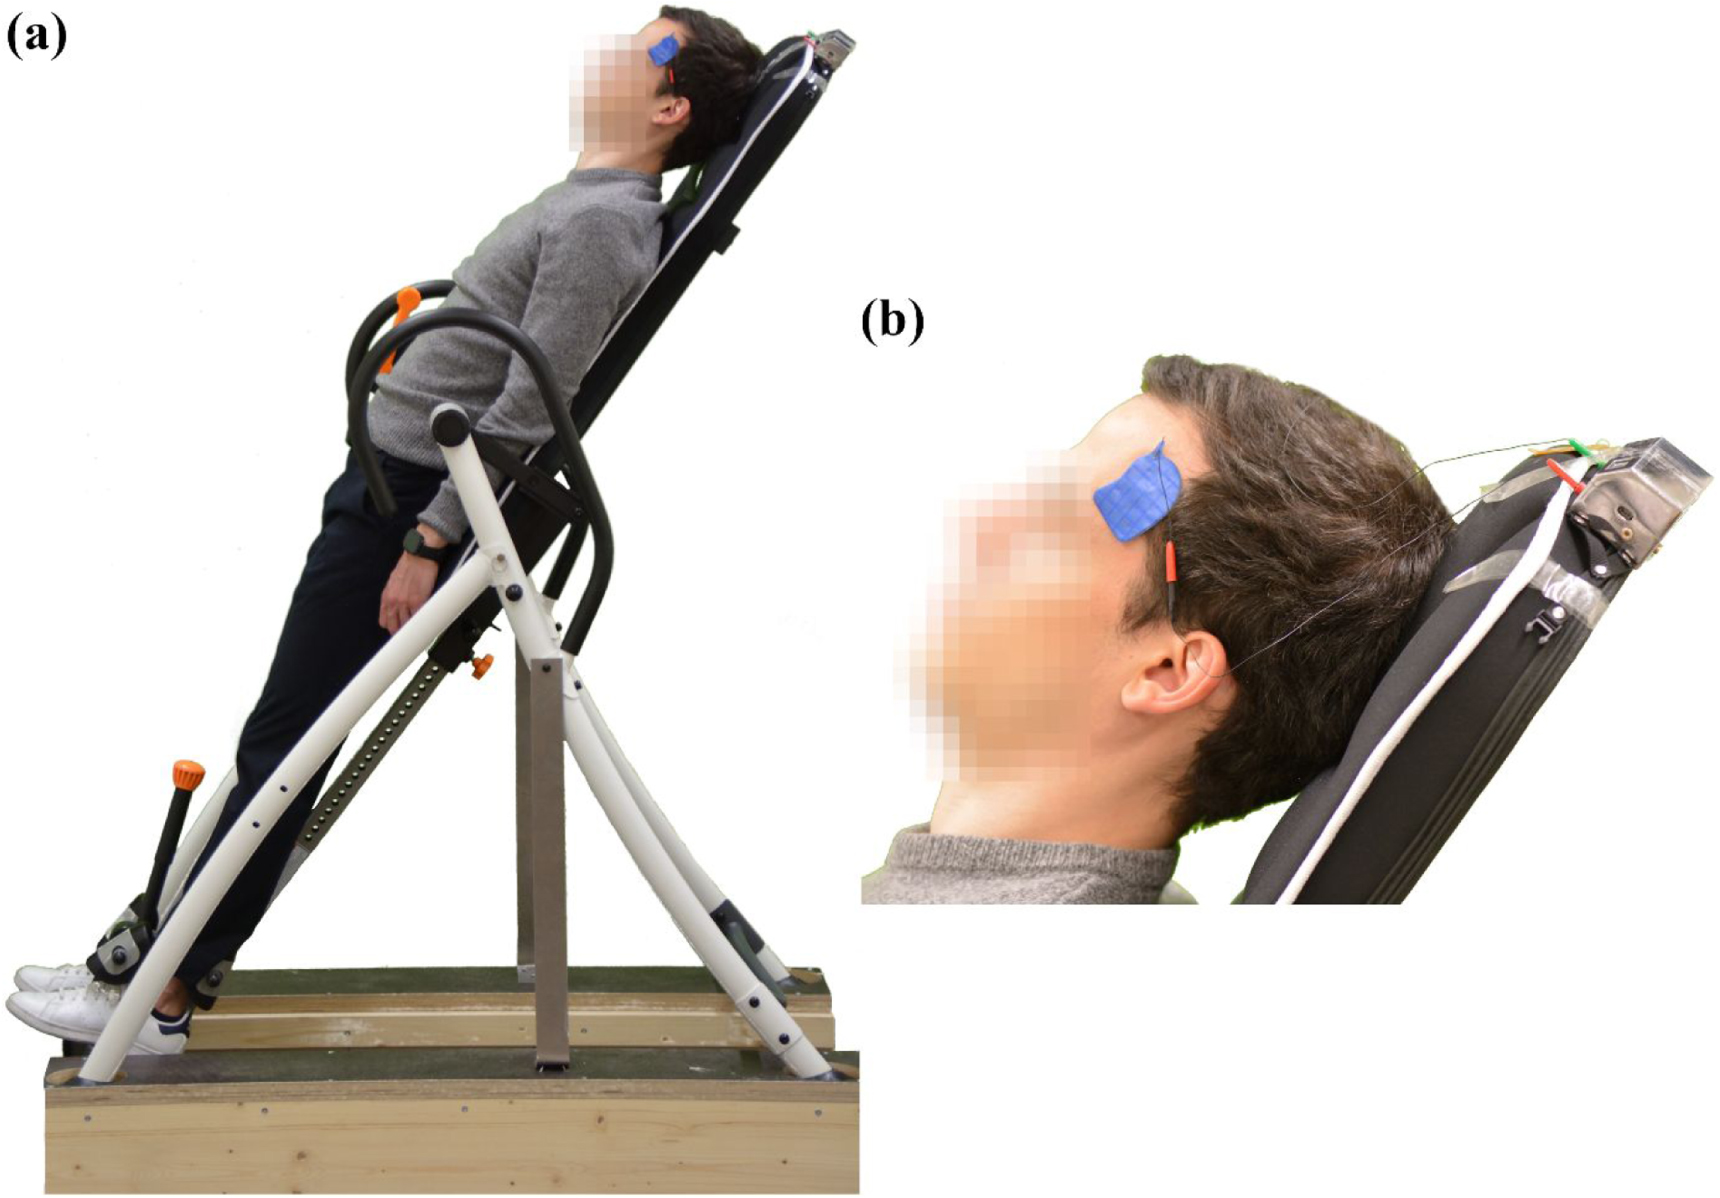
Figure 1. (a) Photo of a test subject on the tilt table employed for positional testing. (b) Magnified view of the area around the subject's head. The device (metallic box) for measuring the head's dielectric properties and one of the two electrically isolated electrodes (blue) placed on the subject's forehead are visible.
Download figure:
Standard image High-resolution image
Figure 2. Representative time windows of the acquired signals. Left and right columns feature window widths of approximately 30 s and 8 s, respectively. (a) Electrocardiogram (ECG, lead II). (b) Noninvasively acquired arterial blood pressure (ABP) waveform. (c) W signal showing characteristic modulations by cardiovascular action and respiratory activity. (d) ECG (black line), ABP (red line) and W (blue line) signals to visualize their phase relations.
Download figure:
Standard image High-resolution imageProtocol
After having been secured on a tilt table (figure 1) in supine position (0°), the test subjects were instrumented with three-lead electrocardiogram (ECG) electrodes and with a photoplethysmography finger cuff placed around the second phalanx of the middle finger of the left hand (Finapres® Nova, Finapres Medical Systems B.V.) for continuous noninvasive acquisition of ABP. The measured ABP waveform was corrected to the heart level with a height sensor fixed at the fourth intercostal space. Calibration was carried out with two measurements of systolic and diastolic brachial ABP obtained initially by oscillometry. The W signal was measured by placing two isolated electrodes symmetrically on the subjects' foreheads in areas delineated, in a 10–20 electroencephalogram setup, by the F3, F7 and F4, F8 electrodes, respectively (Jasper 1958). After an initial resting period of ∼10 min, subjects were moved to the following positions (+ indicates head-up tilting, HUT; - indicates head-down tilting, HDT): +10°, +30°, +45°, +60°, +75°, 0° (horizontal control), −15°, and −30°. Participants were kept at each angle for 5 min. The first 3 min allowed the initialization procedure of the measurement device and to reach physiologic steady state, while the subsequent 2 min were used for signal acquisition.
Data analysis
Signals were sampled at a rate of 100 Hz and recorded through a USB data acquisition box (DT9804, Measurement Computing Corp., Norton, Massachusetts, USA) on a laptop with ICM+ software (Cambridge Enterprise, Cambridge, UK). Representative short time windows of the collected signals are displayed in figure 2. Heart rate (HR) was derived continuously from the three-lead ECG signal (figure 2(a)). Beat-by-beat mean arterial pressure (MAP) and pulse pressure (PP) were computed from the noninvasively acquired ABP waveform (figure 2(b)).
The W signal (figure 2(c)) showed characteristic modulations induced by cardiac and respiratory activity. These were analyzed in the time and frequency domain, respectively. The frequency domain was preferred for the respiratory changes in the W signal due to difficulties in identifying inspiratory and expiratory phases unambiguously in the time domain. Metrics that have been linked to CC in ICP recordings were computed: The peak-to-valley amplitude of W associated with cardiac action (AMP) was determined as the difference between the systolic peak and the diastolic valley in W. The R-peaks of the simultaneously acquired ECG signal were employed for peak detection. The time delay of the W systolic peak (ΔT) was calculated as the time difference between the systolic peak of W and the corresponding preceding R-peak in the ECG signal. The phase relationship between ECG and W is illustrated in figure 2(d).
To characterize respiratory modulation, fast Fourier transform (FFT) was applied to both the W signal and the time series of AMP values obtained in the time domain. FFT was performed on consecutive 32 s time windows with no overlap, and Hann windowing was employed to reduce spectral leakage. The respiratory peak was extracted in the frequency range of 0.14–0.33 Hz (corresponding to 8–20 breaths min−1) from both amplitude spectra, obtaining the amplitude of the respiratory wave in the W signal (Arp) and the amplitude of the respiration-induced variation of AMP (AAvp). The respiratory amplitude quotient (RAQ) was computed as the ratio of Arp to AAvp, as defined in Spiegelberg et al (2020).
Hemodynamic parameters (HR, MAP, PP), as well as parameters derived from the W signal and associated with cardiac action (AMP, ΔT), were computed using a 1 min steady-state time window extracted at each tilt angle. Steady-state was assumed if, for all considered parameters, the respective mean in all 10 s frames within the considered 1 min window did not differ by more than 15% from the respective mean in the first 10 s frame. Parameters related to respiration (Arp, AAvp, RAQ) were computed employing the whole 2 min of acquisition at each tilt angle.
Statistics
All data are reported as mean ± SD. Normality was assessed with the Shapiro–Wilk test. If, for a given variable, the data distribution at each tilt angle was normal, changes of the variable at different tilt angles were compared by repeated measures one-way ANOVA with paired t-test for multiple comparisons, applying Holm correction (Holm 1979). If at least one data distribution was not normal, a logarithmic transformation of the data was performed, and the normality assumption assessed again with the Shapiro–Wilk test. If also the log-transformed data were not normally distributed, a non-parametric Friedman test with Wilcoxon signed-rank test for multiple comparisons (applying Holm correction) was employed. For multiple comparisons, the two acquisitions at 0° were averaged for each variable and used as a reference, after verifying with either a paired t-test (if normal) or a Wilcoxon signed-rank test (if not normal) that no statistically significant difference was present between them. A P-value <0.05 was considered indicative of statistically significant differences.
Electromagnetic simulations
To gain insight into how periodic brain motion and perfusion variation influence W through changes in dielectric properties and shape, we developed a computational model based on the highly detailed MIDA anatomical head and neck model (Iacono et al 2015). Electromagnetic simulations were performed with this model using the unstructured finite element method (FEM) solver of the Sim4Life platform v6.3 (ZMT Zurich MedTech AG, Switzerland) using Dirichlet boundary conditions on surface electrodes. Dielectric tissue properties at 1 MHz according to Hasgall et al (2022) were applied.
To accurately and efficiently quantify the very small dynamic variations in head impedance resulting from changes in geometry and dielectric properties, a novel, reciprocity-theorem-based approach was developed and extensively verified (Karimi et al 2023). This method establishes separate sensitivity maps for tissue interface motion and for the associated impact on bulk brain dielectric properties. In combination with 4D brain deformation data acquired on eight healthy subjects (Karimi et al 2023), head impedance variation was estimated (change in its capacitance (dC) and resistance (dR)).
Three different scenarios were investigated, two of them theoretical to probe the boundaries of impedance change: (i) infinite, (ii) finite, and (iii) zero intracranial compliance. For the theoretical infinite compliance case (i), it is assumed that intracranial blood volume changes without any associated variation in CSF volume (i.e. the cranial compartment accommodates addition of blood without the need to displace any CSF). In this case, dC and dR stem from brain volume and the associated perfusion changes. In the theoretical zero compliance case (iii), blood and CSF volume changes compensate each other instantaneously, which is in accordance with the Monro–Kellie doctrine in its strictest sense. For case (ii), we assumed that CSF volume change compensates half of the blood volume change. To facilitate comparison with measurement data, dC and dR need to be converted to AMP. To do so, we used the LTspice (Linear Technology, Milpitas, California, USA) analog electronic circuit simulation software to establish a computational model of the PEM device (Spiegelberg et al 2022). As the output of PEM (the DEM signal) is a function of head capacitance (C) and resistance (R), its small dynamic variation can be approximated as:

where is equivalent to the W signal and its peak-to-peak value is the AMP signal. For further information on the electromagnetic simulations, we refer the reader to Karimi et al (2023).
Results
Hemodynamic parameters
During HUT, HR increased (0°: 61 ± 9 beats min−1; +10°: 63 ± 11 beats min−1, P = 0.009; +30°: 69 ± 12 beats min−1, P < 0.001; +45°: 77 ± 13 beats min−1, P < 0.0001; +60°: 89 ± 16 beats min−1, P < 0.0001; +75°: 93 ± 13 beats min−1, P < 0.0001). After returning to its resting state value during the control period (0°: 60 ± 11 beats min−1, P = 0.468), HR did not change significantly during HDT (−15°: 60 ± 12 beats min−1, P = 0.26; −30°: 61 ± 11 beats min−1, P = 0.609). MAP remained stable during HUT and HDT, except at −30° (96 ± 10 mmHg, P = 0.014). PP decreased during HUT as of a tilt angle of +30° (0°: 53 ± 9 mmHg; +10°: 53 ± 9 mmHg, P = 0.803; +30°: 48 ± 9 mmHg, P = 0.004; +45°: 44 ± 10 mmHg, P < 0.0001; +60°: 40 ± 11 mmHg, P < 0.0001; +75°: 38 ± 10 mmHg, P < 0.0001). After returning to its resting state value during the control period (0°: 52 ± 10 mmHg, P = 0.182), PP decreased during HDT at −30° (−15°: 52 ± 10 mmHg, P = 0.7; −30°: 50 ± 10 mmHg, P = 0.009). HR, MAP, and PP are reported in table 1.
Table 1. Values of hemodynamic parameters and metrics of the W signal associated with cardiac action at each tilt angle.
| 0° | +10° | +30° | +45° | +60° | +75° | 0° | −15° | −30° | 0° reference | |
|---|---|---|---|---|---|---|---|---|---|---|
| HR [beats min−1] | 61 ± 9 | 63 ± 11 b | 69 ± 12 c | 77 ± 13 c | 89 ± 16 c | 93 ± 13 c | 60 ± 11 | 60 ± 12 | 61 ± 11 | 61 ± 10 |
| MAP [mmHg] | 93 ± 8 | 93 ± 9 | 91 ± 11 | 92 ± 12 | 93 ± 14 | 96 ± 19 | 89 ± 10 | 92 ± 11 | 96 ± 10 a | 91 ± 8 |
| PP [mmHg] | 53 ± 9 | 53 ± 9 | 48 ± 9 b | 44 ± 10 c | 40 ± 11 c | 38 ± 10 c | 52 ± 10 | 52 ± 10 | 50 ± 10 b | 52 ± 9 |
| AMP [au] | 2942 ± 611 | 2670 ± 572 a | 2537 ± 430 b | 2475 ± 480 b | 2381 ± 461 b | 2307 ± 490 b | 2795 ± 624 | 3690 ± 1166 b | 4403 ± 1428 c | 2869 ± 597 |
| ΔT [s] | 0.29 ± 0.05 | 0.30 ± 0.05 | 0.34 ± 0.06 | 0.31 ± 0.05 | 0.30 ± 0.04 | 0.29 ± 0.03 | 0.30 ± 0.06 | 0.35 ± 0.06 b | 0.35 ± 0.02 a | 0.30 ± 0.05 |
Mean ± SD are reported. 0° reference (0° ref) corresponds to the average of the two 0° values. HR: heart rate, MAP: mean arterial pressure, PP: pulse pressure, AMP: peak-to-valley amplitude of W associated with cardiac action, ΔT: time delay between the ECG R-peak and the systolic peak of W. a, b, and c indicate values significantly different from the respective 0° reference. a P < 0.05. b P < 0.01. c P < 0.001.
Metrics related to cardiac action derived from the W signal: AMP and ΔT
In all subjects and at each tilt angle, the W signal showed characteristic modulation with each heartbeat. AMP, the peak-to-valley amplitude of W associated with cardiac activity, decreased during HUT (0°: 2942 ± 611 arbitrary units (au); +10°: 2670 ± 572 au, P = 0.044; +30°: 2537 ± 430 au, P = 0.004; +45°: 2475 ± 480 au, P = 0.003; +60°: 2381 ± 461 au, P = 0.002; +75°: 2307 ± 490 au, P = 0.002). After returning to its resting state value during the control period (0°: 2795 ± 624 au, P = 0.061), AMP increased during HDT (−15°: 3690 ± 1166 au, P = 0.002; −30°: 4403 ± 1428 au, P < 0.0001). The time delay of the W systolic peak (ΔT) did not change significantly during HUT. During HDT, ΔT increased (0°: 0.29 ± 0.05 s; −15°: 0.35 ± 0.06 s, P = 0.007; −30°: 0.35 ± 0.02 s, P = 0.03). AMP and ΔT are reported in table 1 and figure 3. AMP data of individual subjects are provided in the Supplementary Data (figure S1).
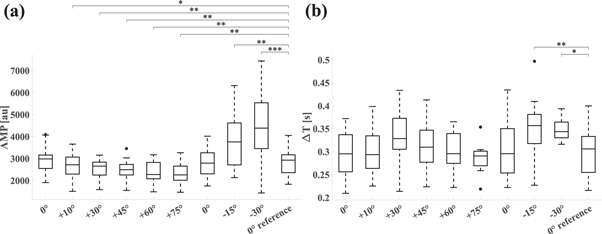
Figure 3. Boxplots of metrics related to cardiac action derived from the W signal. The horizontal axes show tilt angles. 0° reference corresponds to the average of the two 0° values. (a) AMP, the peak-to-valley amplitude of W associated with cardiac action. (b) ΔT, the time delay of the systolic peak of W with respect to the ECG R-peak.
Download figure:
Standard image High-resolution imageMetrics related to respiratory action derived from the W signal: Arp, AAvp, and RAQ
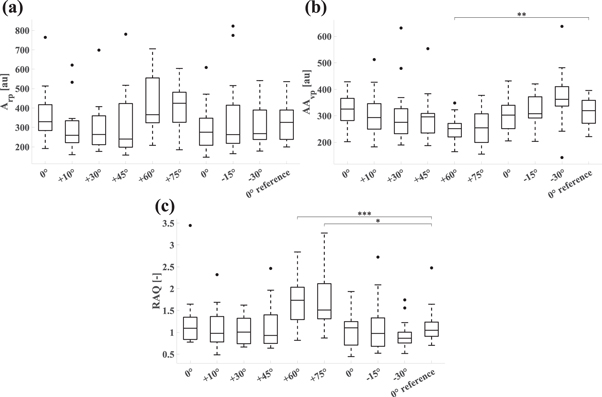
In all subjects and at each tilt angle, the W signal showed characteristic modulation by respiration. Arp, the amplitude of the respiratory wave in the W signal, appeared to increase during HUT as of a tilt angle of +60° (figure 4), but the change was not statistically significant. Arp remained stable during HDT. AAvp, the amplitude of the respiration-induced variation of AMP, did not show significant changes during HUT and HDT, apart from the +60° tilt angle (+60°: 252 ± 49 au, P = 0.007). RAQ, the respiratory amplitude quotient, was increased at HUT angles of +60° and +75° (+60°: 1.730 ± 0.588, P < 0.001; +75°: 1.748 ± 0.631, P = 0.012) compared to the 0° reference. We note that the coefficients of variation (i.e. the ratio of standard deviation to the mean) of Arp and RAQ are above 30% at each tilt angle, indicating high variability. Arp, AAvp, and RAQ are reported in table 2 and in figure 4.
Figure 4. Boxplots of metrics related to respiratory action derived from the W signal. The horizontal axes show tilt angles. 0° reference corresponds to the average of the two 0° values. (a) Arp, amplitude of the respiratory wave in the W signal. (b) AAvp, amplitude of the respiration-induced variation of AMP. (c) RAQ, respiratory amplitude quotient.
Download figure:
Standard image High-resolution image
Table 2. Values of metrics of the W signal associated with respiratory action at each tilt angle.
| 0° | +10° | +30° | +45° | +60° | +75° | 0° | −15° | −30° | 0° ref | |
|---|---|---|---|---|---|---|---|---|---|---|
| Arp [au] | 361 ± 139 | 302 ± 121 | 304 ± 130 | 317 ± 170 | 417 ± 145 | 414 ± 111 | 304 ± 121 | 350 ± 201 | 313 ± 115 | 333 ± 103 |
| AAvp [au] | 325 ± 59 | 310 ± 88 | 304 ± 112 | 296 ± 87 | 252 ± 49 b | 256 ± 73 | 307 ± 66 | 316 ± 65 | 369 ± 106 | 316 ± 54 |
| RAQ [−] | 1.234 ± 0.646 | 1.106 ± 0.470 | 1.056 ± 0.335 | 1.126 ± 0.511 | 1.730 ± 0.588 c | 1.748 ± 0.631 a | 1.073 ± 0.405 | 1.159 ± 0.610 | 0.937 ± 0.327 | 1.153 ± 0.431 |
Mean ± SD are reported. 0° reference (0° ref) corresponds to the average of the two 0° values. Arp: amplitude of the respiratory wave in the W signal, AAvp: amplitude of the respiration-induced variation of AMP, RAQ: respiratory amplitude quotient. a, b, and c indicate values significantly different from the respective 0° reference. a P < 0.05. b P < 0.01. c P < 0.001.
Electromagnetic simulations
The W signal was computed using 4D brain deformation data from eight healthy subjects (different cohort from that undergoing tilt-table testing). For each subject, three cases (infinite (i), finite (ii), and zero intracranial compliance (iii)) were investigated, as described under Methods. For each case, the peak-to-peak variation of the W signal was computed first for each subject and then the group average was calculated. For the three investigated compliance cases we obtained (i) 640 ± 150 au, (ii) 2370 ± 600 au, and (iii) 5100 ± 1100 au.
Discussion
We have shown previously that oscillations of the head's dielectric properties due to cardiac and respiratory action can be measured capacitively using a device and isolated electrodes specifically designed for this purpose. We also showed that the corresponding noninvasively obtained electric signal W is, in part, of intracranial origin (Spiegelberg et al 2022).
Based on these findings, we have investigated here the feasibility of extracting metrics linked to variations in CC from the W signal. To this end, we performed tilt tests on 18 healthy volunteers while acquiring W. Tilting has been employed previously to investigate a noninvasive method for deriving surrogates of ICP (Voss et al 2006). Furthermore, positional change is known to affect the distribution of CC between cranial and spinal compartments by gravity-induced fluid shifts (Magnæs 1989, Gehlen et al 2017). The resulting variation in intracranial fluid composition affects the head's dielectric properties, which may be reflected in the W signal. Indeed, this is what we observed: Both HUT and HDT altered the cardiovascular modulation of W.
HUT provokes gravity-induced pooling of blood in the lower body, primarily in the venous compartment (Sjöstrand 1953). The consequent reduction in venous return (MatZen et al 1991) translates to a decrease of cardiac stroke volume (SV) and PP, while a baroreflex-mediated increase in HR, myocardial contractility, and total peripheral resistance allows to maintain MAP at heart level constant (Bronzwaer et al 2014). We observed this expected behavior here: HR increased, and PP decreased as of a tilt angle of +30°, while MAP remained stable. During HDT, HR, MAP and PP were mostly unaffected, which is in line with previous studies (Goldsmith et al 1985, Nagaya et al 1995). The observed increase of MAP and decrease of PP at −30°, while statistically significant, were small (+5 and −2 mmHg, respectively). The results of HUT and HDT confirm the adequacy of our tilt test protocol.
The gravity-induced volume shift during HUT and HDT changes the intracranial CSF volume. During HUT it diminishes, and the system moves leftward on the craniospinal pressure–volume curve towards lower intracranial volume and higher intracranial compliance (increase by approximately a factor of two) (Magnæs 1989, Gehlen et al 2017). The altered compliance state affects the dynamic fluid exchange between cranial and spinal compartments during the cardiac cycle: With increasing compliance, the volume of CSF exchanged between cranial and spinal compartments decreases by roughly ∼50% (Alperin et al 2005, Muccio et al 2021). This can be illustrated with the hypothetical cases of zero and infinite intracranial compliance, respectively. In the former, the entire volume of blood entering the cranial vault during a cardiac cycle must be offset by the same amount of CSF exiting it. In the latter case of infinite compliance, blood can enter the intracranial space without the need for any CSF to move into the spinal space. How will this affect the W signal?
The electric resistivity and permittivity of blood are higher than those of CSF, while its conductivity is markedly lower (Hasgall et al 2022). Therefore, temporarily increasing the blood-to-CSF ratio within the head, as is the case in systole, will increase W. Conversely, a transient decrease in that ratio during diastole will decrease W. This is what gives rise to the cardiovascular modulation of W. The larger the difference between systolic and diastolic blood-to-CSF ratio is, the higher AMP will be. If we assume, as a first approximation, that blood supply to the brain is not affected by intracranial compliance variations within the normal physiologic range, then the difference in blood-to-CSF ratio between systole and diastole is driven primarily by the volume of CSF exchanged periodically between spinal and cranial spaces.
To investigate the relation between periodic changes in cranial fluid composition and W, and to gain mechanistic understanding, we modeled three scenarios that span the full range of theoretically possible intracranial compliance values. The corresponding electromagnetics simulations were carried out using a detailed anatomical head model (Iacono et al 2015) and a reciprocity-theorem-based computational approach (Plonsey 1963, Karimi et al 2023) to accurately determine the impact of small variations in the dielectric environment. The first investigated scenarios correspond, respectively, to the above-mentioned zero and infinite intracranial compliance cases. The third modeled scenario reflects finite intracranial compliance, with half of the volume of blood entering the brain offset by the shift of CSF into the spinal space. In all three cases, the increase in brain perfusion and the associated impedance change are maintained, and only the amount of CSF exchanged between cranial and spinal compartments during the cardiac cycle is adjusted. While the model results need to be considered as qualitative (since data on brain deformation and W were obtained on two different groups of volunteers), the following observation can be made: the largest change in W was observed for the theoretical zero compliance scenario (dominated by brain surface displacement and associated reduction of subarachnoid CSF layer thickness), while the theoretical infinite compliance case showed the smallest change (attributable to brain volume and associated permittivity changes). These model results confirm the theoretically expected influence of intracranial compliance on AMP, the cardiac-induced amplitude of W.
They are also in line with our experimental results: during HUT, AMP showed a progressive reduction with increasing tilt angle, and returned to its initial value in supine position during the 0° control. The decrease in cardiac SV associated with HUT may contribute to the reduction of AMP, since it also reduces the blood velocity-time integral in the carotid artery (Kenny et al 2020), which translates to lower oscillations of the head's dielectric properties due to cardiac action. However, this is not the only physiological mechanism involved: at +10°, where AMP is already reduced, HR is increased by only 2 beats min−1 and PP is stable, suggesting largely preserved cardiac SV.
We note that the reduction of AMP from 0° to +10° was higher than the subsequent reductions during HUT, with the AMP versus tilt angle relationship showing an exponential decay (R2 = 0.78, single-term exponential regression model). Below +20°, fluid shift occurs without full activation of arterial and cardiopulmonary reflexes (Ogoh et al 2020). Tilting beyond +20° does not only trigger these reflexes, but also causes the collapse of the internal jugular veins, requiring a partial shift towards the vertebral veins and the spinal epidural veins as main blood outflow paths (Valdueza et al 2000). This mechanism protects the brain by limiting ICP drop in upright position and is, therefore, a major regulator of CSF volume and compliance shifts during position change (Gehlen et al 2017). Consequently, jugular vein collapse might constrain the reduction of AMP at angles above +20° during HUT.
The observed reduction of AMP during HUT may appear inconsistent with reports on ICP: the cardiac component of the ICP pulse amplitude was shown to either not change significantly (Raabe et al 1999, Farahmand et al 2015) or to increase (Mahfoud et al 2010, D'Antona et al 2021) with head elevation. However, in contrast to ICP, W signal variations are a direct reflection of blood and CSF volume changes, as these affect the head's dielectric properties. Therefore, the observed reduction of AMP with head elevation is consistent with a decrease in the stroke volume of CSF oscillating between cranial and spinal compartments with each cardiac cycle (Alperin et al 2005, Muccio et al 2021). This interpretation is supported by the results of our computational model.
During HDT, AMP increased as of a tilt angle of −15°. Notably, HR, MAP, and PP remained stable at the same time. This change in AMP was clearly stronger than the reduction observed during HUT, which is not surprising given the lack of effective mechanisms to compensate for fluid shift towards the cranial space during HDT. Strangman and colleagues reported increased oscillations of cerebral blood volume during the cardiac cycle at −12° HDT as assessed by near-infrared spectroscopy (Strangman et al 2017). This is a likely contributor to the increased AMP.
The time delay (ΔT) between W systolic peak and the corresponding preceding ECG R-peak did not show any trend during HUT. ΔT increased as of a tilt angle of −15° during HDT. This aligns with the observation by Muccio and colleagues of an extended systolic phase duration in the CSF velocity waveform when moving from upright to supine position (Muccio et al 2021). Indeed, intracranial compliance is reduced in this situation, and further reduced with positional change from supine to head-down.
A clear association between positional change and metrics related to respiratory action in the W signal was not immediately evident. Arp, AAvp and RAQ showed high variability, in particular during HUT (see SD in table 2), indicating the need for a larger sample size to identify potential changes at different tilt angles. This apparently weaker link between respiratory action and W is not entirely surprising: Coupling between respiration and mechanical processes in the intracranial space, where W originates, is indirect, which introduces confounders that likely contribute to the observed variability of respiratory metrics. Larger changes in compliance may be needed to probe possible associations with the respiratory modulation of W. This could be done by obtaining W on patients undergoing testing for or treatment of volume-occupying disorders, i.e. where infusion testing or CSF diversion are employed.
Such a study on patients could address a further limitation of the current work, namely that extracranial contributions to W have not been quantified. While we showed previously that W is in part of intracranial origin (Spiegelberg et al 2022), blood vessels in the scalp, in particular those close to the electrodes, are expected to influence the acquired signal. Among indicators that speak for intracranial volume changes as significant contributors to W is the reduction of AMP when tilting from 0° to +10° without concomitant changes in the measured cardiovascular parameters.
Finally, there are further potential CC surrogates that have not been investigated in this study. In particular, metrics based on detailed morphologic analysis of the W waveform—such as the P2/P1 ratio quantifiable in ICP recordings (Cardoso et al 1983, Hu et al 2009)—were not extracted because of limited signal-to-noise ratio. Improvements in the measurement chain enhancing signal quality and reducing noise may allow such analyses in the future.
Conclusions
Cardiovascular action causes compliance-dependent oscillatory changes in the distribution of blood and CSF, which produce corresponding variations in the head's dielectric properties. These are reflected in an increase in AMP, the amplitude of W, with decreasing intracranial compliance when moving from head-up to head-down position during tilting. This observation is supported by computational electromagnetic simulations. Altogether, our data suggest that the noninvasively acquired electric signal W may contain information related to CC, and that it might be possible to derive CC surrogates therefrom, with AMP being a potential candidate. Studies with concurrent W acquisition and invasive CC measurement are required to confirm this.
Acknowledgments
This study was financed, in part, by the Swiss National Science Foundation through project Nr. 205321_182683. We would like to thank Dr Tanja Restin for her support in the planning of the physiological tests. We thank Dr Willy Kuo for producing the photographs used in figure 1. Both he and the photographed participant gave their consent for publication.
Data availability statement
The data cannot be made publicly available upon publication because they contain sensitive personal information. The data that support the findings of this study are available upon reasonable request from the authors.
Ethical statement
This study was approved by the Ethics Committee of the Canton of Zurich (BASEC-Nr. 2018–02078). This study was conducted in accordance with the Declaration of Helsinki and with local statutory requirements. All participants provided written informed consent.
Declaration of interest statement
AS is applicant and inventor of the patent application DE102018100697A1 and several dependent international applications. VK is inventor and the University of Zurich applicant of the same patent applications. AS is the owner of Cephalotec, Horgen, Switzerland, the manufacturer of the device.
Attributions of author contribution
AB: software, methodology, investigation, data curation, formal analysis, visualization, writing—original draft. AS: conceptualization, methodology, supervision, formal analysis, writing—review and editing. FK: software, investigation, formal analysis, writing—review and editing. KG: investigation, formal analysis. AF: supervision, methodology, formal analysis, writing—review and editing. EN: funding acquisition, conceptualization, supervision, project administration, formal analysis, writing—review and editing. NK: funding acquisition, resources. VK: funding acquisition, conceptualization, project administration, supervision, formal analysis, writing—review and editing. All authors read and approved the final manuscript.
Supplementary data (0.2 MB PDF)