

Abstract
Objective:
The eye may act as a surrogate for the brain in response to head acceleration during an impact. This paper reports the latest demonstration of the correlation between the passive human eye accelerations and the brain accelerations under head impacts using a model eye/brain/skull phantom.
Approach:
Experiments investigating rotational and linear accelerations were performed on a 3D-printed human head phantom, along with rotational experiments on a human volunteer. Data acquired during the passive eye response (PER) periods were processed and analysed using statistical methods including one-way normal analysis of variance, linear regression fit, and Pearson R correlation.
Main results:
The results have shown that, at least on the 3D-printed human head phantom, strong correlations can be found between the eye and the brain during the PER, which indicates a potential use of microelectromechanical systems inertial measurement units in real-time on-field monitoring and diagnosis of concussions or traumatic brain injuries.
Significance:
These discoveries pave the way for potential non-invasive wearable devices based on this technology to be applied in real-time on-field concussion monitoring, which is expected to provide vulnerable parties with instant alert thus timely treatment.
Export citation and abstract BibTeX RIS
1. Introduction
It is estimated that sports-related traumatic brain injuries (TBIs) affect 3.8 million athletes every year (Collins et al 2012, Halstead et al 2010) and that TBI causes over $56.3 billion US dollars in economic loss every year (Thurman et al 1999). Furthermore, a recent 2013 survey of 262 college-aged athletes reported that 43% of athletes who sustained a mild TBI (mTBI or namely concussion) knowingly hid their symptoms to stay in the game (Torres et al 2013). Although advanced technologies such as computed tomography (CT) and magnetic resonance imaging (MRI) have the potential to image brain motion/deformation during small, non-injurious head accelerations (Axel and Dougherty 1989, Bayly et al 2012), it is unlikely for them to be used to evaluate the large, potentially injurious head acceleration encountered in the field. Recent studies of blood-based protein biomarkers for TBI were introduced with high accuracy in detecting mTBI (Mondello et al 2018, Bazarian et al 2018). However, the necessary procedures of processing venous blood to serum, transferring to cryovials and freezing at −80 °C for transport, etc, make such technique only suitable for post-event testing, which is also the limit shared with CT and MRI scanning.
There are two types of head acceleration that occur in almost every instance of an mTBI: rotational acceleration and linear acceleration (Meaney and Smith 2011). There is substantial evidence to show that both types of accelerations can cause concussive brain deformations, and the shear deformation of the brain is the predominant mechanism that causes concussions (Unterharnscheidt and Higgins 1969). It has been shown through physical simulations on gelatin brain models that the largest shear strains were associated with rotational movements of the head (Margulies et al 1990, Meaney et al 1995).
Over the past several years, there has been an increased focus on attempting to diagnose TBIs in real time. The development of such tests as the King-Devick sideline test have improved the rate of diagnosing on-field concussions (Leong et al 2015), but this method is still far from having a 100% accurate diagnostic rate. If a player who has a concussion undergoes this short sideline examination, there is a good chance they will be able to be diagnosed, but there are still many scenarios when a player receives a concussion during play and is not flagged by the sideline doctors as requiring an examination. Although 90% of TBIs are mild in severity (Centers for Disease Control et al 2007) and the patients usually recover quickly, there are concerns about the long-term effects of repetitive sub-concussive blows, especially when they are not diagnosed and treated in time. Based on the connection of head accelerations and mTBI mentioned above, the creation of a tool that could be worn by contact sport athletes like football players that would directly allow for brain and head accelerations to be measured would greatly increase the efficiency of diagnosing on-field concussions and preventing these players from returning to the game.
Currently, there are some technologies that measure acceleration and movements of helmets that players wear during games. A significant effort toward this direction is the Head Impact Telemetry (HIT) SystemTM (Simbex 2019), which uses an array of non-orthogonal accelerometers mounted inside helmets to provide on-field real-time monitoring of head accelerations with the intention to predict TBI from head kinematics. However, even though this helmet can gather accurate data about the movement of the head, to this point there has not been shown to be a strong connection between TBI and head movement (Guskiewicz et al 2007, Broglio et al 2011, Viano 2012, Breedlove et al 2012, Funk et al 2012, Jordan 2013, Talavage et al 2014). Due to the insufficiency of head movement data in predicting possible TBIs in real time, there is a need for another solution that could be used to make more accurate predictions.
This study focused on using the movement of the eyes directly after an impact as a measure to predict the movement of the brain within the skull. In humans, the vestibulo-ocular reflex does not occur immediately after a strong head acceleration, therefore allowing a passive eye response (PER) to head impacts, which typically takes approximately 20 ms. This type of movement of the eye is controlled entirely by laws of dynamics (Bush and Miles 1996, Collewijn and Smeets 2000). Furthermore, there has been research that shows that brain and eye injuries are closely related. Approximately 66% of US service members that suffered a TBI also had ocular trauma (Weichel et al 2009), while 78% of children that suffered abusive head trauma had retinal hemorrhages (Maguire et al 2013). These data lend credence to the idea that eye movement could be similar to, and directly predict, brain movement within the skull. It has been demonstrated that the eyeball moves differently than the skull and this was shown in both models of the human eyeball and in human subjects, utilizing microelectromechanical systems (MEMS) inertial measurement units (IMUs) mounted on flexible printed circuits (PCBs) (Liu et al 2016, Meng et al 2017, Bottenfield et al 2019, Prather et al 2019). If a direct correlation can be established between PER and brain responses to the same head/body acceleration, the non-invasively accessible PER can serve as a predictive surrogate for the real-time brain responses under conditions in which direct observation of the brain is impossible. Using PER as a window to peek into brain dynamics can be a powerful research tool to understand the biomechanics of concussion, the effect of repetitive non-concussive impacts, and even on-field concussion risk assessment.
In this study, both rotational and linear movements of the 3D printed phantom skulls containing polydimethylsiloxane (PDMS) eye and gelatin brain models are performed in a multitude of ways to mimic this shearing of the brain. Although a phantom head does not have active neural control of the eye, it allows us to observe the entire time course of PER, uninterrupted by active neural control. In order to study if the IMU is sensitive enough to detect PER under non-injurious head acceleration, human tests were done and introduced in section 2.4.
This paper details the design and testing of the flexible PCB mounted MEMS IMUs (figure 1) on 3D-printed human head phantoms in sensing the brain response under rotational (section 2) and linear (section 3) accelerations, so as to explore the correlation between the PER and the brain response in mTBIs. Specific designs of experiment, data processing, and study of the correlation between the passive responses of the phantom eyes and brain are provided in these sections respectively. Section 4 provides concluding remarks and future works.
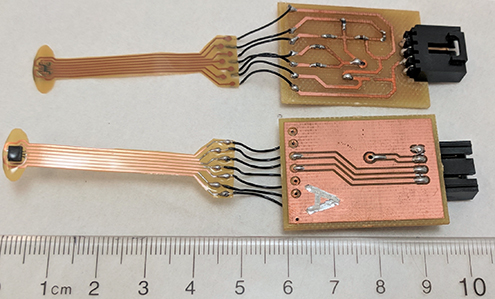
Figure 1. Flexible printed circuit board mounted microelectromechanical systems inertial measurement units with interface circuits and a ruler for scale.
Download figure:
Standard image High-resolution image2. Sensing brain response to head rotation
2.1. Design of sensor and data acquisition (DAQ)
Six 6-degree-of-freedom (DoF) LSM6DS3 IMUs by STMicroelectronicsTM (2016), each containing a 3-DoF accelerometer and a 3-DoF gyroscope, were used to capture data in this study. Five of the IMUs were mounted on ribbon-style flexible PCBs made of 25.4-µm-thick DuPontTM Pyralux, coated with silicone conformal coating, and connected to interface PCBs as seen in figure 1. As an improvement compared to the design in Meng et al (2017), the polyimide substrate material was trimmed into a half-moon shape designed to fit the sensor to the surface of the eyeball in the lower eyelid, and better couple the motions of the eye and sensor at the position of the IMU. The sensor's silicone conformal coating created a moisture barrier to protect the circuits and made the sensor less likely to scratch the eye. The last IMU was mounted on a SparkFunTM breakout board as a reference sensor for data calibration and relative acceleration computation.
A data acquisition (DAQ) system containing three TeensyTM 3.6 micro-controllers (MCUs) (PJRC 2019) was created to control and communicate with the six IMUs via I2C buses, acquire sensing data, and log the data into a micro SD card for further processing (figure 2). The MCUs were plugged on a motherboard and synchronized by sharing the same trigger interrupt. Each MCU hosts two IMUs. Through the MCUs, the gyroscopes were programmed to operate with a sensing range of ±2000° s−1 and a sensitivity of 70 mdps/LSB. The sampling rates and bandwidths of the gyroscopes were set as 1.66 kHz and 400 Hz respectively to obtain the best performance of the IMUs. The output data rate (ODR) was set as 6664 Hz. The bandwidth is determined by the ODR selection suggested by the data sheet to set an anti-aliasing filter for high performance. All the sensing data, including temperature readings from the six IMUs, were buffered in the 256 KB RAM of each MCU before being logged to its micro SD card. The overall sampling rate was 1 kHz which was sufficient for this application (Meng et al 2017).
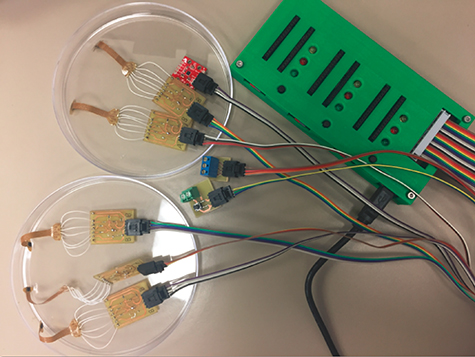
Figure 2. A photograph of customized TeensyTM 3.6 data acquisition system in a 3D-printed box cabled to six inertial measurement units, a trigger button, and a signal output.
Download figure:
Standard image High-resolution image2.2. Design of experimental system
To mimic a human head, a scaled plastic phantom human skull was 3D-printed and employed as the main test unit, as shown in figure 3. The 3D model was based on scanning data of a real person's head (MacGyver 2013). The phantom skull had multiple openings that needed to be closed to create the gelatin brain. OateyTM plumber's putty and 100% silicone were used to prepare the skull for creation of the phantom brain and eyes by filling these holes. Furthermore, the back of the eye sockets were also filled with putty to prevent leaking of the gelatin surrounding the phantom eyeballs. Once all the holes were filled, DremelTM and drill power tools were used along with multiple screws to drill four small holes into the skull around the eye sockets to position the phantom eyeballs in the anatomically correct place within the eye sockets (figure 3(a)). Finally, three slits and one hole were created in the top piece of the skull using a DremelTM. The IMU sensors were inserted through these slits and the hole was for pouring of the gelatin. The three slits for the IMUs were placed on a diagonal with respect to one another.

Figure 3. The vestibulo-ocular response chair test apparatus. (a) Placements of polydimethylsiloxane eyeballs with an alignment device. (b) Placements of ribbon-style flexible printed circuit board mounted inertial measurement units on the eyeballs. (c) Placements and connections of ribbon-style flexible printed circuit board mounted inertial measurement units in the gelatin brain. (d) Placements of the phantom skull on the vestibulo-ocular response chair with all inertial measurement units connected and synced to the data acquisition system.
Download figure:
Standard image High-resolution imageThe eyeball and eyelid replicas were made in the same way as introduced in Meng et al (2017). In preparing the phantom eyes, a suspension platform was mechanically attached on the 3D-printed phantom skull using the four small holes mentioned above, and held the two phantom eyeballs in the correct anatomical position inside the sockets while the gelatin surrounding the eyeballs solidified (figure 3(a)). Both 2% and 4% gelatin solutions were used for the right and the left eyes, respectively. A piece of PDMS eyelid was then glued to the skull around each eye socket, had a slit cut in the center, and had an IMU placed within the slit where it was touching both the eyelid and the eyeball (figure 3(b)).
Among the six sensors, one was tightly fastened on the forehead as the reference which moves with the skull (SK) as shown in figures 3(c) and (d), two were inserted through the horizontal slits of the eyelids and held tightly on the eyeballs by the eyelids (figure 3(b)), one in the left eye (LE) and one in the right eye (RE). The other three were inserted in the gelatin brain in the skull cavity through three slits on the skull top (figure 3(c)). These slits formed a diagonal line so that motion/deformation of be brain tissue in different directions can be monitored. There was one IMU in the anterior left of the gelatin phantom brain (AB), one in the middle of the brain (MB), and one in the posterior right of the brain (PB). The three sensors were planted vertically into the brain, facing front. They were on the same depth of approximate 40 mm from the top of the brain. The sensor interface boards were taped to the skull with electrical tape, and the top of the skull was stuck on to the bottom using silicon and plumber's putty. The gelatin solution with mass ratio of 5% was created and poured into the assembled phantom skull through the pour hole, covered the sensors, and was put in the 4 °C refrigerator overnight to allow for it to solidify.
A vestibulo-ocular response (VOR) chair, provided by the Vision Sciences Department at the University of Alabama at Birmingham (UAB), was used to actuate rotational motions of the skull phantom, so as to collect data about the movement of the IMUs within the brain and on the eyes (figure 3(d)). The phantom skull was secured on a metal plate above the seat of the VOR chair. A data collection task of 'hit' motion were performed with this chair. A hit-motion consists of a very quick jerk in a random direction around the y-axis of the chair (figure 3(d)), either clockwise or counterclockwise viewing from above. The peak velocity during the hit-motion task was 160° s−1 and the peak acceleration was 1025° s−2.
2.3. Data processing and analysis
The hit-motion experiments provided a good understanding of the time delays associated with the start of rotation of the test IMUs compared to the starting time point of the reference IMU. Angular accelerations recorded by the gyroscopes were integrated to get time-varying rotation angles. Figure 4 shows a plot of rotational data around the y-axes (angles of θ) collected by all the six IMUs during a typical counterclockwise hit-motion at the start. The y-axes were studied because the IMUs were all aligned in a way that the majority of rotations happened around their y-axes, which is aligned with the y-axis of the VOR chair, as shown in figure 3. Three thresholds of 0.5°, 1°, and 1.5° were applied to study the time delays. Though varying in different rotational thresholds, the time delays compared to the reference forehead IMU, from short to long, all tend to follow the order of posterior brain, left eye, middle brain, right eye, and anterior brain, as shown in figure 5. This tendency was repeatable in the ten hit-motions in the experiment of four clockwise rotations and six counterclockwise rotations. The averages and standard deviations (STD) of all the processed data are recorded in table B1 in appendix
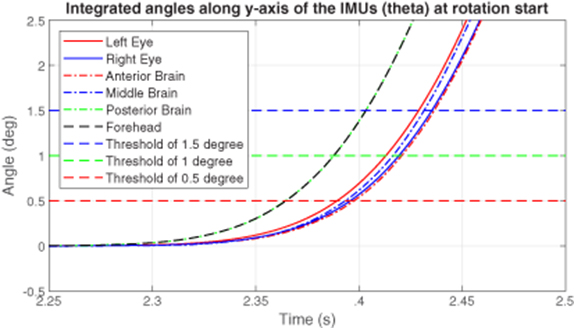
Figure 4. A plot of rotation angles around the y-axes of the inertial measurement units against time at the rotation start in a vestibulo-ocular response chair hit-motion experiment on the head phantom.
Download figure:
Standard image High-resolution image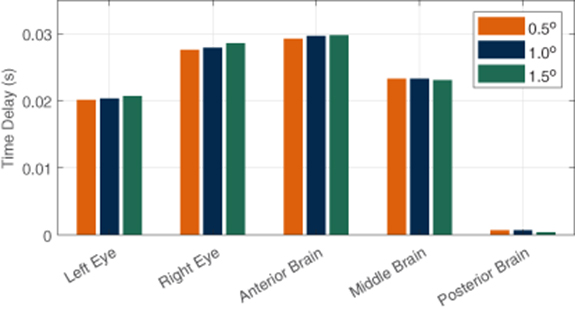
Figure 5. Average time delays of rotation start points compared to the reference inertial measurement unit on forehead using different thresholds in the vestibulo-ocular response chair hit-motion experiments on the head phantom.
Download figure:
Standard image High-resolution imageThe results demonstrate that the rotational motions of both eyes were good reflections of the rotations of the brain since the time delays of both eyes from the skull rotation fell into the range of the time delays of the different parts of the brain. Specifically, on average, both eye delays were longer than the posterior brain delay, and shorter than the anterior brain delay. The fact that posterior brain had the shortest delay while the anterior had the longest delay corresponds with the fact that the posterior brain IMU was closest to the inner wall of the skull back and the rotation axis of the VOR chair, therefore the motion coupled better to the skull, which was fastened on and moved along the chair (figure 3(d)). Although the IMUs on the eyeballs were further away from the rotation axis than the anterior brain, the confinement of the sockets, which have much smaller cavities than the skull does, acted in a way to accelerate the eyeball rotations to match the pace of the brain. One should also notice that the left eye had shorter delay than the right eye due to the greater stiffness of the 4% gelatin than the 2% gelatin. These findings in the processed data indicate that the rotational PER captured by the MEMS IMUs have potentials to reflect the rotational accelerations of the brain in real time when rotational accelerations are applied to the head.
2.4. Human testing and analysis
A human volunteer was tested under the non-concussive conditions of hit-motion (figure 6(a)), so as to further validate the idea of applying MEMS IMUs to sensing PER during head rotation. (The study was approved by the Institutional Review Board of UAB and conducted in accordance with the Declaration of Helsinki.) The volunteer sat in the VOR chair with one flexible IMU sensor inserted in the left eye, held in position by the lower eye lid, and the other IMU attached on the forehead as reference.

Figure 6. A volunteer being tested in the vestibulo-ocular chair. (a) A photograph of the volunteer sitting in the vestibulo-ocular chair with one inertial measurement unit inserted in the lower eyelid of the left eye and the other inertial measurement unit attached on the forehead. (b) A plot of rotation angles around the y-axes of the inertial measurement units against time at the rotation start in a hit-motion experiment on the human volunteer.
Download figure:
Standard image High-resolution imageSimilarly as in section 2.3, angular accelerations recorded by the gyroscopes were integrated to get time-varying rotation angles. A typical set of results is plotted in figure 6(b). Notice that, at the rotation start in the zoomed-in part (highlighted in green), the left eye rotation (red solid line) experienced a delay relative to the head rotation (black dashed line) as a PER. It appears that the ocular muscles then took control to correct the orientation of the eyeball by accelerating the rotation. The active muscle control allowed the eye to catch up with the head motion at approximately 1.19 s. Later on, the eye motion oscillated around the rotation speed of the head, until both stabilized at approximately 4.25 s when the hit-motion task was completed. All these phenomena correspond with the observations provided in Bush and Miles (1996), Collewijn and Smeets (2000). Also notice that, in the zoomed-in part, the three manually selected thresholds were reached by the eye before an apparent reflex interference was observed, which further validated that the previous selection was legitimate to study the rotational accelerations on the head phantom.
Although such subtle behavior of human eye could not be observed in the phantom test, both experiments showed that the 3D-printed human head phantom behaves similar to the real human head, and at the same time, proved that the rotational PER captured by the MEMS IMUs is different from the head rotation, and it has potentials to reflect the rotational accelerations of the brain in real time. The results from the human testing also showed that the IMUs were sensitive enough to register PER even under non-injurious head acceleration.
3. Sensing brain response to linear acceleration of the head
3.1. Experimental apparatus
Although the gyroscopes were capable to sense the delays of rotation starting times among the roughly aligned sensors, a more controlled experimental apparatus is needed to explore the correlation between the PER and brain acceleration under linear head accelerations. In the experimental apparatus of this section, the same LSM6DS3 IMUs, customized DAQ and 3D skull model were used. The skull-brain-eye system first introduced in Prather et al (2019) was further improved in accuracy and employed in this test. As illustrated in figure 7, the reference IMU was attached on the nose of the phantom skull, two flexible IMUs were attached on the right and the left eye replicas, and three flexible IMUs were inserted in the phantom brain at three typical positions on a diagonal: anterior brain, middle brain, and posterior brain. All the IMUs were aligned with their corresponding sensing axes parallel to one another, and with their centers on the same horizontal sagittal plane, resulting in their z-axes in a direction pointing to the front of and vertical to the face of the skull, x-axes pointing to the left side of the skull, and y-axes upward. Red circles in the cross-section view of figure 7(a) highlight relative positions of the six IMUs on the x–z plane. Notice that the IMUs at AB, MB and PB were evenly separated on a diagonal, also the z-axes of IMUs at RE and PB, LE and AB, reference and MB, overlapped in x-axes respectively. Such alignment of IMUs in the phantom head was achieved by the approach introduced in appendix
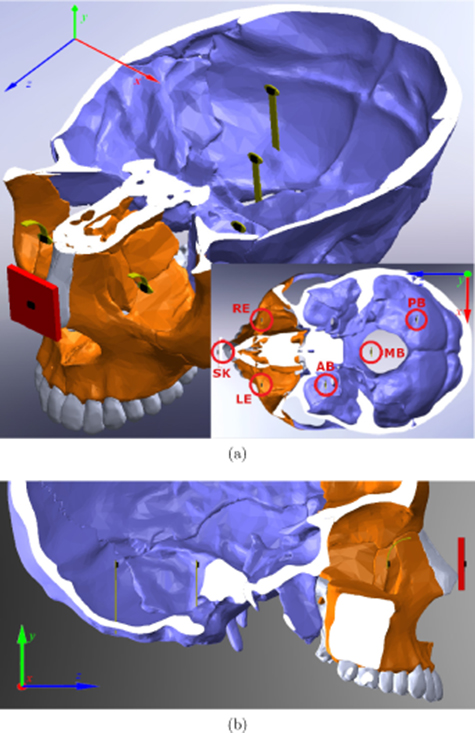
Figure 7. Illustration of inertial measurement unit positions in the 3D-printed human head phantom.
Download figure:
Standard image High-resolution imageThe finished experimental apparatus is shown in figure 8. Many of the settings were identical to the ones introduced in section 2.2. The reference IMU was inserted in the holder which was fixed on the phantom skull. The two eye IMUs were placed on the PDMS eye replicas, held by 1-mm-thick PDMS eyelids. Gelatin mixtures of 4% and 2% mass ratios of gelatin to water were used for the emulation of the right and the left socket tissue respectively. For this experiment, a football helmet was used to better emulate the real-world situation.

Figure 8. An overview of the test apparatus with the 3D-printed human head phantom.
Download figure:
Standard image High-resolution imageFor testing, the phantom skull inserted in the football helmet was attached to a PVC emulated neck anchored on a portable and adjustable platform with leveling feet as shown in figure 8. This setup allowed the phantom skull to fall in an inverted pendulum orientation, resulting in impact with the platform surface. Repeatable drop-and-impact tests were performed by lifting the phantom skull in helmet using a brass rod and a tiered 3D-printed platform which provides three dropping heights: low (135 mm), medium (155 mm), and high (175 mm). Drops of the skull were initiated by removing the brass rod supporting the neck, which allowed the phantom skull in helmet to fall and collide with the platform surface. The brass rod also served as a triggering mechanism to signal the starting time stamp of the fall, as two electrodes connected to the PVC spine would be shorted while in contact with the brass rod and opened while losing the contact. When impact between the back of the football helmet and the platform surface occurred, another two electrodes on the platform surface were shorted in a similar manner by the conductive copper tape on the back of the helmet. This trigger signal was recorded and synchronized with the recorded IMU data by the DAQ introduced in section 2.1 and logged in micro SD cards for further processing in MATLAB and R language.
3.2. Data processing and statistical study with analysis of variance (ANOVA)
A number of drop-and-impact experiments on this skull-brain-eye system were performed with the testing apparatus. Relative accelerations of the eye and brain IMUs to the phantom skull along the impact direction were calculated applying the data fusion technique developed in Meng et al (2017). Instead of relative displacements, only relative accelerations were computed to further diminish errors introduced by integration. Figure 9 plots the relative accelerations from a typical result, where a vertical green solid line marks the impact time, a dashed blue line marks the 20 ms after the impact, and a red dashed line marks the impact end time. Since PER happens in approximately 20 ms after impact, the data sets within such periods were studied.
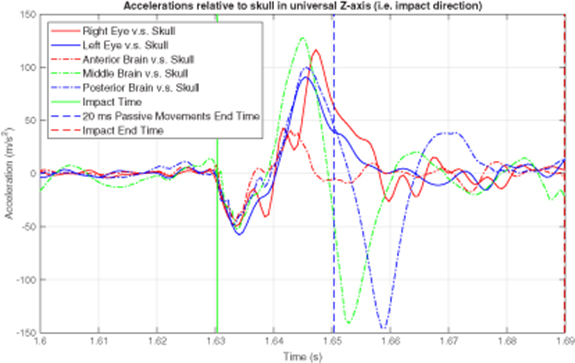
Figure 9. Relative accelerations to the skull in the direction of impact in a drop-and-impact experiment on the 3D-printed human head phantom.
Download figure:
Standard image High-resolution imageThe statistical method of one-way, fixed effects, normal analysis of variance (one-way ANOVA) was employed to study the associations/correlations between the accelerations measured by the IMUs at RE/LE/SK and at AB/MB/PB (Anscombe 1973, Tamhane 1977, Stoline 1981). The usage of one-way ANOVA can be considered reliable since the variable residuals are all approximately normally distributed, which is an assumption of this method. A typical histogram given by the assumption check is plotted in figure 10. For each data set mentioned above, 33 samples were processed with the degree of freedom of 1 and residuals of 30. Probability values (p-values) were calculated to evaluate the association. The levels listed in table 1 indicate the statistical significance or association or correlation for the accelerations between two sensor positions. Specifically, the null hypothesis in the ANOVA tests is not rejected if a p-value > 0.05, labeled as 'null' in table 1. The null hypothesis is rejected if a p-value < 0.05, and the closer the p-value is to 0, the higher level of statistical significance the association has, which is shown by the number of asterisks in table 1 with more asterisks representing greater association.
Table 1. P-values to reject null hypothesis for associations between eye/skull sensors and brain sensors using one-way ANOVA.
| Data Set | P-values | ||||||||
|---|---|---|---|---|---|---|---|---|---|
| Right eye | Left eye | Skull | |||||||
| AB | MB | PB | AB | MB | PB | AB | MB | PB | |
| 1 | null | *** | *** | null | *** | *** | *** | * | * |
| 2 | *** | *** | *** | *** | *** | *** | *** | null | null |
| 3 | *** | null | *** | *** | null | *** | *** | *** | null |
| 4 | *** | *** | *** | *** | *** | *** | ** | null | null |
| 5 | *** | * | *** | *** | *** | *** | *** | null | ** |
| 6 | * | *** | *** | *** | *** | *** | ** | null | null |
| 7 | *** | *** | *** | *** | *** | *** | null | null | null |
| 8 | ** | *** | *** | *** | *** | *** | *** | ** | * |
| 9 | *** | *** | *** | *** | *** | *** | *** | ** | * |
| 10 | *** | *** | *** | *** | *** | *** | *** | null | null |
| 11 | *** | *** | *** | *** | *** | *** | *** | null | null |
| 12 | *** | *** | *** | *** | *** | *** | ** | null | null |
| 13 | null | *** | *** | null | *** | *** | *** | null | null |
| 14 | *** | *** | *** | *** | *** | *** | *** | null | null |
| 15 | *** | *** | *** | *** | *** | *** | *** | null | * |
| 16 | *** | *** | *** | *** | *** | *** | *** | null | null |
| 17 | *** | *** | *** | *** | *** | *** | *** | null | null |
| 18 | *** | *** | *** | *** | *** | *** | *** | null | * |
| Group | *** | *** | *** | *** | *** | *** | *** | null | * |
| Significance code | p-value is 0  '***' '***'  0.001 0.001  '**' '**'  0.01 0.01  '*' '*'  0.05 0.05  'null' 'null'  1 1 |
||||||||

Figure 10. A histogram of the variable residuals from a typical data set in a drop-and-impact experiment on the 3D-printed human head phantom.
Download figure:
Standard image High-resolution imageNotice that, in table 1, all the p-values for the correlations are the lowest between the right eye and the posterior brain (RP), and between the left eye and the posterior brain (LP), indicating that the associations in these pairs of data have the strongest statistical significance. This may result from the fact that all the three IMUs at RE, LE and PB were located closer to the inner wall of the skull/socket where the impact power was transmitted faster and earlier than to AB and MB. Statistical significance levels for the correlations between RE/LE and AB/MB (RA, RM, LA, and LM, respectively) are relatively lower, yet generally higher than the ones between the skull and the brain parts (SF, SM, and SP, respectively). Further observations show that, the eyes are better correlated to PB while the skull is better correlated to AB. The correlations of SM and SP are especially weak and unstable, which may explain the inability of helmet/mouthguard mounted sensors to accurately assess mTBI in real-time on the field as discussed in section 1. These observations suggest that sensing the linear PER using MEMS IMUs could provide better outcomes than sensing the skull for real-time on-field objective concussion monitoring and diagnosis.
Although the results provided by the one-way ANOVA confirmed the hypothesis of this paper, p-values to reject the null hypothesis have their limits of generalization. Details about the performance of each eye sensor are unknown. More quantified assessments of correlations are explored in the following two sections, utilizing R2 values provided by linear regression analysis, and R and p-values provided by specialized correlation model, respectively.
3.3. Linear regression analysis
The data within periods of 20 ms when passive eye response (PER) happens were studied by polynomial linear regression analysis to study correlations. Statistical model fitting coefficients, such as coefficients of determination (R2's) and p-values, were calculated to evaluate the fit (Glantz and Slinker 1990). R2 values for 5th order polynomial regressions of the data plotted in figure 9 were calculated and recorded in table 2. Since the R2 values are coefficients of determination which provides a measure of how well observed outcomes are replicated by the model, based on the proportion of total variation of outcomes explained by the model (Draper and Smith 1998), the closer they are to 1, the larger portion of data can be expressed by the regression model, and the better two studied accelerations are correlated. Notice that, even though the relative accelerations of the three brain IMUs appear to be quite different from those of the two eye IMUs over a longer time (figure 9), they have a stronger correlation during the 20-ms time window after impact which we consider as the time for PER, than the correlation of the skull and brain has (table 2). In this case, the strongest correlation happened to be between the left eye and the posterior brain, with an R2 of 0.983 in the linear regression analysis, while the weakest correlation was between the skull and the posterior brain with an R2 of only 0.176.
Table 2. Polynomial regression analysis of a typical test data set in a drop-and-impact experiment on the 3D-printed human head phantom.
| R2 values for 5th order polynomial regression | |||
|---|---|---|---|
| IMU position | Anterior brain | Middle brain | Posterior brain |
| Right Eye | 0.448 | 0.610 | 0.842 |
| Left Eye | 0.532 | 0.753 | 0.983 |
| Skull | 0.389 | 0.207 | 0.176 |
The averages and STDs of the R2 results from 18 repeatable tests including the one studied above are listed in table B2 in appendix

Figure 11. Average R2 values for 5th order polynomial regression of the data sets in the drop-and-impact experiments on the 3D-printed human head phantom.
Download figure:
Standard image High-resolution image
Figure 12. Histograms of R2's and beta distribution fits of the data sets in the drop-and-impact experiments on the 3D-printed human head phantom.
Download figure:
Standard image High-resolution imageNotice the interesting fact that the mass ratios of gelatin used in LE, RE and PB were 2%, 4% and 4% respectively. With most of the other parameters identical, LP had stronger correlation than RP did, even though RE and PB had the same concentration of gelatin. It is possible that this is a result of similar natural mechanical frequencies of LE and PB: one in an environment with less stiff gelatin (2%) but smaller space (eye socket), the other with stiffer gelatin (4%) yet larger space (skull cavity). Although the exact causation of this phenomenon is unknown, both eye linear accelerations were well correlated to the brain parts linear accelerations. The results thus again suggest that sensing the linear PER using MEMS IMUs could provide better outcomes than sensing the skull for real-time on-field objective concussion monitoring and diagnosis.
3.4. Pearson R correlation analysis
The limit of linear regression study is that it only reflects one possible regression fit for the data pairs, however good the results are. Multiple statistical models to study correlation exist as bivariate analyses that measure the strength of association between two variables and the direction of the relationship. Typical models use Pearson's linear correlation coefficient, Kendall's tau coefficient, and Spearman's rho, etc, to represent the correlations. Based on the characteristics of our data sets discussed in sections 3.2 and 3.3 and the assumptions of these correlation methods, Pearson R correlation was selected (Benesty et al 2009).
The method of Pearson R correlation is the most widely used correlation statistic to measure the degree of the association between linearly related variables. In Pearson R correlation, the value of the correlation coefficient R varies between −1 and +1. A value of −1 indicates a perfect negative correlation, while a value of +1 indicates a perfect positive correlation, and a value of 0 indicates no correlation between the two sets of data.
The PER data were processed with Pearson R correlation, and the calculated R values with the corresponding p-values are plotted in the box plots in figure 13, where the horizontal red lines mark the median, blue boxes represent the first quartile (upper edge) and the third quartile (lower edge), horizontal black lines label the maximums (upper) and minimums (lower), and red crosses mark the outliers for each data pair. In figure 13(a), the R values for RA, RM, RP, LA, LM, LP, and SF are all close to 1, indicating better and positive correlations. Among them, LP has the largest R values with the best convergence, followed by RP. Even the outliers for LP are close to 1. Although LP and RP have the best correlations, the eyes seem to show little advantage in correlating to the anterior brain compared with the skull. However, the skull is weakly correlated to MB and PB with R values closed distributed around 0. P-values in figure 13(b) confirm the statistical significance of the corresponding Pearson R correlation analysis, among which most of the p-values of RA, RM, LA, LM and SF are lower than 0.05, and the p-values of RP and LP are all well below 0.05. In contrast, the p-values of SM and SP suggest that these correlations are not reliable even some of them may have a good R.
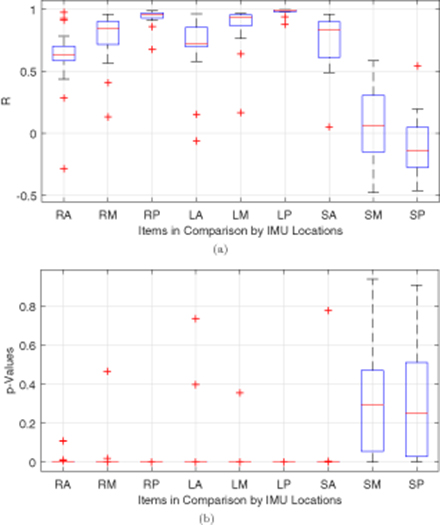
Figure 13. Box plots of the (a) R and (b) p-values provided by Pearson R correlation method applied on the data sets in the drop-and-impact experiments on the 3D-printed human head phantom.
Download figure:
Standard image High-resolution imageAgain, the left eye was found as the best indicator of the accelerations of the posterior brain which is closest to the impact point, followed by the right eye. The correlations between the accelerations of the skull and of the brain phantom were either too weak or too random in distribution. This makes sensors on the skull less reliable in reflecting phenomena that occurs in the brain. The merits of using the eyes as surrogates to the brain for real-time on-field objective mTBI monitoring and diagnosis are proved in all the three sets of analysis above. The details of data can be affected by the factors such as how and where the sensors are placed and how acceleration is applied. The key finding is that this is the first time that PER is shown to be time-locked and highly correlated with brain responses. Therefore, we can learn brain motion/deformation from PER.
4. Conclusion
A novel concept of using MEMS IMUs to record the rotational and linear accelerations of the eye as a surrogate to sense the accelerations of the brain during head impacts was introduced and verified on 3D printed human head phantoms in this paper. Testing results given by the sensors on a VOR chair for hit-motion impacts and on a skull-brain-eye apparatus for drop-and-impact experiments both indicated that the captured PER has great potentials to reflect the accelerations of the brain. Human testing on the VOR chair verified the usage of IMUs in detecting PER under non-injurious head acceleration as well. Strong correlations of eye and brain accelerations were discovered in the drop-and-impact model tests thus suggest that sensing the PER using IMUs could provide better outcomes than sensing head accelerations for real-time on-field objective mTBI monitoring, assessment, and diagnosis.
As the limit of the current research, there is still a gap between the verified theory and a mature product. Challenges such as comparing the IMU data with dynamic MRI data, and miniaturizing the sensors to a wireless contact lens need solutions. These tasks are beyond the scope of this paper and expected to be accomplished in future phases of relevant research.
Acknowledgments
This work was supported in part by NIH NINDS R21. The author's have confirmed that any identifiable participants in this study have given their consent for publication.
Appendix A.: The alignment of inertial measurement units (IMUs)
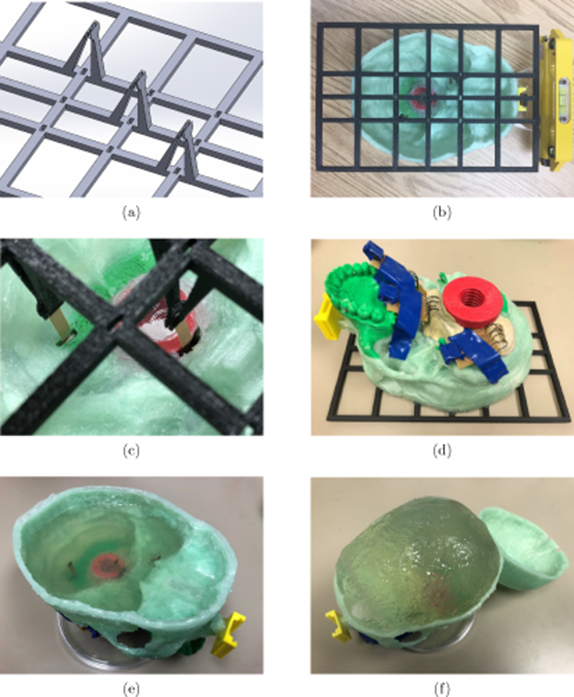
The alignment of the brain inertial measurement units (IMUs) was achieved by a 3D-printed aligner frame designed in SolidWorksTM as shown in figure A1(a). Three pairs of clamps were designed to fit the shape and dimensions of the flexible ribbon-style PCB mounted IMUs, and to hold the three brain IMUs in the desired positions both horizontally and vertically. Observation windows were opened on the aligner frame to calibrate the alignments. Silicone glue was used to attach the frame onto the lower half of the skull model to ease later removal, while super glue was used to attach the reference IMU holder so as to firmly couple its motion to the phantom skull (figure A1(b)). A level and a laser pointer were used to align the frame with the reference IMU holder before the glues cured. Brain IMUs were inserted to the lower half of the phantom skull through slits opened under the desired positions, and then held by the clamps (figure A1(c)). The slits were then sealed with plumber's putty for water proofing (figure A1(d)).
Figure A1. Alignment of inertial measurement units. (a) The 3D computer-aided design model of the inertial measurement unit aligner frame made in SolidWorksTM. (b) A 3D-printed aligner frame (black) attached to the phantom skull (green) while aligned to the reference inertial measurement unit case (yellow). (c) Inertial measurement units held in position by the aligning frame. (d) Sealing the slits where ribbon-style flexible printed circuit board mounted inertial measurement units inserted through. (e) The second layer of gelatin formed. (f) The gelatin brain model (skull opened after tests).
Download figure:
Standard image High-resolution image
It took three steps to make the gelatin phantom brain afterwards. (1) Gelatin solution of 4% mass ratio was poured into the lower half of the skull model merely covering the brain IMUs to form the first layer, and was placed in a 4 °C fridge together with the model overnight to allow the gelatin to solidify. (2) After the first layer was solidified, the silicone glue on the aligner frame was cut through by a razor blade so that the frame could be removed carefully without shifting the IMUs. A thin second layer of gelatin was then formed to fill the small holes left on the first layer (figure A1(e)). (3) The two halves of the phantom skull were glued together by silicone glue, a hole was drilled at the forehead, and the same gelatin mixture was poured into the cavity to fill up the skull as the third layer. The formed phantom brain after tests is shown in figure A1(f) with the skull being opened.
Appendix B.: Supplementary tables
The averages and standard deviations (STD) of all the processed data in section 2.3 are recorded in table B1. The averages and STDs of the R2 results from the 18 repeatable tests in section 3.3 are listed in table B2.
Table B1. Average time delays of rotation start points of eye and brain inertial measurement units relative to the reference inertial measurement unit on forehead under three thresholds during vestibulo-ocular chair hit-motion tests on the 3D printed human head phantom (all units in s).
| Threshold | Type | LE | RE | AB | MB | PB |
|---|---|---|---|---|---|---|
| 0.5° | Ave. | 0.0201 | 0.0276 | 0.0293 | 0.0233 | 0.0007 |
| STD | 0.0124 | 0.0174 | 0.0176 | 0.0128 | 0.0005 | |
| 1.0° | Ave. | 0.0203 | 0.0279 | 0.0297 | 0.0233 | 0.0007 |
| STD | 0.0126 | 0.0172 | 0.0175 | 0.0127 | 0.0005 | |
| 1.5° | Ave. | 0.0207 | 0.0286 | 0.0298 | 0.0231 | 0.0004 |
| STD | 0.0126 | 0.0175 | 0.0175 | 0.0126 | 0.0005 |
Table B2. R2 values for 5th order polynomial regression of the data sets in the drop-and-impact experiments on the 3D-printed human head phantom.
| Right eye | AB | 0.573 | 0.208 |
| MB | 0.718 | 0.189 | |
| PB | 0.903 | 0.113 | |
| Left eye | AB | 0.636 | 0.197 |
| MB | 0.837 | 0.156 | |
| PB | 0.973 | 0.045 | |
| Skull | AB | 0.669 | 0.237 |
| MB | 0.269 | 0.166 | |
| PB | 0.278 | 0.134 |