

Abstract
Objective: The individual effects of plasma and red blood cells (RBCs) on the biophysical properties of blood can be monitored by measuring the erythrocyte sedimentation rate (ESR) and RBC deformability simultaneously. However, the previous methods require bulky and expensive facilities (i.e. microscope, high-speed camera, and syringe pump) to deliver blood or capture blood flows. Approach: To resolve these issues, a simple method for sequential measurement of the ESR and RBC deformability is demonstrated by quantifying the cell-free volume (VCF), cell-rich volume (VCR), and blood volume (VB) inside an air-compressed syringe (ACS). A microfluidic device consists of multiple micropillar channels, an inlet, and outlet. After the ACS is filled with air (Vair = 0.4 ml) and a blood sample (VB = 0.6 ml, hematocrit = 30%) sequentially, the ACS is fitted into the inlet. The cavity inside the ACS is compressed to Vcomp = 0.4 ml after closing the outlet with a stopper. A smartphone camera is employed to capture variations in the VCF, VCR, and VB inside the ACS. The ESR index suggested in this study (ESRPM) is obtained by dividing the VCF (t = t1) with an elapse of t1. By removing the stopper, ΔVB (ΔVB = VB [t = t1] − VB) is obtained and fitted as a two-term exponential model ( . As a performance demonstration, the proposed method is employed to detect an ESR-enhanced blood sample, homogeneous hardened blood sample, and heterogeneous blood sample. Main results: From the experimental results, it is found that the proposed method has the ability to detect various bloods by quantifying the ESRPM and two coefficients (a, b) simultaneously. Significance: In conclusion, the present method can be effectively used to measure the ESR and RBC deformability in resource-limited settings.
Export citation and abstract BibTeX RIS
1. Introduction
Cardiovascular diseases (CVDs) are the leading causes of death in advanced countries, and account for 31.3%–32.8% of all deaths in the United States (Benjamin et al 2019). CVDs, including coronary heart disease, stroke, atherosclerosis, and myocardial infarction, occur suddenly without any symptoms or warnings. Because vascular blockage or blood clotting interrupts blood flow in the microcirculation, CVDs contribute to serious complications or unexpected deaths (Kang et al 2018a). However, the biochemical properties of blood, including biomarkers, cholesterol, and glucose, still concern clinical issues for the early detection of CVDs (Wu 2005). Owing to the strong relationship reported between CVDs and the biophysical properties of blood (i.e. the erythrocyte sedimentation rate (ESR), hematocrit, and viscosity), these properties have gained attention for the monitoring of CVDs (Danesh et al 2000, Yayan 2012).
Microcirculation is the circulation of blood through the smallest blood vessels, including capillary networks, arterioles, and venules (Popel et al 2005). It plays a vital role in regulating blood flow in organs and exchanging substances between the blood and peripheral tissues. Because microcirculatory disorders lead to mortality, it is necessary to understand how blood properties and blood flows influence such exchanges in the microcirculation (Popel et al 2005). Blood is a concentrated suspension of formed elements (red blood cells (RBCs), white blood cells, and platelets) and blood plasma. Under physiological conditions, RBCs occupy 40%–50% of blood volume (i.e. hematocrit (Hct) = 40%–50%). White blood cells and platelets occupy ~1/600 and ~1/800 of blood volume, respectively (Popel et al 2005). Owing to the high abundance of RBCs in blood, the biophysical properties of blood are to a large extent determined by those of RBCs (Sebastian et al 2018). Thus, biophysical blood studies focus on RBC-related properties, including the hematocrit, blood viscoelasticity, RBC deformability, and RBC aggregation (Kang 2018a). Owing to its high deformability under blood flow, an individual RBC has the ability to easily pass through microscale capillary vessels. The degree of RBC deformability is determined by several factors, including the membrane cytoskeleton, cytoplasmic viscosity, and surface area/volume ratio (Kang et al 2016a). Hematological disorders, including malaria-infected RBCs, sepsis, and diabetes, cause substantial decreases in RBC deformability (Zheng et al 2013). RBC deformability (Baskurt et al 1998, Shevkoplyas et al 2006, Herricks et al 2009, Zhang et al 2009, Amaiden et al 2012, Beech et al 2012, Guo et al 2012a, Huang et al 2013, Cluitmans et al 2014, Agrawal et al 2016, Guo et al 2016, Kang et al 2016a, Park et al 2016, Zeng et al 2016, Boas et al 2018, Kang 2017a, 2018b) is considered a contributing factor to blood viscosity (Zhang et al 2009, Pop et al 2013, Kim et al 2013, Song et al 2017) and RBC aggregation (Shin et al 2005, Lim et al 2011, Sherwood et al 2012, Yeom et al 2015, Ahn et al 2016, Lee et al 2016, Reinhart et al 2017, Kang et al 2018b). On the contrary, the ESR is observed with the naked eye by quantifying the interface between cells and plasma in the Westergren sedimentation tube (inner diameter = 2.5 mm, length = 200 mm, and blood volume = 5 ml) in 1 h (Bochen et al 2011). Because it is a simple and inexpensive test, the ESR still provides a useful index of nonspecific disease activity in clinical settings (Bochen et al 2011). The kinetics of the ESR consists of three different phases, and follow an S-shaped curve with respect to time (Fabry 1987). Because blood flow is extremely low in the Westergren sedimentation tube, RBCs aggregate and form rouleaux. RBC aggregation accelerates the ESR over time. The ESR is varied by several factors, including the hematocrit, plasma protein level, and surface properties of RBCs. Inflammatory diseases cause an increase in the concentration of acute-phase plasma proteins. The ESR is then enhanced considerably (Ahn et al 2016). Thus, it is required to investigate the individual effects of plasma and RBCs on the biophysical properties of blood. Changes in RBCs and plasma can be effectively monitored by measuring the RBC deformability and ESR simultaneously.
Conventional methods for measuring the ESR and RBC deformability have several disadvantages. The conventional Westergren ESR method shows several drawbacks, including long time measurement (~1 h), bulky instrument, and repetitive cleaning procedure. The conventional RBC deformability methods, such as membrane filters (Odashiro et al 2015) and laser diffractometry (Groner et al 1980), have several disadvantages. Large variations in the pore size of membrane filters are detrimental to repetitive performance. Because laser diffractometry measures the average deformability of RBCs by quantifying a diffraction image of blood flow, it is not effective in discriminating minor differences in subpopulations of RBCs. Microfluidic platforms can provide several advantages, including small volume consumption, disposability, and consistent performance. Thus, to overcome the drawbacks of these conventional methods, several methods have been suggested for measuring the ESR and RBC deformability under a microfluidic platform, as shown in table 1.
Table 1. A summary of microfluidic-based methods for measuring ESR and RBC deformability. O and X denote possible and impossible methods, respectively.
| Measurement methods | Simultaneous measurement | Comments | Ref. | |
|---|---|---|---|---|
| ESR | RBC deformability | |||
| Electric impedance (O) | X | X | – Plastic tube with electrodes | Cha et al (1994) and Zhao et al (1997) |
| – Resistance and capacitance | ||||
| X | X | – PDMS chamber with planar electrode | Zhbanov et al (2015) | |
| – Conductivity | ||||
| Microscopic image (O) | X | X | – Inverted driving syringe pump (continuous) | Kang et al (2014) |
| – Image intensity, and single channel | ||||
| – Malaria-infected RBCs | ||||
| X | X | – Conical pipette tip (blood reservoir) | Kang (2017b) | |
| – Disposable vacuum pump, and pinch valve (on/off) | ||||
| – Image intensity, and single channel | ||||
| X | X | – Upright driving syringe pump (on/off) | Kang (2018c) | |
| – Cell-to-liquid interface in counter-fluid channel | ||||
| – Image intensity, and twin channel | ||||
| – RBC aggregation, and ESR | ||||
| X | X | – Conical pipette tip (blood reservoir) | Kang et al (2018b) | |
| – Syringe pump (on/off) (withdrawal mode) | ||||
| – Image intensity, and multiple parallel channels (n = 4) | ||||
| – RBC aggregation, and ESR | ||||
| X | X | – Vertical microfluidic channel | Chaturvedi et al (2017) | |
| – Setting velocity | ||||
| Photometric method (O) | X | X | – Transmitted light intensity (LED, and photodetector) | Isiksacan et al (2016) |
| – Solenoid pinch valve (on/off) | ||||
| – Disposable polycarbonate cartridge | ||||
| X | Cell blockage (O) | X | – Clogging in single-constriction channel (Shelby et al 2003), capillary networks (Chen et al 2010), and gradual filters with variable pores (Preira et al 2013) | Shelby et al (2003), Chen et al (2010) and Preira et al (2013) |
| – Malaria-infected RBCs (Shelby et al 2003), hardened RBCs (Chen et al 2010), and circulating leukocytes (THP-1, and ARDS) (Preira et al 2013) | ||||
| X | X | – Minimum cylinder diameter in taper channels | Herricks et al (2009) | |
| – Malaria-infected RBCs | ||||
| X | Cell aspiration (O) | X | – Single straight channel | Luo et al (2014) |
| – Young's modulus, and lung tumors | ||||
| X | X | – Multiple funnel-shaped constrictions | Guo et al (2012b) | |
| – Cortical tension, malaria-infected RBCs | ||||
| X | Cell transit (O) | X | – Transit time in capillary networks | Rosenbluth et al (2008) |
| – Sepsis, and leukostasis | ||||
| X | X | – Entry time, and cell deformation | Lange et al (2017) | |
| – Parallel micro-constrictions | ||||
| X | X | – RBC velocity in triangular-shaped pillar channels | Bow et al (2011) | |
| – Malaria-infected RBCs | ||||
| X | X | – Cell-to-liquid interface as pressure sensor | Kang (2018b) | |
| – Disposable air-compressed pump | ||||
| – Multiple pillar channels | ||||
| X | X | – Blood velocity in multiple pillar channels | Kang et al (2016a, 2016b) | |
| – Syringe pump (blood delivery) | ||||
| – RBC deformability and blood viscosity (Kang et al 2016a) | ||||
| – Malaria-infected RBCs (Kang et al 2016a) | ||||
| X | Electric impedance (O) | X | – Single-constriction channel | Du et al (2013), |
| – Malaria-infected RBCs | ||||
Several methods, such as electric impedance, microscopic imaging, and photometry, have been suggested to quantify the ESR. First, electric impedances (resistance, capacitance, and conductivity) have been employed to monitor the ESR inside a plastic tube (Cha et al 1994, Zhao et al 1997) or polydimethylsiloxane (PDMS) chamber (Zhbanov et al 2015). Second, while turning a driving syringe upside down in the gravitational direction (Kang et al 2014), blood is delivered from the top layer of the syringe into the microfluidic device. The ESR is then monitored by quantifying the image intensity of continuous blood flow in the microfluidic channel. To simultaneously measure the RBC aggregation and ESR in a twin channel, blood is supplied from the button layer of an upright driving syringe into a microfluidic device by turning off the syringe pump periodically. The ESR and RBC aggregation are measured periodically by quantifying the cell-to-liquid interface in the counter-fluid channel and the image intensity of blood flow in the blood channel, respectively (Kang 2018c). To remove the highly expensive and bulky syringe pump, a disposable air-suction pump and a pinch valve (PV) have been suggested to deliver and stop blood from a conical pipette tip to a microfluidic device (Kang 2017b). To measure multiple values of the ESR in a single experiment, blood is supplied from the conical pipette tip into parallel microfluidic channels (i.e. n = 4) by turning a syringe pump on and off periodically (Kang et al 2018b). Four values of the ESR are obtained periodically by analyzing the image intensity of blood. While setting a microfluidic channel vertically in the gravitational direction, the ESR is then obtained by measuring the settling velocity of RBCs in the microfluidic channel (Chaturvedi et al 2017). Third, after a disposable cartridge is filled with blood, RBCs aggregate or disaggregate by turning a solenoid PV on or off. An infrared emitting diode is used to illuminate the blood in the cartridge. The transmitted light through the cartridge is measured by using a photodetector. The ESR is then obtained by quantifying the temporal variations in the transmitted signals (Isiksacan et al 2016).
Based on microfluidic platforms, several methods such as cell blockage, cell aspiration, cell transit, and electric impedance have been suggested to measure the deformability of individual RBCs. First, clogging in a single-constriction channel (Shelby et al 2003), capillary network (Chen et al 2010), and gradual filter with variable pores have been employed to quantify the deformability of malaria-infected RBCs (Shelby et al 2003), hardened RBCs (Chen et al 2010, Preira et al 2013), and circulating leukocytes (i.e. THP-1 and acute respiratory distress syndrome (ARDS)) (Preira et al 2013). The minimum cylinder diameter of cells trapped in parallel taper channels is calculated to discriminate the difference between the deformability of normal RBCs and malaria-infected RBCs (Herricks et al 2009). Second, to detect lung tumor or malaria-infected RBCs, the Young's modulus or cortical tension is quantified by suctioning a single cell into single-constriction (Luo et al 2014) or multiple-funnel channels (Guo et al 2012b), Third, by supplying single cells into capillary networks (Rosenbluth et al 2008) or parallel micro-constrictions (Lange et al 2017), the transit time of each cell is employed to detect sepsis or leukostasis. While delivering individual RBCs into triangular pillar channels, the RBC velocity is quantified to detect malaria-infected RBCs. Even though single cell-based deformability gives high sensitivity, the throughput remains a critical issue. To improve the throughput, blood (Hct = 50%) is supplied into multiple micropillar channels by using a syringe pump. The RBC deformability is then quantified by analyzing the average blood velocity obtained by conducting a micro-particle image velocimetry (PIV) technique. Furthermore, a disposable air-compressor pump is employed to supply blood into multiple micropillar channels. Without operating a syringe pump and conducting a micro-PIV technique, the RBC deformability is obtained by analyzing the cell-to-liquid interface with a pressure sensor. Finally, while supplying individual RBCs into a constriction channel, the RBC deformability is obtained by analyzing variations in the electric impedance (i.e. magnitude, and phase) with time (Zheng et al 2012, Du et al 2013). As summarized in table 1, most of the previous methods did not have the ability to measure the ESR and RBC deformability simultaneously. In addition, bulky equipment, including a syringe pump, microscope, and high-speed camera, are essential for delivering blood or capturing microscopic images of blood flows. Owing to the required equipment, most methods are demonstrated appropriately in laboratory environments, rather than in resource-limited settings. To resolve these issues, a new method should be devised for blood delivery and image acquisition. In addition, the ESR and RBC aggregation should be measured to investigate the individual effects of RBCs and plasma from a biomechanical perspective.
In this study, a simple method for the sequential measurement of the ESR and RBC deformability is newly proposed by quantifying the cell-free volume (VCF), cell-rich volume (VCR), and blood volume (VB) in an air-compression syringe (ACS). To demonstrate the proposed method, a microfluidic device composed of a multiple micropillar channel, an inlet, and an outlet is developed. The ACS is composed of a disposable syringe, fixture, and plastic needle.
The present method could be demonstrated outside the laboratory (i.e. resource-limited environment). It does not require bulky and expensive facilities (i.e. microscope, high-speed camera, and syringe pump). In other words, a blood sample can be delivered into the microfluidic device from a single ACS unit. To quantify the ESR and RBC deformability, a smartphone camera is employed to capture variations in the blood sample inside the ACS. By monitoring the captured images stored in the smartphone, three parameters (i.e. VCF, VCR, and VB existing inside the ACS) are quantified at a specific interval of time. After analyzing temporal variations of the three parameters, two representative indices (i.e. the ESR and RBC deformability) were quantified simultaneously. In other words, variations in the VCF are obtained with respect to time (t = t1) until the VCR is decreased to VCR = 0.2 ml. The ESR index (i.e. ESRPM) is then obtained by dividing the VCF (t = t1) by the elapsed time t1. Here, the proposed method is abbreviated to PM. Thereafter, the stopper inserted into the outlet is immediately removed. Blood flows in the microfluidic channel from the ACS. The ΔVB increases gradually with time. Regression coefficients of a two-term exponential model are employed to quantify the RBC deformability.
As a performance demonstration, first, the changes in the ESR and RBC deformability are quantified by varying several factors (air-compression volume (Vcomp) and blood hematocrit (Hct)). Second, to enhance the ESR of the blood sample, various blood samples are prepared by adding normal RBCs into specific concentrations of dextran. Third, the proposed method is employed to detect a hardened blood sample composed of homogeneous hardened RBCs. Finally, the proposed method is used to detect a heterogeneous blood sample composed of a normal blood sample and hardened blood sample. Microscopic imaging-based methodology suggested in previous studies (Kang 2018a, 2019) is adopted to quantitatively compare with the proposed method.
2. Materials and methods
2.1. Blood sample preparation
In accordance with the ethics committee of Chosun University Hospital (CUH), all the experiments were performed while ensuring that the procedures were appropriate and humane. Concentrated RBCs and fresh frozen plasma (FFP) were purchased from the Gwangju-Chonnam blood bank (Gwangju, Korea), and were stored at 4 °C and −20 °C, respectively. Blood was prepared by adding concentrated RBCs into phosphate-buffered saline (PBS) solution (1×, pH 7.4, Gibco, Life Technologies, Korea). Using a centrifugal separator, pure RBCs were collected by removing the buffer layer and PBS. The washing procedure was conducted three times for all blood samples. After the FFP thawed at room temperature, a syringe filter of mesh size 5 µm (Minisart, Sartorius, Germany) was applied to remove debris included in the plasma. Several suspended bloods were prepared by adding normal RBCs into base solutions (i.e. PBS, plasma, and dextran solution).
First, to evaluate the effect of the hematocrit on the ESR and RBC deformability, the hematocrit (Hct) was adjusted to Hct = 20%, 30%, 40%, and 50% by adding normal RBCs into a dextran solution of specific concentration (15 mg ml−1). Second, to stimulate the ESR of blood, four different concentrations of dextran solution (Cdex = 5, 10, 15, and 20 mg ml−1) were prepared by mixing dextran (Leuconostoc spp., MW = 450–650 kDa, Sigma-Aldrich, USA) with PBS solution. Subsequently, bloods (Hct = 30%) were prepared by adding normal RBCs to dextran solutions of specific concentrations. As a control, normal blood (Hct = 30%) was prepared by adding normal RBCs into plasma. Third, to vary the RBC deformability, four different concentrations of glutaraldehyde (GA) solution (CGA = 2, 4, 6, and 8 µl ml−1) were diluted by mixing GA solution (Grade II, 25% in H20, Sigma-Aldrich, USA) into PBS solution. Homogeneous hardened RBCs were prepared by exposing normal RBCs to each concentration of GA solution for 10 min. Hardened bloods (Hct = 30%) were then prepared by adding hardened RBCs into PBS solution. Because the PBS solution did not induce the ESR inside the ACS, hardened blood was only prepared to evaluate variations in the RBC deformability. To detect minor hardened RBCs in heterogeneous RBCs, heterogeneous blood was prepared by adding hardened blood to normal blood. For convenience, to reduce the duration of the ESR substantially, the hematocrit was reduced. Plasma was replaced with a dextran solution of a specific concentration (15 mg ml−1). In other words, normal blood was adjusted to Hct = 30% by adding normal RBCs into a dextran solution of a specific concentration (i.e. VNB). Hardened blood was prepared by adding RBCs fixed by GA solution (8 µl ml−1) into PBS solution (VHB). The mixing ratio (φ) was defined as the ratio of the hardened blood volume (VHD) to the total blood volume (VHB + VNB) (i.e.  . Various mixing ratios (φ = 0, 5%, 10%, 20%, and 100%) were obtained by adding hardened blood to normal blood. Here, φ = 0 and φ = 100% denote pure normal blood and pure hardened blood, respectively.
2.2. Fabrication of microfluidic device and experimental procedure
The fabricated microfluidic device for sequentially measuring the RBC deformability and ESR consisted of an inlet, an outlet, and multiple micropillar channels, as shown in figure 1(A(a)). The straight channel (width = 250 µm) was connected to the micropillar channels from the inlet and outlet. As shown in figures 1(A(b)) and S1 (supplementary materials), the micropillar channels were composed of multiple narrow channels (N = 43, gap = 4 µm, and channel length = 50 µm). The channel depth of the microfluidic device was fixed at 10 µm. Conventional micro-electromechanical-system fabrication techniques, such as photolithography and deep reactive iron etching (RIE) were employed to fabricate a silicon-master mold. PDMS (Sylgard 184, Dow Corning, Midland, MI, USA) was mixed with a curing agent at a ratio of 10:1. The PDMS mixture was poured into the mold. Air bubbles in the PDMS were removed completely by operating a vacuum pump for 1 h. After curing the PDMS mixture in a convective oven at 70 °C for 1 h, the PDMS block was peeled off from the mold and was cut with a razor blade. An inlet and outlet were punched with a biopsy punch (outer diameter = 1.0 mm). After the surfaces of the PDMS block and a glass slide were treated with an oxygen plasma system (CUTE-MPR, Femto Science Co. South Korea), the microfluidic device was finally prepared by bonding the PDMS block onto the glass slide.

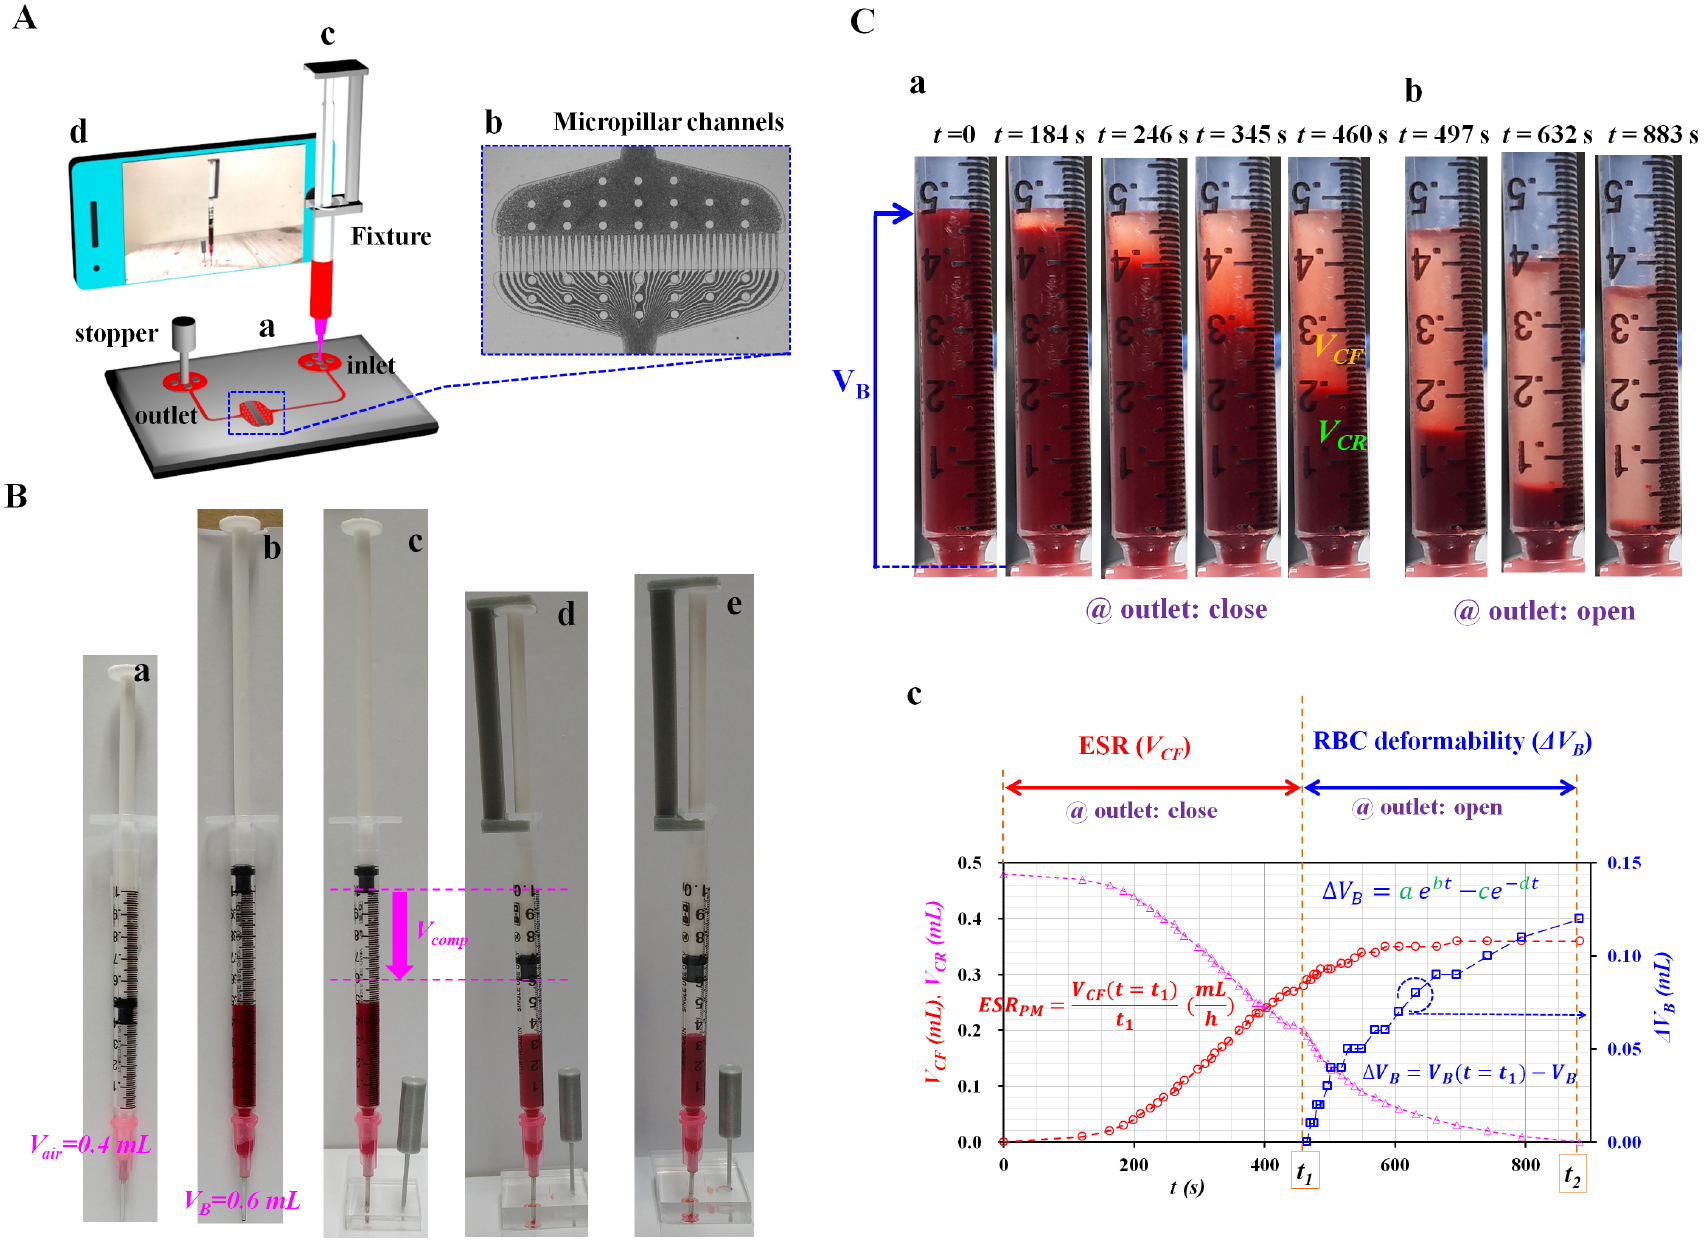
Figure 1. The proposed method for simultaneous measurement of the ESR and RBC deformability. (A) A schematic diagram of the proposed method, including an ACS, microfluidic device, and smartphone camera. The ACS was tightly fitted into the inlet of the microfluidic device. (a) The microfluidic device consisting of one inlet, one outlet, and multiple micropillar channels. (b) Multiple micropillar channels (N = 43, gap = 4 µm, length = 50 µm, and depth = 10 µm). (c) The ACS was composed of a disposable syringe (~1 ml), fixture, and plastic needle. (d) A smartphone camera was employed to capture the VB, VCR, and VCF inside the ACS at intervals of 5 s. (B) The operation of the ACS. (a) Air suction (~0.4 ml). (b) Blood suction (~0.6 ml). (c) The ACS was tightly fitted into the inlet. Then, the stopper was inserted into the outlet. (d) The air cavity inside the ACS was compressed to 0.4 ml. (e) Variations in the VCF and VB inside the ACS were quantified by analyzing the snapshot images. (C) As a preliminary demonstration, the ACS was partially filled with blood (Hct = 30%, normal RBCs in dextran solution (15 mg ml−1)) and air. (a) Sequential snapshot images captured at a specific time (t) (t = 0, 184, 246, 345, 460 s) by closing the outlet. (b) Sequential snapshot images captured at a specific time (t) (t = 497, 632, and 883 s) by opening the outlet. (c) Temporal variations in the VCF, VCR, and ΔVB obtained by closing and opening the outlet, respectively. First, after closing the outlet, the variations in the VCF were obtained for a specific duration (t = t1) until the VCF decreased to 0.2 ml. The ESR index (i.e. ESRPM) was then quantified by dividing the VCF (t = t1) by the duration (t = t1) (i.e. ESRPM = VCF ([t = t1]/t1). Second, after opening the outlet, the variations in the VB (i.e. ΔVB = VB (t = t1) − VB) were monitored continuously over a specific time. Based on a two-term exponential model (i.e.  ), the four coefficients (a, b, c, d) were employed to detect variations in the RBC deformability.
Download figure:
Standard image High-resolution imageAs shown in figure 1(A(c)), to remove the bulky syringe pump, an ACS partially filled with air and blood was prepared by assembling a disposable syringe (~1 ml), fixture, and plastic needle (PN18G-1/2, ESR Co., Korea). As shown in figure S2(A) (supplementary materials (stacks.iop.org/PM/41/025009/mmedia)), the dimensions of the fixture were determined to fix the plunger in the syringe securely. The fixture was then fabricated by using a 3D printer (Ultimaker 2+, Ultimaker B.V., Netherlands). The needle of the ACS was tightly fitted to the inlet of the microfluidic device. Owing to air compression inside the ACS, blood was supplied to the microfluidic device from the ACS. To stop or run blood flows in the microfluidic channel, a stopper was tightly fitted into the outlet or removed from the outlet. As shown in figure S2(B) (supplementary materials), the stopper was fabricated by using a 3D printer.
To remove air bubbles in the channels and avoid nonspecific binding of plasma proteins to the inner surface of the channels, the channels were manually filled with bovine serum albumin (BSA) solution of 2 mg ml−1 through the outlet with a disposable syringe. After the elapse of 5 min, a stopper was tightly fitted into the outlet and the plastic needle of the ACS was inserted into the inlet of the microfluidic device. When the cell-rich volume inside the ACS was reduced to a specific value of VCR = 0.2 ml, the stopper inserted into the outlet was removed and blood flowed into the microfluidic channel from the ACS. The VB inside the ACS decreased gradually with time.
As shown in figure 1(A(d)), an Open-Camera application installed in a smartphone camera (Galaxy A5, Samsung, Korea) was employed to capture snapshot images of the ACS over time. The snapshot images were sequentially captured at intervals of 5 s, for a specific duration. The variations in VB, VCF, and VCR were then quantified from the images. All the experiments were conducted at a room temperature of 25 °C.
2.3. Operation of ACS
As shown in figure 1(B), the ACS was suggested for delivering blood into a microfluidic device. The operation of the ACS was divided into five stages. First, air (~0.4 ml) was secured by moving the plunger backward (figure 1(B(a))). Second, blood (~0.6 ml) was suctioned by moving the plunger backward (figure 1(B(b))). Third, to close the outlet of the microfluidic device, the stopper was tightly fitted into the outlet (figure 1(B(c))). Fourth, by securing the end of the plunger and syringe with the fixture, the air cavity inside the ACS was compressed to a specific value of Vcomp (i.e. Vcomp = 0.2, 0.3, and 0.4 ml) (figure 1(B(d))). Finally, a smartphone camera was employed to capture snapshot images (figure 1(B(e))). When the VCR had decreased to 0.2 ml, the outlet was closed. The variations in VCF and VCR were monitored over time. After removing the stopper from the outlet, snapshot images were captured sequentially for a specific duration. The temporal variations in VB were then obtained from the snapshot images.
2.4. Quantification of ESR and RBC deformability in the proposed method
As a preliminary study, suspended blood (Hct = 30%) was prepared by adding normal RBCs to a dextran solution of a specific concentration (Cdex = 15 mg ml−1). The ACS was partially filled with blood and air. The air inside the ACS was compressed to 0.4 ml. Figure 1(C(a)) shows snapshot images captured at specific time (t) (t = 0, 184, 246, 345, and 460 s) by closing the outlet. As time elapsed, the ESR caused VCF to increase and VCR to decrease. On the contrary, by removing the stopper from the outlet, blood was supplied to the microfluidic device from the ACS. Figure 1(C(b)) illustrates snapshot images captured at specific time (t) (t = 497, 632, and 883 s) by opening the outlet. The VB inside the ACS decreased over time. The VCR also decreased with time. In other words, by inserting the stopper into the outlet, the ESR was evaluated by inspecting the VCF in the ACS. Next, by removing the stopper from the outlet, the RBC deformability was quantified by monitoring the variation in the blood volume (ΔVB) in the ACS.
As shown in figure 1(C(c)), from inspection of the captured snapshot images, the variations in VB, VCF, and VCR were obtained with respect to time. The ESR and RBC deformability were then quantified by analyzing the temporal variations in the VCF and VB. First, by closing the outlet, the variations in the VCF were obtained for a specific duration (t = t1) until the VCR had decreased to 0.2 ml. The ESR index proposed in this study (i.e. ESRPM) was then quantified by dividing the VCF (t = t1) by the duration (t = t1) (i.e. ESRPM = VCF [t = t1]/t1). Second, by opening the outlet, the ΔVB (i.e. ΔVB = VB [t = t1] − VB) was monitored as time passed. Owing to the ESR of the blood sample, the VCF increased continuously with time. For this reason, instead of the VCF or VCR, the ΔVB was employed to detect changes in the RBC deformability. To fit the ΔVB with respect to time, a two-term exponential model (i.e.  ) was newly proposed. The fitting model consisted of an increasing exponential term and a decreasing exponential term. The coefficients (a) and (b) in the rising exponential term denote the amplitude and variation rate, respectively. In addition, the coefficients (c) and (d) in the decreasing exponential term represent the amplitude and variation rate, respectively. By conducting a regression analysis with a commercial software package (MATLAB, version R2019, MathWorks, USA), the four regression coefficients (a)–(d) were obtained and employed to detect changes in the RBC deformability.
2.5. Quantification of blood velocity and image intensity in microscopic imaging approach
A previous method with the ability to measure the RBC aggregation (Kang et al 2018b, Kang 2018c, 2018d, 2018e, 2019) or RBC deformability (Kang 2018a, 2018b) using microscopic image-based analysis was employed to evaluate the performance of the proposed method. As shown in figure S3(A) (supplementary material), the experimental setup consisted of an ACS, a microfluidic device, and an image acquisition system. Unlike the previous method that used a syringe pump (Kang 2018a, 2018c, 2018d, 2018e), the ACS was employed to deliver the blood sample into a microfluidic device. The ends of a polyethylene tube (L1, inner diameter = 500 µm and length = 300 mm) were connected to the needle of the ACS and the inlet of the microfluidic device. The other tube (L2, inner diameter = 500 µm and length = 200 mm) was connected to the outlet of the microfluidic device. Because the method required sequential microscopic images of blood flows, the microfluidic device was positioned on an optical microscope (BX51, Olympus, Japan) equipped with a 4× objective lens (NA = 0.1). A high-speed camera (FASTCAM MINI, Photron, USA) captured microscopic images of blood flows. The camera had a spatial resolution of 1280 × 1000 pixels, where each pixel corresponded to 10 µm. With a function generator (WF1944B, NF Corporation, Japan), a pulse signal of period 1 s triggered the high-speed camera. Microscopic images were then sequentially captured at a frame rate of 5 kHz. To quantify the RBC aggregation in the microfluidic channel, the image intensity of the blood flows ( ) was averaged by analyzing the RBCs distributed within a region of interest (ROI) (300 × 810 pixels) within the multiple micropillar channels, as shown in figure S3(B) (supplementary material). To quantify the blood velocity influenced by the RBC deformability, a specific ROI (110 × 80 pixels) was selected appropriately within the downstream of the micropillar channels. The velocity fields of blood flows were obtained by conducting a time-resolved micro-PIV technique. The size of the interrogation window was 16 × 16 pixels. The window overlap was 50%. The obtained velocity fields were validated with a median filter. The averaged blood velocity (
 ) was then calculated by conducting an arithmetic average of the blood velocity fields over the ROI.
2.6. Statistical analysis
The statistical significance was evaluated by conducting statistical analyses with a commercial software package (SPSS Statistics version 24, IBM Co., USA). An analysis of variance (ANOVA) test was used to verify significant differences between comparative results quantitatively. If the P-value was less than 0.05 (i.e. P-value < 0.05), the results exhibited significant differences within a 95% confidence interval.
3. Results and discussion
3.1. Effect of air-compression volume and hematocrit on ESR and RBC deformability measurement
Before testing the performance of the proposed method, it is necessary to evaluate the effect of several factors (i.e. Vcomp, Hct) on the ESR and RBC deformability. Here, to reduce the duration of the ESR test substantially, a specific concentration of dextran solution (15 mg ml−1) was employed as a suspension solution, rather than plasma.
First, the effect of the Vcomp on the ESR and RBC deformability was quantified by varying the Vcomp (Vcomp = 0.2, 0.3, and 0.4 ml). A blood sample with Hct = 30% was prepared by adding normal RBCs into the specific dextran solution. Figure 2(A) shows the temporal variations in the VCF and ΔVB with respect to the Vcomp. The higher value of the Vcomp caused the VCF to reduce substantially compared with the lower value of the Vcomp. By setting the Vcomp as 0.2 ml, the VCF increased to 0.3 ml after an elapsed time of approximately 1046 s. However, by increasing the Vcomp from 0.2 to 0.4 ml, the VCF increased to 0.28 ml after an elapsed time of 460 s. On the contrary, because the Vcomp caused the air pressure inside the ACS to increase, blood flowed faster at a higher value of Vcomp. In other words, at the higher value of Vcomp = 0.4 ml, the ΔVB increased to 0.2 ml in a shorter time. However, at the lower value of Vcomp = 0.2 ml, the ΔVB did not increase to 0.2 ml, owing to the lower air pressure inside the ACS. Figure 2(B) shows variations in the ESRPM with respect to the Vcomp. At the lower value of Vcomp = 0.2 ml, it took a longer time for the VCF to increase to 0.3 ml in comparison with the higher value of the Vcomp. By referring to the definition of the ESRPM (i.e. ESRPM = VCF [t = t1]/t1), the higher value of the Vcomp contributed to the increased ESRPM. According to the statistical analysis, the ESRPM was increased significantly with respect to the Vcomp (i.e. P-value = 0.001). At the blood-air interface, the surface tension hindered the RBCs' sedimentation inside the ACS. When increasing the Vcomp range from Vcomp = 0.2 ml to Vcomp = 0.4, the pressure inside the ACS tended to increase substantially. The pressure reduced the contribution of the surface tension to the ESR. From the results, it was found that the ESR was accelerated significantly with the increasing Vcomp. Based on the temporal variations in ΔVB, the change in ΔVB was best fitted by using the two-term exponential model (i.e.  . Figure 2(C(a)) shows variations in the coefficients (a) and (c) with respect to the Vcomp. From the statistical analysis, the coefficient (a) showed significant variations with respect to the Vcomp (i.e. P-value = 0.071). However, the coefficient (c) remained constant with respect to the Vcomp (i.e. P-value = 0.938). This result indicates that the coefficient (a) in the rising exponential term (i.e.
 ) varied considerably with respect to the Vcomp when compared with the coefficient (c) in the decreasing exponential term (i.e.
  ). Figure 2(C(b)) shows variations in the coefficients (b) and (d) with respect to the Vcomp. From the statistical analysis, the coefficients (b) and (d) of the variation rate in the exponential terms remained constant with respect to the Vcomp (i.e. P-value = 0.435–0.955). From the experimental results, the Vcomp caused the ESR and the coefficient (a) in the rising exponential term to vary. For consistent measurement of the ESR and RBC deformability, the Vcomp was fixed as Vcomp = 0.4 ml for all of the experiments. In other words, as Vcomp = 0.4 ml showed the maximum value of ESRPM, it was selected carefully to reduce the elapsed time for measurement of the ESR considerably.
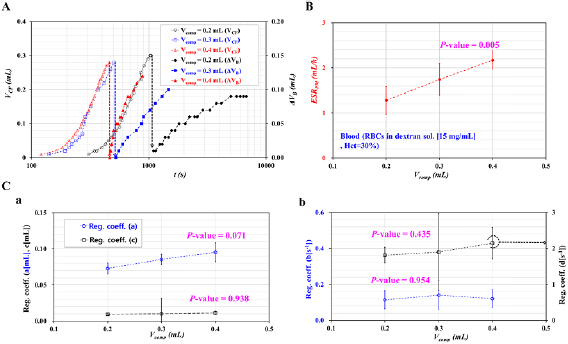
Figure 2. Quantitative evaluations of the effect of Vcomp on the ESRPM for the ESR and the regression coefficients for RBC deformability. Blood (Hct = 30%) was prepared by adding normal RBCs to a specific concentration of a dextran solution (15 mg ml−1). (A) Temporal variations in the VCF and ΔVB with respect to Vcomp = 0.2, 0.3, and 0.4 ml. (B) Variations in the ESRPM with respect to the Vcomp. (C) Variations of coefficients in the two-term exponential model (i.e.  ) with respect to the Vcomp. (a) Variations of coefficients (a, c) with respect to the Vcomp. (b) Variations of coefficients (b) and (d) with respect to the Vcomp.
Download figure:
Standard image High-resolution imageSecond, according to previous studies, a higher value of hematocrit contributed to a significant decrease in the ESR (Kang et al 2014, 2018b, Kang 2018c, 2017b]. In addition, the blood flow decreased at a higher value of the hematocrit, because the fluidic resistance was increased substantially by the hematocrit. When the RBC deformability was quantified by evaluating the blood flows through narrow channels (Kang et al 2016a, 2016b, Kang 2017a, 2018a, 2018b), it was necessary to verify the effect of the hematocrit on the RBC deformability. For these reasons, the effect of the hematocrit on the ESR and RBC deformability was quantified by varying the hematocrit. The hematocrit was adjusted to Hct = 30%, 40%, and 50% by adding normal RBCs into the dextran solution. Figure 3(A) shows temporal variations in the VCF and ΔVB with respect to the Hct. When the outlet was closed, the VCF was increased substantially at the lower value of the hematocrit. When the outlet was opened, the ΔVB was increased considerably at the lower value of the hematocrit. Figure 3(B) shows variations in the ESRPM with respect to the Hct. From the statistical analysis, the ESRPM was decreased significantly by increasing the hematocrit (i.e. P-value = 0.027). Figures 3(C(a)) and (C(b)) show variations in the regression coefficients (a)–(d) in the two-term exponential model with respect to the Hct. From the statistical analysis, the coefficient (a) in the rising exponential term was increased significantly with respect to the Hct (i.e. P-value = 0.02). Except for the coefficient (a), the other three coefficients (b)–(d) remained constant with respect to the hematocrit. This result indicated that the amplitude in the rising exponential term (i.e. the coefficient (a)) had a strong relation to the hematocrit. From the results, to decrease the experimental time of the ESR and RBC deformability, a lower hematocrit was preferable. The hematocrit was then fixed as Hct = 30% for all the experiments.
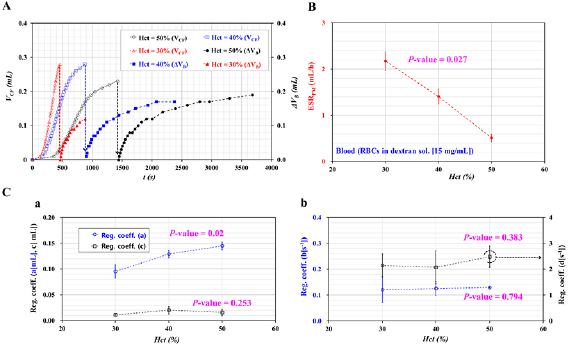
Figure 3. Quantitative evaluations of the effect of Hct on the ESRPM for the ESR and the regression coefficients for RBC deformability. The Vcomp in the ACS was fixed at 0.4 ml. The hematocrit of blood was adjusted to Hct = 30%, 40%, and 50% by adding normal RBCs to a specific concentration of dextran solution (15 mg ml−1). (A) Temporal variations in the VCF and ΔVB with respect to the Hct. (B) Variations in the ESRPM with respect to the Hct. (C) Variations in regression coefficients in the two-term exponential model (i.e.  ) with respect to the Hct. (a) Variations in coefficients (a, c) with respect to the Hct. (b) Variations in coefficients (b, d) with respect to the Hct.
Download figure:
Standard image High-resolution image3.2. Quantitative measurement of ESR and RBC deformability of dextran-included blood sample
As the proposed method had the ability to measure the ESR and RBC deformability simultaneously, it was necessary to verify each function (i.e. ESR and RBC deformability) independently. According to previous studies (Sherwood et al 2012, Kang et al 2018b, 2018e, Kang 2019), dextran solutions were widely employed to vary the degree of the ESR or RBC aggregation. In other words, to stimulate the ESR of bloods, dextran solutions of various concentrations (Cdex = 5, 10, 15, and 20 mg ml−1) that were diluted with PBS solution were prepared. The control (Cdex = 0) indicated plasma. Individual blood (Hct = 30%) was then prepared by adding normal RBCs into a dextran solution of a specific concentration. Figure 4(A(a)) shows the temporal variations in the VCF and ΔVB with respect to the Cdex. When compared with the control, the dextran solution contributed to the decrease in the elapsed time of the ESR significantly. In addition, the ΔVB was decreased substantially at higher dextran solution concentrations. Figure 3(A(b)) shows variations in the ESRPM and the coefficient (a) in the rising exponential term with respect to the Cdex. From the statistical analysis, the ESRPM was increased considerably with respect to the Cdex. When compared with the previous results (Kang et al 2014, 2018b), the proposed method gave consistent variations with respect to the dextran solution concentration. On the contrary, by conducting a regression analysis for each ΔVB with respect to time, the four regression coefficients (a)–(d) in the two-term exponential model were obtained, as shown in figure S3 (supplementary material). From the statistical analysis, the regression coefficient (a) in the rising exponential term showed a statistically significant decrease with respect to the Cdex (i.e. P-value = 0.001). In addition, the regression coefficient (b) in the rising exponential term showed a statistically insignificant increase with respect to the Cdex (i.e. P-value = 0.082). However, the remaining two coefficients (c, d) in the decreasing exponential term remained constant with respect to the Cdex (i.e. P-value = 0.17 for the coefficient (c) and 0.559 for the coefficient (d)). From these results, the amplitude in the rising exponential term only showed a strong relation to ΔVB.

Figure 4. Quantitative evaluation of the ESR and RBC deformability of dextran-included blood. To vary the ESR considerably, blood (Hct = 30%) was prepared by adding normal RBCs into specific concentrations of dextran solution (Cdex = 5, 10, 15, and 20 mg ml−1). (A) Quantitative evaluation of the ESR and RBC deformability obtained by applying the proposed method. (a) Temporal variations in the VCF and ΔVB with respect to the Cdex. (b) Variations in the ESRPM and coefficient (a) in the rising exponential term with respect to the Cdex. (B) Quantification of the ESR (AIMI) and RBC deformability (DIMI) obtained using a microscopic image approach as in the previous method. (C) Quantitative comparison between the proposed method and previous method. (a) The linear relationship between the ESRPM and AIMI. (b) The linear relationship between the regression coefficient (a) in the rising exponential term and DIMI.
Download figure:
Standard image High-resolution imageAs shown in figure S3(A) (supplementary material), the microscopic imaging approach reported in previous studies was employed for comparison with the performance of the proposed method. Initially, by removing the PV that clamped the tube (L1), blood was supplied to the microfluidic channel for 30 s. After this, the middle position of the tube (L1) was clamped with the PV for 5 min. The blood flow stopped immediately. Under blood stasis, the RBC aggregation index (i.e. AIMI) was quantified by analyzing the image intensity of the blood. Figure S3(C) (supplementary material) shows temporal variations in  with respect to the Cdex = 0, 5, 10, 15, and 20 mg ml−1. Here, Cdex = 0 denoted plasma. Below Cdex = 5 mg ml−1, the dextran solution did not contribute to varying Δ
 . Above Cdex = 5 mg ml−1, the ΔI was increased substantially at the higher concentrations of the dextran solution. The AIMI was then calculated by averaging Δ
 (i.e. Δ
 = <I (t) > −<I (t = 0)>) for 300 s (i.e. AIMI =
  . By removing the PV, the blood flowed continuously for 10 min. Figure S3(D) (supplementary material) shows temporal variations in
  with respect to the Cdex. Above Cdex = 5 mg ml−1,
  was decreased significantly. The RBC deformability index (i.e. DIMI) was then quantified by integrating the average blood velocity from t = 300 s to t = 900 s (i.e. DIMI = Ac x
  ). Here, Ac denotes the cross-sectional area of a rectangular channel (i.e. Ac = w × h, w = 250 µm, and h = 10 µm). As shown in figure 4(B), variations in AIMI and DIMI obtained by the microscopic imaging approach were obtained by varying the Cdex. From the results, the dextran solution contributed to the increase in the AIMI substantially (i.e. P-value = 0.001). Because the dextran solution contributed to the increase in the blood viscosity, the blood velocity decreased at higher dextran solution concentrations (Kang 2018d, 2018e). Therefore, the DIMI was decreased significantly above Cdex = 5 mg ml−1 (i.e. P-value = 0.001).
The variations in the ESR (or RBC aggregation) or RBC deformability obtained by using both methods (the proposed method and the previous method) for dextran-included bloods are overlapped in an X–Y plot. Figure 4(C(a)) shows the relationship between the ESRPM and AIMI, which are strongly correlated (i.e. R2 = 0.9199 and P-value = 0.01). The results indicate that the ESRPM can be used effectively for measuring the ESR of blood. Figure 4(C(b)) shows the relationship between the regression coefficient (a) and DIMI. The indices had a significant linear relationship (i.e. R2 = 0.9076 and P-value = 0.013). From the result, the coefficient (a) in the rising exponential term can be effectively employed to quantify the change in the RBC deformability. According to a previous measurement of viscoelasticity (Kang 2016), the blood elasticity remained constant with respect to the concentration of the dextran solution. Because the blood elasticity is strongly related to the RBC deformability, the previous result indicated that the RBC deformability remained constant within the specific concentrations of the dextran solution. However, the blood viscosity increased significantly at higher concentrations of dextran solution. In other words, the DIMI of dextran-included blood was changed substantially by the blood viscosity, rather than the blood elasticity. By referring to the results obtained by the present method, the coefficient (a) decreased considerably with respect to the Cdex. However, the coefficient (b) was increased slightly with respect to the Cdex. Thus, it was inferred that both deformability indices (i.e. the coefficient (a) and DIMI) were changed considerably by the blood viscosity. RBCs with poor deformability contributed to the increase in the blood viscosity. Furthermore, it was inferred that the coefficient (b) in the rising exponential term might be increased by the degree of the RBC deformability. From the experimental results, the proposed method had the ability to measure the ESR and RBC deformability of dextran-included blood with sufficient consistency. As shown in figures 2 and 3, the ESR and deformability varied linearly with respect to the Hct or Vcomp. From the results, it was estimated that the proposed method could provide consistent results for a blood sample with Hct = 40% or 50%, or Vcomp = 0.2 or 0.3 ml.
3.3. Quantitative measurement of RBC deformability of homogeneous hardened blood
Homogeneous hardened blood was employed to evaluate the physical representation of the regression coefficients (a) and (b) in the two-term exponential model. In other words, to remove the effect of the RBC aggregation completely, PBS solution was added to each blood sample instead of plasma or dextran solution. Normal RBCs were chemically fixed using GA solution. The normal RBCs were dipped into specific concentrations of GA solution (CGA = 2, 4, 6, and 8 µl ml−1), which were diluted with PBS solution. Then, homogeneous hardened blood (Hct = 30%) was prepared by adding RBCs fixed by the same concentration of GA solution to the PBS solution. As a control, normal RBCs were added to PBS solution (CGA = 0). Because the PBS solution did not include plasma proteins, each hardened blood did not contribute to induction of the ESR. In each experiment, after the air compression inside the ACS, the VCF was monitored for 200 s. The result confirmed that there was negligible variation in the VCF for each blood sample. Based on these results, the ESR measurement was not conducted for homogeneous hardened blood. Thereafter, when removing the stopper from the outlet, the blood inside the ACS was supplied to the microfluidic device immediately. As time passed, the ΔVB varied by the degree of the RBC deformability. Temporal variations in the ΔVB were then employed to understand the regression coefficients in the two-term exponential model. Figure 5(A(a)) shows temporal variations in the ΔVB with respect to the CGA. From the results, the ΔVB was increased considerably at lower concentrations of GA solution. After an elapse of 400 s, the ΔVB was saturated at ΔVB = 0.14 ml for CGA = 6 µl ml−1 and ΔVB = 0.1 ml for CGA = 8 µl ml−1. The results indicated that normal RBCs easily passed through the micropillar channels when compared with chemically fixed RBCs. Because blood composed of RBCs fixed by CGA = 6–8 µl ml−1 did not pass through the micropillar channels at all, the ΔVB remained constant after 400 s. Four regression coefficients (a)–(d) were obtained by best-fitting the ΔVB with the two-term exponential model. As shown in figures S5(A) and (B) (supplementary material), the four regression coefficients were obtained with respect to the CGA. The coefficients (c) and (d) in the decreasing exponential term remained constant with respect to the CGA (i.e. P-value = 0.313 for the coefficient (c) and P-value = 0.7 for the coefficient (d)). As shown in figure 5(A(b)), the coefficient (a) in the rising exponential term was decreased slightly with respect to the CGA (i.e. P-value = 0.111). The coefficient (b) in the rising exponential term was decreased substantially with respect to the CGA (i.e. P-value = 0.043). The coefficient (b) varied substantially up to CGA = 6 µl ml−1. Above CGA = 6 µl ml−1, there was no difference in coefficient (b). The results indicated that the upper threshold was about CGA = 6 µl ml−1. In other words, the present method did show significant differences in deformability for RBCs fixed with GA solution below CGA = 6 µl ml−1. The microscopic imaging-based approach suggested in a previous study was employed to verify the results obtained by the present method. Figure 5(B) shows variations in the DIMI (ΔV) with respect to the CGA. From the results, the DIMI remained constant below CGA = 2 µl ml−1. Above CGA = 2 µl ml−1, the DIMI decreased substantially with respect to the CGA (i.e. P-value = 0.0001). By referring to figure 4(B), the DIMI obtained by the previous method only varied with the suspension solution (i.e. concentration differences in the dextran solution). From the results, it was found that the DIMI would be altered by the suspension solution or individual RBC deformability.

Figure 5. Simultaneous measurement of the ESR and RBC deformability for homogeneous hardened blood samples. (A) Quantitative evaluations of RBC deformability using coefficients in the two-term exponential model with respect to the CGA. (a) Temporal variations in the ΔVB with respect to the CGA. (b) Variations in coefficients (a) and (b) in the rising exponential term with respect to the CGA. (B) Quantitative evaluations of RBC deformability using the previous method (DIMI, ΔV) with respect to the CGA. (C) Linear regression analysis between the regression coefficients (a) and (b) and DIMI.
Download figure:
Standard image High-resolution imageAccording to the present method, the RBC deformability was quantified by using two regression coefficients (a) and (b) in the two-term exponential model. It was necessary to verify the linear relationship between the present method (regression coefficients (a) and (b)) and the previous method (DIMI (ΔV)). Figure 5(C) shows the regression coefficients (a) and (b) and DIMI (ΔV) overlapped in an X–Y plot. According to the linear regression analysis, the regression coefficient (a) and DIMI had a statistically insignificant linear relationship (i.e. R2 = 0.5788, P-value = 0.138). However, the regression coefficient (b) and DIMI had a statistically significant linear relationship (i.e. R2 = 0.8953, P-value = 0.015). From the linear relationship analysis, the regression coefficient (b) represented variations in the RBC deformability. In other words, because normal RBCs were chemically fixed and added to the same PBS solution, it was inferred that the RBC membrane fixation could be detected by means of the regression coefficient (b). In addition, by referring to figure 4(A(a)), the coefficient (a) was determined by the change in the suspension solution (i.e. dextran solution, PBS solution, and plasma). These results lead to the conclusion that the two coefficients (a) and (b) can effectively be used to detect changes in the suspension solution or individual RBC.
3.4. Simultaneous measurement of ESR and RBC deformability for heterogeneous blood
For the early detection of diseases related to hematological disorders, it was required to detect subpopulation differences in large populations of RBCs. In other words, it was necessary to verify that the proposed method had the ability to detect minor differences in whole blood. To mimic subpopulation differences in normal blood, heterogeneous blood was prepared by adding hardened blood to normal blood. Thus, the proposed method was employed to detect heterogeneous blood by means of two properties, the ESR and RBC deformability.
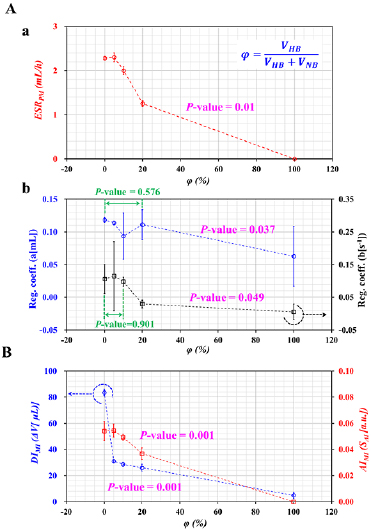
From the experimental results represented in figure 5, hardened blood was prepared by adding chemically fixed RBCs with GA solution (CGA = 8 µl ml−1) to PBS solution (i.e. VHB). In addition, to reduce the duration of the ESR experiments significantly, plasma was replaced with a specific dextran solution of 15 mg ml−1. Normal blood was then prepared by adding normal RBCs into the specific dextran solution (i.e. VNB). Heterogeneous blood was prepared by mixing normal blood with hardened blood. The mixing ratio (φ) was defined as the ratio of the hardened blood volume to the total blood volume (i.e.  ). Blood with the specific mixing ratios (φ = 0, 5%, 10%, 20%, and 100%) was prepared by adding hardened blood to normal blood. Here, φ = 0 and φ = 100% denote pure normal blood and pure hardened blood, respectively.
First, as shown in figure 6(A(a)), variations in the ESRPM were obtained by varying φ = 0, 5%, 10%, 20%, and 100%. Below φ = 5%, the ESRPM remained constant. However, above φ = 10%, the ESRPM was decreased substantially by increasing the mixing ratio (i.e. P-value = 0.01). In other words, when hardened blood (i.e. PBS as the suspension solution) was partially added to normal blood (i.e. dextran solution as the suspension solution), the concentration of the dextran solution in the normal blood was diluted considerably with respect to the mixing ratio. It was certain that the ESRPM decreased substantially due to the dilution effect of the normal blood. In addition, hardened RBCs in heterogeneous blood did not contribute to the RBC aggregation. Thus, the ESRPM showed significant differences when heterogeneous blood included at least 10% volume of hardened blood, when compared with the control (i.e. pure normal blood).
Figure 6. Simultaneous measurement of the ESR and RBC deformability for heterogeneous blood samples. A normal blood sample (Hct = 30%) was prepared by adding normal RBCs to a dextran solution (15 mg ml−1) (i.e. VNB). A hardened blood sample (Hct = 30%) was prepared by adding RBCs fixed by GA solution (CGA = 8 µl ml−1) to PBS solution (i.e. VHB). The mixing ratio (φ) was defined as the ratio of the hardened blood volume to the total blood volume (i.e.  ). Various mixing ratios were adjusted to φ = 0, 5%, 10%, 20%, and 100% by adding hardened blood to the normal blood sample. Here, φ = 0 and φ = 100% denote a pure normal blood and pure hardened blood sample, respectively. (A) Variations in the ESRPM and the regression coefficients with respect to φ. (a) Variations in the ESRPM with respect to φ. (b) Variations in the regression coefficients (a, b) with respect to φ. (B) Variations in the ESR (AIMI) and RBC deformability (DIMI) obtained by applying the previous method with respect to φ.
Download figure:
Standard image High-resolution image
Second, four regression coefficients (a)–(d) were obtained by best-fitting the ΔVB with the two-term exponential model. As shown in figures S6(A) (supplementary material), the regression coefficients (a) and (c) in the two-term exponential model were obtained by increasing the mixing ratio. The coefficient (a) was decreased considerably above φ = 20% (i.e. P-value = 0.037). The coefficient (a) showed a statistically insignificant decrease below φ = 20% (i.e. P-value = 0.576). When setting the mixing ratio (Φ) as Φ = 10% or 20%, the RBC deformability and ESR showed a significant difference. For this reason, the author did not test above Φ > 20%. The coefficient (c) did not show a significant change with respect to φ (i.e. P-value = 0.815). Figure S6(B) (supplementary material) shows variations in the regression coefficients (b, d) with respect to φ. The coefficient (b) remained constant below φ = 10% (i.e. P-value = 0.901). Above φ = 10%, the coefficient (b) decreased substantially (i.e. P-value = 0.049). The coefficient (d) had a statistically insignificant increase with respect to φ (i.e. P-value = 0.305). Figure 6(A(b)) shows the coefficients (a, b) in the rising exponential term redrawn with respect to φ. From the results, the coefficients (a) and (b) showed a significant difference when heterogeneous blood included at least 20% by volume of hardened blood, when compared with the control (i.e. pure normal blood).
Finally, the previous method that used a microscopic imaging approach was employed to verify the results obtained by the proposed method. As shown in figure 6(B), variations in the ESR (AIMI) and RBC deformability (DIMI) were obtained by varying the mixing ratio (φ). Below φ = 10%, the AIMI remained constant with respect to φ. Above φ = 10%, the AIMI decreased substantially (i.e. P-value = 0.001). In addition, above φ = 5%, the DIMI showed a statistically significant change, when compared with the control (i.e. P-value = 0.001). From the results, the previous method was able to detect heterogeneous blood that includes at least 10% by volume of hardened blood.
These results lead to the conclusion that the proposed method had the ability to detect heterogeneous blood with at least 10% hardened blood by measuring the ESR and RBC deformability. The proposed method could give comparable results to the previous method. The ESRPM and the two coefficients (a) and (b) in the rising exponential term could be effectively employed to detect subpopulations in heterogeneous blood.
In this study, while opening the outlet by removing the stopper, the VB inside the ACS tended to decrease over time. As the blood sample flowed into the micropillar channel, the VB tended to decrease and varied depending on the RBC deformability. The net blood volume (i.e. ΔVB) which was supplied to the microfluidic device was estimated as ΔVB (t) = VB (t = t1) − VB (t). The ΔVB was best fitted using the two-term exponential model (i.e. ΔVB (t) = axexp [bt] − cxexp [−dt]). Three different blood samples (i.e. dextran-included blood sample, GA-induced homogeneous blood sample, and heterogeneous blood sample) were prepared to test the feasibility of the proposed method. First, as shown in figure 4(A(b)), the coefficient (a) was varied substantially with respect to the concentration of the dextran solution. The result indicated that the coefficient (a) represented the contribution of the base solution (i.e. dextran solution) to the RBC deformability. Second, a homogeneous hardened blood sample was prepared by adding RBCs fixed with the same concentration of GA solution into 1× PBS solution. The results indicated that the coefficient (a) remained constant with respect to the CGA. However, coefficient (b) tended to decrease substantially with respect to the CGA. Considering that the blood sample had different degrees of RBC deformability in the same base solution, the coefficient (b) represented contributions of RBCs to RBC deformability. At last, the heterogeneous blood sample was prepared by partially adding a hardened blood sample to a normal blood sample. As the heterogeneous blood sample had simultaneous variations in the base solution and RBCs, it was estimated that two coefficients (a) and (b) tended to vary substantially with respect to the mixing ratio. According to the experimental results, the coefficient (a) tended to decrease substantially above a mixing ratio of 20%. Additionally, the coefficient (b) tended to decrease substantially above a mixing ratio of 10%. When compared with the microscopic imaging-based technique suggested in a previous study, the present method showed consistent results. Thus, it was certain that the proposed method could be employed to detect differences in RBC deformability.
However, the proposed method was not applied to clinical tests. As future work, it will be necessary to verify the performance of the proposed method for clinical samples, such as CVDs or malaria-infected bloods. Furthermore, from various experimental results, one will be required to understand the distinctive trends of the ESR and RBC deformability with respect to various diseases.
4. Conclusions
In this study, a simple method for the sequential measurement of the ESR and RBC deformability in resource-limited settings was suggested by quantifying the VCF, VCR, and VB inside an ACS. As a performance demonstration, first, the changes in the ESR and RBC deformability were quantified by varying two factors (Vcomp, Hct). Vcomp caused the ESRPM, and the coefficient (a) in the exponential model was varied substantially. The coefficient (a) in the rising exponential term had a strong relation to the hematocrit. Second, to stimulate the ESR of blood, a blood sample was prepared by adding normal RBCs to dextran solutions of various concentrations (Cdex = 0, 5, 10, 15, and 20 mg ml−1). Third, the proposed method was employed to detect a homogenous hardened blood sample which was partially mixed with a normal blood sample and a hardened blood sample. Finally, the proposed method was employed to detect heterogeneous bloods composed of normal blood and hardened blood. From the results, the proposed method had the ability to sufficiently detect various bloods by measuring the ESR and RBC deformability. The proposed method could be effectively employed to detect subpopulation differences in heterogeneous blood. In comparison with the previous methods, the proposed method offered two distinct advantages. First, the proposed method did not require bulky and expensive equipment, including a microscope, high-speed camera, and syringe pump. Owing to its merits, the method promised great potential for resource-limited settings. Second, the method had the ability to measure the ESR and RBC deformability by analyzing the blood volume inside the ACS simultaneously.
Acknowledgments
The author would like to acknowledge Seung-Min Yang and Ji-Woon Jung who prepared the solid model and fabricated the 3D printer-based components. This work was supported by a research fund from Chosun University (2018).
Conflicts of interest
There are no conflicts of interest to declare.